asiftahsin
08/26 06:16
Tron Price Forecast: TRX set for a correction as bearish momentum builds :
- Tron price breaks below the ascending trendline, signalling a shift in market structure from bullish to bearish.
- On-chain and derivatives data support a bearish picture as TRX’s Spot Taker CVD is in the red and funding rates flip negative.
- The technical outlook suggests a correction ahead as momentum indicators show bearish bias.
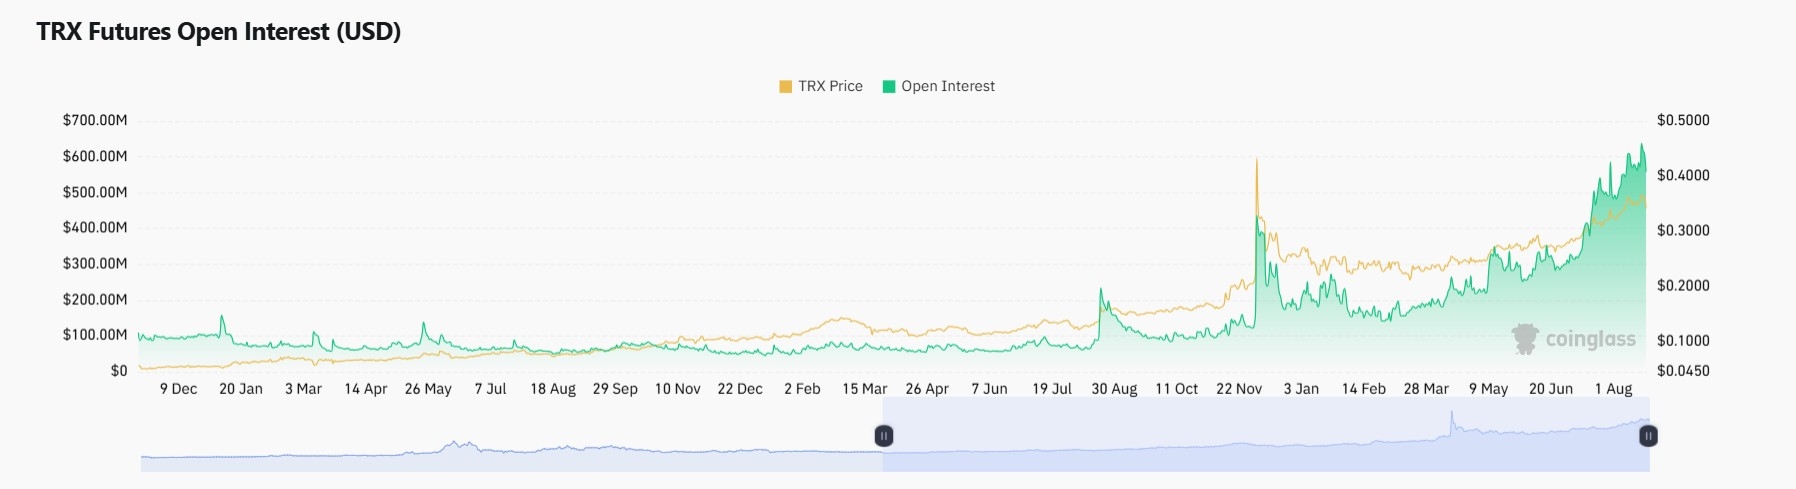
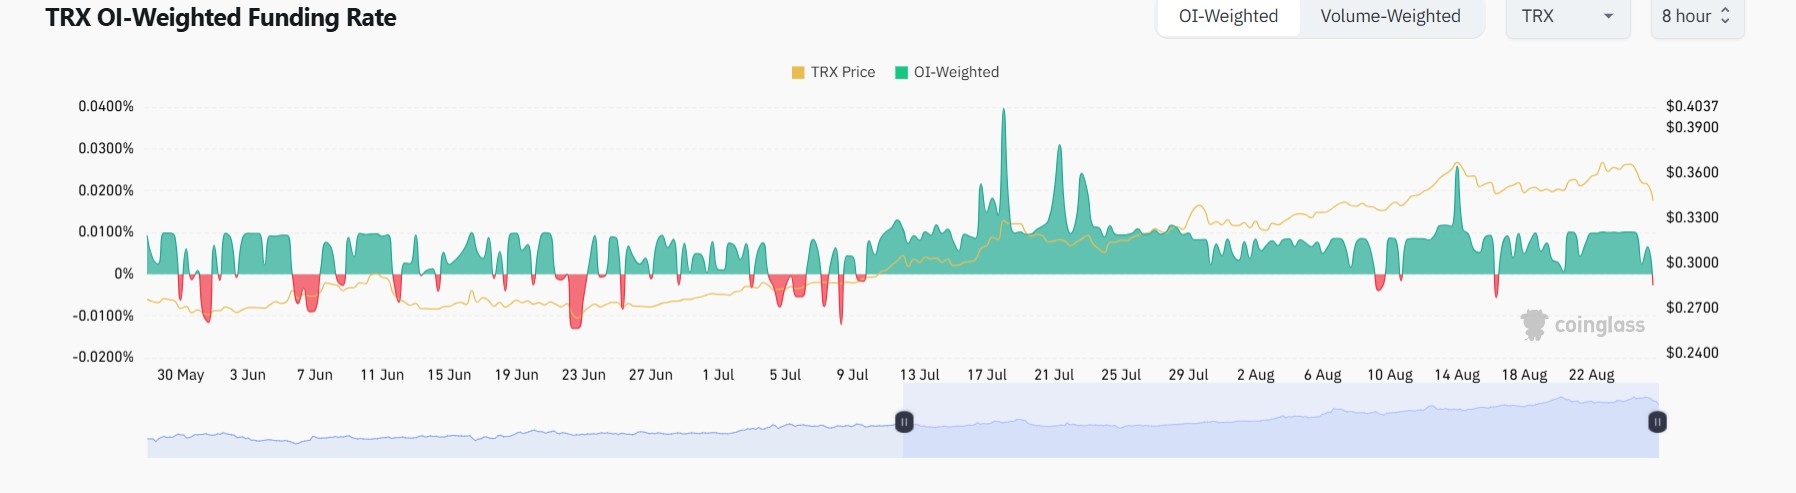
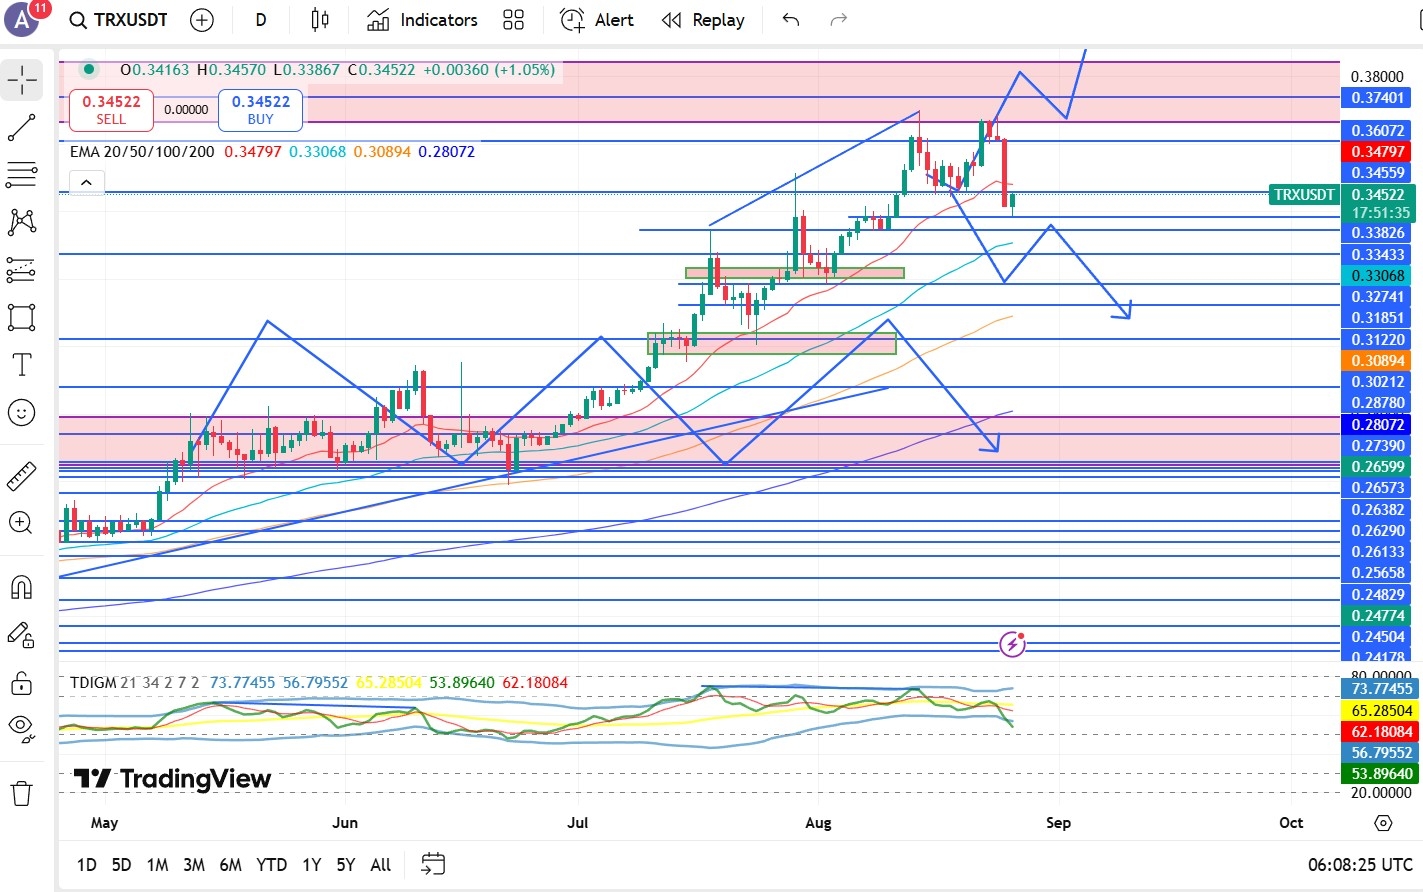
Tron (TRX) price is flashing early signs of weakness, trading around $0.345 at the time of writing on Tuesday after breaking below its ascending trendline the previous day. This breakdown suggests a potential shift in market structure from bullish to bearish. On-chain and derivatives data also support a bearish outlook, coupled with weakening momentum indicators, which reinforces the likelihood of a further correction in the near term.
Tron’s on-chain and derivatives data hints at a correction
Tron Price Forecast: TRX breaks below key support
Tron price faced rejection around its yearly high of $0.370 on Saturday and declined nearly 7% until Monday, closing below the ascending trendline (drawn by connecting multiple lows since June 22). At the time of writing, it hovers at around $0.345.
If TRX faces resistance around its daily level at $0.345 and continues its correction, it could extend the decline toward its 50-day Exponential Moving Average (EMA) at $0.330.
The Relative Strength Index (RSI) on the daily chart is hovering around its neutral level of 50, indicating indecisiveness among traders. For the bearish momentum to be sustained, the RSI must move below its neutral level. The Moving Average Convergence Divergence (MACD) showed a bearish crossover on Sunday, giving sell signals and suggesting a downward trend ahead.
However, if TRX recovers and closes above its daily resistance at $0.345 on a daily basis, it could extend the recovery toward its yearly high at $0.370.
All Comments0LatestHot