

BTC31011
07/11 04:05
Technical analysis has shown that VET, with its re
Technical analysis has shown that VET, with its recent rise, has broken out of a prolonged consolidation phase and the resistance level formed by the descending trendline.
Moreover, the asset has successfully closed the daily candle above this breakout level, which suggests that VET is now on the verge of an upward rally.
Meanwhile, the weekly chart of VET also reflects a strong bullish outlook.
According to the chart, at the time of writing, VET appears to be forming a bullish double bottom price pattern.
Moreover, it has demonstrated a bullish divergence, indicating potential growth in the coming days.
Another catalyst for VET’s potential upside is the $0.019 support level coupled with a bullish candlestick pattern.
Since November 2023, VET has reached this support level six times, each time leading to a strong rally that investors are expecting to repeat.
Technical indicators on the daily and weekly charts suggest that VET may have broken out of its prolonged bearish trend and is now poised for a sharp rally.
If the bullish momentum continues and VET stays above $0.022, the token could rally by 40%, potentially reaching $0.032.
However, a drop below $0.022 could trigger both a pullback and a sideways move.
Despite the recent rally, at the time of writing, VET is trading below its 200-day exponential moving average (EMA), indicating that it has not fully broken out of the broader downtrend.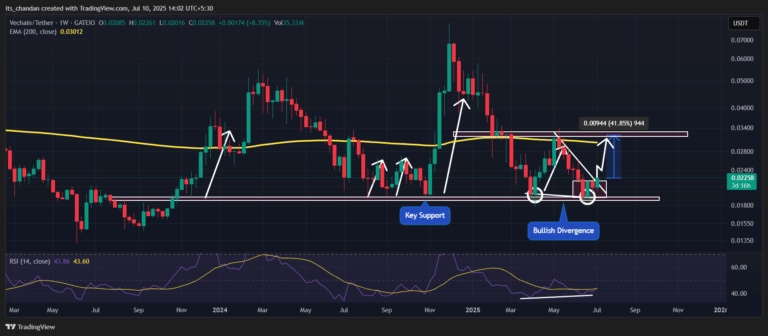
#Check In Daily, Win Prizes Daily — Join the Fun!#HTX 12th-Anniversary Carnival#Do you think Tanssi is promising? #Do you think ANIME is promising?#Do you think LISTA is promising?
1Share
All Comments0LatestHot
No records