

bit999
07/03 19:26
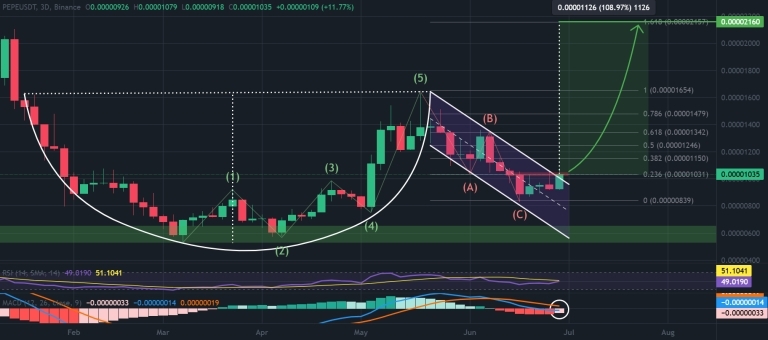
Pepe Price Analysis: Is This the Start of a Push
The early July surge has pushed Pepe to retest critical support at $0.00001035—the final barrier to confirming the breakout of a 6-month cup and handle pattern.
Having completed the corrective ABC phase of a potential Elliott Wave structure, mid-June now stands as a likely local bottom, favoring bullish continuation within the pattern’s broader trend.
Momentum indicators tell a similar story: buy pressure is returning.
The RSI has sustained a lasting uptrend for the first time since the downtrend forming the handle began, now sitting just below the neutral line at 49 as buyers step back in.
The MACD is also flashing bullish signals. While the daily chart has already confirmed a golden cross, the 3-day time frame could soon follow suit, hinting at a potential longer-term uptrend.
More so, the MACD en route to cross above the signal line in a potential golden cross. While it has already formed on the 1-day chart, the 3-day time frame points to a longer-term uptrend.
Should the PEPE price close above $0.00001035 decisively, the pattern projects a technical target in line with the 1.618 Fibonacci level at $0.00002160—a 117% gain from current levels.
The coveted $1 target will likely hinge on more sustained long-term growth driven by increased adoption and deflationary measures like token burns, given the meme coin’s current $4.28 billion market cap.
However, if it fails, PEPE risks a false breakout and a continuation of its current downtrend.
The next key support $0.0000079—aligned with the end of the prior Elliott Wave structure—potentially signaling a deeper correction.
#Join HTX On A Fitness Journey To Mars#Miss HTX Season 3 Kicks Off With Global Selection#Join HTX 12th Anniversary Quiz Challenge
4Share
All Comments0LatestHot
No records