$111M Stablecoins Flow Into Exchanges, Buying Pressure For Bitcoin?

BitcoinistPublished on 2022-10-21Last updated on 2022-10-24

Abstract

On-chain data shows large amounts of stablecoins have entered exchanges recently, something that could provide buying pressure for Bitcoin. Around...

On-chain data shows large amounts of stablecoins have entered exchanges recently, something that could provide buying pressure for Bitcoin.
Around $111 Million Stablecoins Flowed Into Exchanges In Last Couple Of Days
As pointed out by an analyst in a CryptoQuant post, the latest stablecoin inflow is the largest observed in this month so far.

The relevant indicator here is the “exchange netflow,” which measures the net amount of stablecoins (of any kind) moving into or out of wallets of all centralized spot exchanges. The metric’s value is simply calculated by taking the difference between the inflows and the outflows.
Positive values of the indicator mean a net number of stables are being deposited into exchanges right now, while negative ones imply investors are withdrawing their coins at the moment.
Since stablecoins have a relatively stable price due to them being tied to fiat (as their name already suggests), crypto market participants like to use them whenever they want to avoid the volatility associated with coins such as Bitcoin.

Once they feel that prices are right to jump back into the volatile cryptos, these investors exchange their stables back for them, thus providing a bullish effect to their prices.
Because of this, a trend of investors depositing their stablecoins into spot exchanges (that is, positive netflows) can imply buying pressure for BTC and other cryptos.

Now, here is a chart that shows the trend in the stablecoins exchange netflow over the month of October so far:

Stablecoins Exchange Netflow Bitcoin


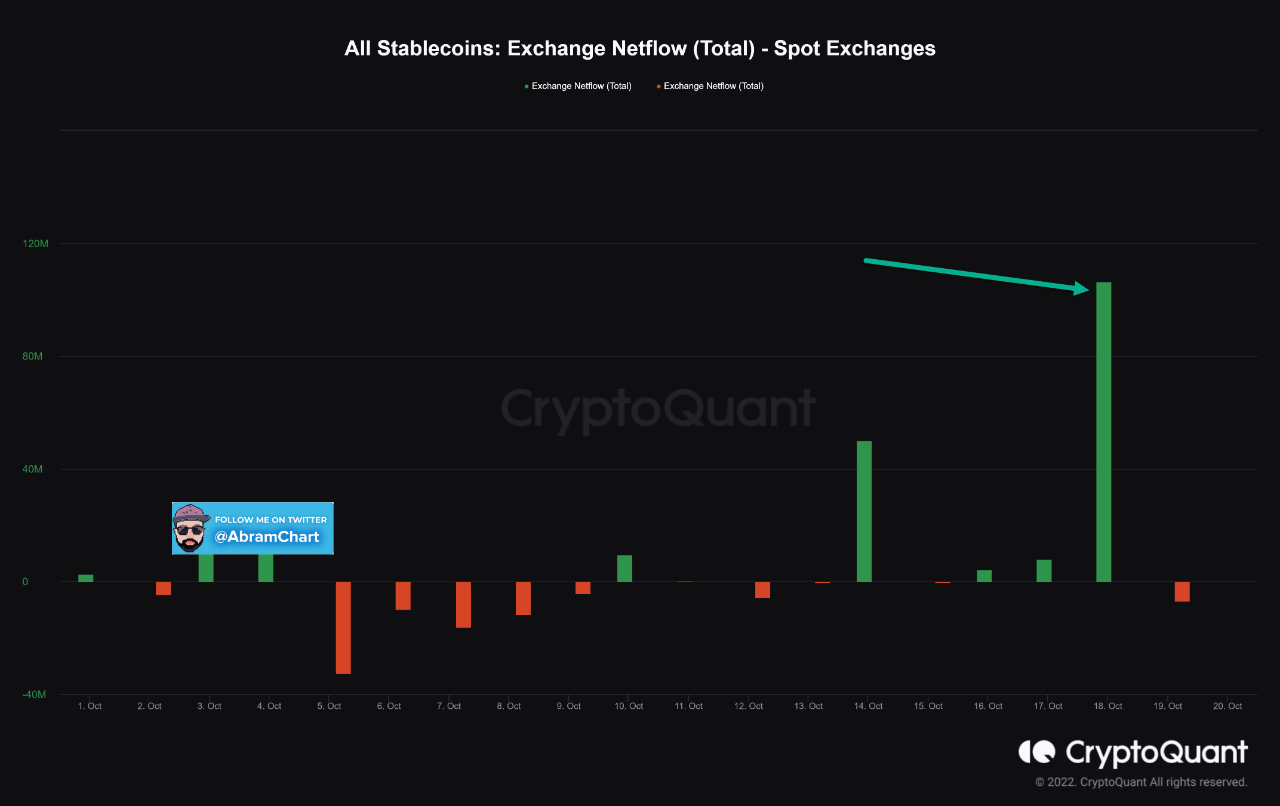
Looks like the value of the metric has spiked up during recent days | Source: CryptoQuant
As you can see in the above graph, the stablecoin spot exchange netflows have registered a high value in the last couple of days.
This spike amounted to around $111 million worth of stables moving into spot exchange wallets. While this isn’t an extremely large value, it’s still the biggest deposit by investors in the month so far.
If these inflows have indeed been made with the aim of buying up cryptos like Bitcoin, then this may have a positive impact on the prices of the volatile cryptos in the near future.
Bitcoin Price
At the time of writing, Bitcoin’s price floats around $19.2k, up 3% in the last seven days. Over the past month, the crypto has lost 1% in value.
Below is a chart that shows the trend in the price of the coin over the last five days.

Bitcoin Price Chart


The value of the crypto has continued to show stale price movement in the last few days | Source: BTCUSD on TradingView

Related Reads

Report Interpretation: J.P. Morgan Details Micron's Pre-Earnings Sentiment, Current Hardware Sector Dynamics

Morgan Stanley analyst Joshua Meyers' report (June 21, 2026) highlights key trends in the hardware and semiconductor sector ahead of Micron's earnings. The core takeaways are: 1. **Micron & Memory:** Memory remains a high-conviction long theme, driven by strong AI demand and rising ASPs. However, investor focus is shifting to the sustainability of Micron's >80% gross margins and the specifics of potential new long-term supply agreements (SCAs). 2. **Hardware Supply Chain:** AI-related demand for servers, networking, and storage remains robust, but company performance is diverging. Celestica (CLS) shows improved margin confidence, Western Digital and Seagate benefit from pricing, Fabrinet (FN) sees predictable AI optics growth, and Teradyne (TER) anticipates a new Google customer. 3. **AI Capex & WFE Forecasts:** JPMorgan increased its Wafer Fab Equipment (WFE) market growth forecasts to 28% in 2026 and 29% in 2027. AI infrastructure financing is evolving, with higher project-level debt reducing constraints on capex expansion. The report signals that while the AI-driven hardware cycle is strong, the market is entering a phase focused on execution verification (e.g., Micron's SCA details, Fabrinet's ramp with Amazon) and valuation sustainability. Key near-term signals include Micron's guidance, Arista Networks' outlook, and the pace of demand normalization post potential tariff-related pull-ins.

marsbit13m ago

Report Interpretation: J.P. Morgan Details Micron's Pre-Earnings Sentiment, Current Hardware Sector Dynamics

marsbit13m ago

Research Report Analysis: The Fed's New Chair's Debut – New Leader, But Same Script?

Report Analysis: Federal Reserve's New Chair Debut – A New Captain, But the Same Script? Morgan Stanley's chief global economist Seth B. Carpenter analyzes the first FOMC meeting under new Fed Chair Kevin Warsh in a June 21 report. Warsh deliberately avoided providing forward guidance on interest rates, aligning with his philosophy. However, market expectations for a rate hike this year were reinforced. Key signals lie elsewhere: inflation may fall more than expected, and quantitative tightening (QT) could be more aggressive than anticipated. The FOMC's "dot plot" suggests only one rate hike in 2026. Carpenter argues that if inflation undershoots forecasts, the logic for even a single hike weakens, especially as projections indicate potential rate cuts in 2027. On QT, Warsh's stance is clear. Carpenter notes that measures like halving the Treasury's account balance could shrink the Fed's balance sheet by around $500 billion with minimal market impact. Combined with adjustments to reserve interest and liquidity rules, the ultimate QT scale may exceed expectations, though its market effect might be less disruptive unless the Fed actively sells Mortgage-Backed Securities (MBS). While Warsh initiated a review of the Fed's policy framework, the 2% inflation target remains intact for now. The report concludes that the market may be overestimating the significance of reduced forward guidance and the near-term rate hike risk, while potentially underestimating the scope and manageable nature of the coming balance sheet reduction. The key debates will hinge on upcoming core PCE data, the specifics of the QT path, and the framework review's findings.

marsbit24m ago

Research Report Analysis: The Fed's New Chair's Debut – New Leader, But Same Script?

marsbit24m ago

Critical Game Week: BTC Retracement Confirmation vs. HYPE Support Battle | Guest Analysis

This weekly analysis outlines a critical juncture for BTC and HYPE markets, focusing on key price level confirmations. **BTC Analysis:** BTC is at a pivotal point after a five-wave rally from the June 5th low of $59,100. The price has broken below a short-term rising channel's lower boundary, with the current move seen as a pullback to test this breakdown. Failure to reclaim this level could lead to a retest of the $59,000-$60,000 support zone. The core scenario hinges on this channel retest outcome. * **Key Levels:** Resistance at $64,500-$65,000 (channel boundary) and $69,500-$70,500. Support at $59,000-$60,000 and $55,000. * **Strategy:** A core bearish stance is maintained (20% short from last week), with short-term plans for tactical trades. Three detailed contingency plans (A/B/C) are provided for short positions on resistance tests or breakdowns, emphasizing strict stop-loss discipline. **HYPE Analysis:** HYPE shows strong momentum but is currently in a corrective phase after hitting a new high of $76.94. The price is retesting the crucial $64-$66 support area. * **Key Levels:** Resistance near $77 and $80-$82. Support at $64-$66 and $52-$54. * **Strategy:** The short-term approach is "buy on dips, avoid chasing rallies." A long position is considered only if clear stabilization signals appear at the $64-$66 or deeper $52-$54 support zones, with tight risk controls. **General Risk Management:** A standardized trailing stop-loss protocol is emphasized: set initial stop, breakeven at +1% profit, then trail stops upward to lock in gains. *Disclaimer: All analysis is presented as a personal trading framework, not investment advice. Market conditions are complex and require dynamic adjustment.*

marsbit37m ago

Critical Game Week: BTC Retracement Confirmation vs. HYPE Support Battle | Guest Analysis

marsbit37m ago

Research Report Interpretation: Citi Attends AWS Summit, Bullish on Cloud Business Acceleration but Data Governance Remains Key Variable

Citi analyst Tyler Radke's team attended the AWS New York Summit (June 17-18), engaging with over 10 clients and partners. In a June 19 report, they highlighted the summit's focus on scaling agent AI for enterprise deployment. Citi maintains a "Buy" rating on Amazon, forecasting AWS revenue growth to accelerate to 37% in FY27 from 30% in FY26, noting this estimate may be conservative. Key takeaways: 1. **AWS Strategy Shift:** AWS is moving from proof-of-concepts to scalable deployment. New offerings like AWS Context (building enterprise knowledge graphs), Amazon Quick (cross-application AI assistant), and security tool Continuum address core enterprise pain points for AI adoption. 2. **Data Infrastructure Beneficiaries:** Data infrastructure companies like Snowflake, Elastic, Oracle, and ClickHouse are seen as direct beneficiaries of scaling AI workloads, as evidenced by strong growth and use cases presented. 3. **Critical Role of Data Governance:** As AI agents scale from hundreds to thousands, effective data governance becomes the key variable for deploying AI in core business processes. AWS Context represents AWS's strategic extension from providing compute/models to offering a data governance infrastructure layer. The report emphasizes that without solving data governance, AI will remain confined to pilot projects. The investment thesis focuses on AWS revenue acceleration and data infrastructure vendors' growth, while monitoring signals like AWS's quarterly revenue growth, Bedrock AgentCore task volume, and pricing impacts on companies like Elastic.

marsbit43m ago

Research Report Interpretation: Citi Attends AWS Summit, Bullish on Cloud Business Acceleration but Data Governance Remains Key Variable

marsbit43m ago

Crucial Week of Contention: BTC Tests Support and HYPE's Key Level Battle | Special Analysis

**Market Enters Critical Week: Bitcoin Pullback Test and HYPE Support Battle** The market enters a crucial phase of contention this week. The marginal shifts in Federal Reserve policy expectations continue to dictate the pricing rhythm for risk assets. Meanwhile, in the crypto market, following a period of sideways consolidation, the divergence between bulls and bears is becoming concentrated at key price levels. **Bitcoin (BTC) Analysis & Strategy** * **Technical View:** The 4-hour chart suggests BTC is in a five-wave structure since the June 5th low near $59,100. Price action shows a short-term rising channel. The recent drop below this channel's lower boundary is now being followed by a pullback attempt (wave 40-41). The outcome of this retest is critical. * **This Week's Outlook:** The core focus is whether BTC can reclaim and hold above the channel's lower boundary. * **Bullish Scenario:** A successful hold could lead to a continued rebound, potentially challenging the $69,500 - $70,500 resistance zone. * **Bearish Scenario:** Failure to hold may trigger a renewed test of the $59,000 - $60,000 core support area, with $55,000 as a deeper support level. * **Operational Strategy:** The author maintains a 20% mid-term short position initiated last week near $64,500, based on a model signaling a shift to a bearish structure. Short-term tactics involve using 30% capital for potential "spread" trades, with three contingency plans (A, B, C) outlined for reacting to resistance tests, breakouts, or support breakdowns. **HYPE Analysis & Strategy** * **Technical View:** On the 4-hour chart, HYPE shows strong momentum, having recently broken to a new high since January. The current pullback presents a clear three-wave correction structure, bringing the price back to the critical $64 - $66 support zone. * **This Week's Outlook:** The focus is on the battle for the $64 - $66 support area. * **Bullish Scenario:** Holding this support could signal a continuation of the uptrend from the June 10th low, leading to new highs. * **Bearish Scenario:** A breakdown could extend the correction, potentially testing the deeper $52 - $54 support band. * **Operational Strategy:** The recommended short-term approach is "buy on dips, avoid chasing rallies." A light long position (under 30% capital) could be considered if HYPE shows stabilization signals at the $64-$66 or $52-$54 support zones, confirmed by model signals. Strict stop-loss discipline is emphasized. **General Risk Management:** A strict trailing stop-loss protocol is advised: set an initial stop; move to breakeven at +1% profit; lock in profits progressively thereafter. *Disclaimer: All analysis is presented as the author's personal technical perspective and trading log, not as investment advice. Markets are complex and dynamic; risk control is paramount.*

Odaily星球日报44m ago

Crucial Week of Contention: BTC Tests Support and HYPE's Key Level Battle | Special Analysis

Odaily星球日报44m ago

Trading

Spot
Futures
活动图片