Прогноз цен на акции Solana: листинг Fidelity вселяет оптимизм, но графики предупреждают о тестировании ключевого уровня поддержки

cryptonews.ruPublished on 2025-04-23Last updated on 2025-10-24

  • Цена Solana сегодня составляет $193, а покупатели защищают зону поддержки $186 на волатильной неделе.
  • Fidelity предоставляет SOL доступ к брокерским счетам на сумму 5,8 триллиона долларов, что вселяет оптимизм в отношении долгосрочного внедрения.
  • Валютные потоки демонстрируют чистый приток в размере 15,27 млн ​​долларов США, однако более широкая тенденция оттока сохраняет риски снижения.

Цена Solana сегодня торгуется на уровне $193, сохраняя умеренный рост после волатильного отката с октябрьских максимумов. Токен торгуется чуть выше ключевых уровней технической поддержки, поскольку трейдеры взвешивают решение Fidelity сделать SOL доступным для всех клиентов брокерских компаний США на фоне сохраняющегося давления оттока средств с биржи.

Покупатели защищают поддержку канала по мере сближения EMA

Ценовое движение SOL (Источник: TradingView)

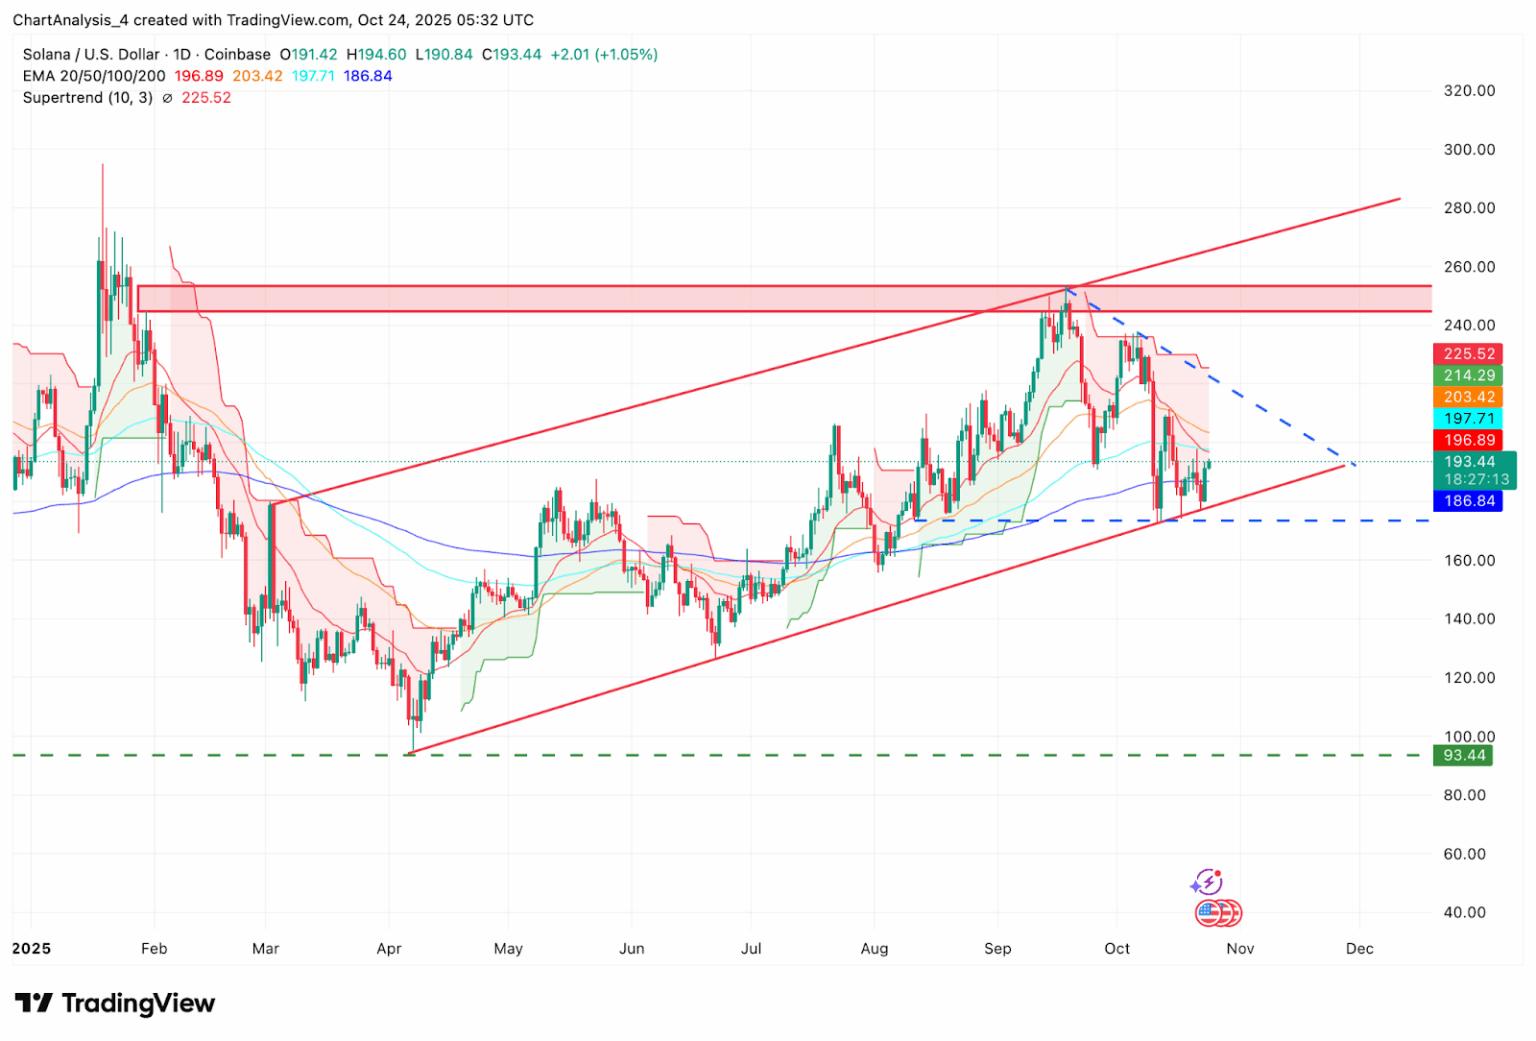
На дневном графике видно, как цена акций Solana консолидируется в рамках долгосрочного восходящего канала. Цена недавно протестировала зону $186, где 200-дневная экспоненциальная скользящая средняя (EMA) обеспечивает структурную поддержку. Диапазон $196–$198, определяемый 20-дневной экспоненциальной скользящей средней (EMA) и краткосрочным кластером, теперь служит точкой разворота.

Устойчивый прорыв ниже $186 создаст риск дальнейшего снижения до уровня $170, в то время как покупателям для восстановления доверия потребуется закрытие выше $203. Верхний уровень сопротивления остаётся внушительным на уровне $225–$230, совпадая с барьером супертренда и предыдущей зоной отскока.

На данный момент прогноз цены Solana показывает сбалансированный профиль риска: трейдеры ожидают как теста на пробой, так и потенциального восстановления канала.

Доступ Fidelity к $5,8 трлн открывает новые возможности для Solana

BREAKING: @Fidelity, the asset manager with $5.8 Trillion in AUM, makes SOL accessible for all US brokerage customers 🔥 pic.twitter.com/t5F1DauESm

— Solana (@solana) October 23, 2025

Новость о том, что Fidelity предоставила доступ к торгам токенами SOL для своей клиентской базы с оборотом в 5,8 триллиона долларов, оживила рыночные настроения. Листинг открывает доступ к миллионам брокерских счетов в США, что является важной вехой для принятия Solana на институциональном уровне.

Это заявление вызвало ажиотаж в социальных сетях и создало психологический импульс: сегодня цена акций Solana вернулась к отметке $193 после кратковременного падения ниже $190. Этот катализатор может помочь нейтрализовать краткосрочное давление продаж, хотя техническое сопротивление остаётся сильным.

Валютные потоки посылают противоречивые сигналы о ценовой динамике Solana

SOL Netflows (Источник: Coinglass)

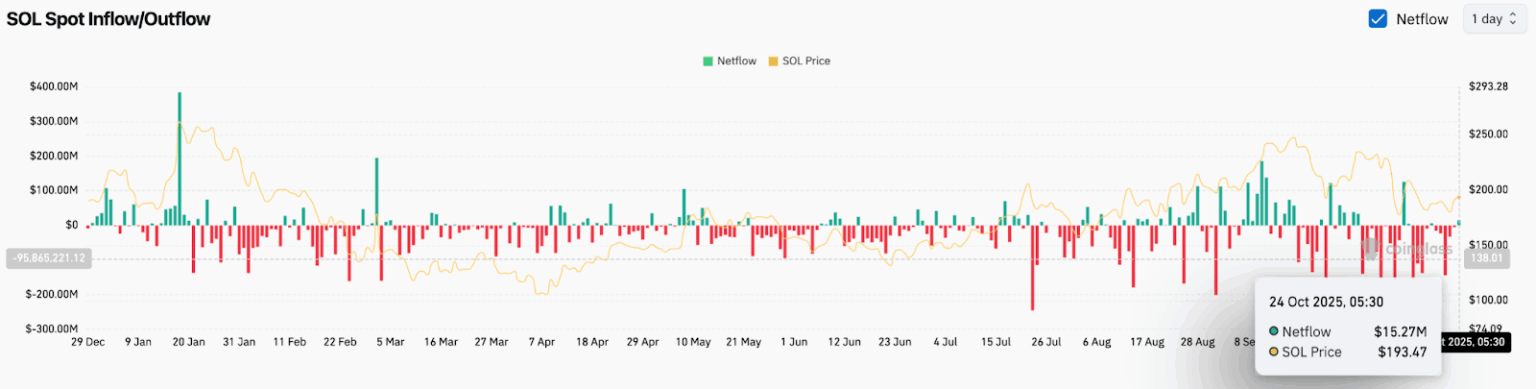
Данные о блокчейне раскрывают неоднозначный фон ценовой динамики Solana. Данные о биржевых потоках показывают чистый приток средств в размере 15,27 млн ​​долларов США 24 октября, что указывает на возобновление накопления. Однако более общая картина отражает продолжающийся отток средств в течение нескольких недель, который оказывал давление на волатильность цен Solana в течение всего октября.

Для трейдеров тенденция притока остаётся критически важной. Устойчивый положительный приток может подтвердить прогноз Fidelity и способствовать росту курса до $203 и $214. Однако возвращение к значительному оттоку может усилить импульс продаж и сделать акции Solana уязвимыми к снижению до $170.

Перспективы: вырастет ли Солана?

Прогноз цены на Solana на 25 октября зависит от баланса между доступом новых институциональных инвесторов и технической нестабильностью. Быкам необходимо защитить $186 и вернуть $203, чтобы подготовиться к движению к $214 и $225. Положительный приток инвестиций придаст уверенности, необходимой для более широкого ралли.

Если покупателям не удастся удержать нижний предел в $186, акции Solana могут опуститься до $170, прежде чем стабилизироваться, что ставит под угрозу восходящий тренд канала. Листинг Fidelity предлагает сильный долгосрочный катализатор, но краткосрочный импульс всё ещё зависит от преодоления сопротивления.

Trending Cryptos

Related Reads

Report Interpretation: J.P. Morgan Details Micron's Pre-Earnings Sentiment, Current Hardware Sector Dynamics

Morgan Stanley analyst Joshua Meyers' report (June 21, 2026) highlights key trends in the hardware and semiconductor sector ahead of Micron's earnings. The core takeaways are: 1. **Micron & Memory:** Memory remains a high-conviction long theme, driven by strong AI demand and rising ASPs. However, investor focus is shifting to the sustainability of Micron's >80% gross margins and the specifics of potential new long-term supply agreements (SCAs). 2. **Hardware Supply Chain:** AI-related demand for servers, networking, and storage remains robust, but company performance is diverging. Celestica (CLS) shows improved margin confidence, Western Digital and Seagate benefit from pricing, Fabrinet (FN) sees predictable AI optics growth, and Teradyne (TER) anticipates a new Google customer. 3. **AI Capex & WFE Forecasts:** JPMorgan increased its Wafer Fab Equipment (WFE) market growth forecasts to 28% in 2026 and 29% in 2027. AI infrastructure financing is evolving, with higher project-level debt reducing constraints on capex expansion. The report signals that while the AI-driven hardware cycle is strong, the market is entering a phase focused on execution verification (e.g., Micron's SCA details, Fabrinet's ramp with Amazon) and valuation sustainability. Key near-term signals include Micron's guidance, Arista Networks' outlook, and the pace of demand normalization post potential tariff-related pull-ins.

marsbit3h ago

Report Interpretation: J.P. Morgan Details Micron's Pre-Earnings Sentiment, Current Hardware Sector Dynamics

marsbit3h ago

Research Report Analysis: The Fed's New Chair's Debut – New Leader, But Same Script?

Report Analysis: Federal Reserve's New Chair Debut – A New Captain, But the Same Script? Morgan Stanley's chief global economist Seth B. Carpenter analyzes the first FOMC meeting under new Fed Chair Kevin Warsh in a June 21 report. Warsh deliberately avoided providing forward guidance on interest rates, aligning with his philosophy. However, market expectations for a rate hike this year were reinforced. Key signals lie elsewhere: inflation may fall more than expected, and quantitative tightening (QT) could be more aggressive than anticipated. The FOMC's "dot plot" suggests only one rate hike in 2026. Carpenter argues that if inflation undershoots forecasts, the logic for even a single hike weakens, especially as projections indicate potential rate cuts in 2027. On QT, Warsh's stance is clear. Carpenter notes that measures like halving the Treasury's account balance could shrink the Fed's balance sheet by around $500 billion with minimal market impact. Combined with adjustments to reserve interest and liquidity rules, the ultimate QT scale may exceed expectations, though its market effect might be less disruptive unless the Fed actively sells Mortgage-Backed Securities (MBS). While Warsh initiated a review of the Fed's policy framework, the 2% inflation target remains intact for now. The report concludes that the market may be overestimating the significance of reduced forward guidance and the near-term rate hike risk, while potentially underestimating the scope and manageable nature of the coming balance sheet reduction. The key debates will hinge on upcoming core PCE data, the specifics of the QT path, and the framework review's findings.

marsbit4h ago

Research Report Analysis: The Fed's New Chair's Debut – New Leader, But Same Script?

marsbit4h ago

Critical Game Week: BTC Retracement Confirmation vs. HYPE Support Battle | Guest Analysis

This weekly analysis outlines a critical juncture for BTC and HYPE markets, focusing on key price level confirmations. **BTC Analysis:** BTC is at a pivotal point after a five-wave rally from the June 5th low of $59,100. The price has broken below a short-term rising channel's lower boundary, with the current move seen as a pullback to test this breakdown. Failure to reclaim this level could lead to a retest of the $59,000-$60,000 support zone. The core scenario hinges on this channel retest outcome. * **Key Levels:** Resistance at $64,500-$65,000 (channel boundary) and $69,500-$70,500. Support at $59,000-$60,000 and $55,000. * **Strategy:** A core bearish stance is maintained (20% short from last week), with short-term plans for tactical trades. Three detailed contingency plans (A/B/C) are provided for short positions on resistance tests or breakdowns, emphasizing strict stop-loss discipline. **HYPE Analysis:** HYPE shows strong momentum but is currently in a corrective phase after hitting a new high of $76.94. The price is retesting the crucial $64-$66 support area. * **Key Levels:** Resistance near $77 and $80-$82. Support at $64-$66 and $52-$54. * **Strategy:** The short-term approach is "buy on dips, avoid chasing rallies." A long position is considered only if clear stabilization signals appear at the $64-$66 or deeper $52-$54 support zones, with tight risk controls. **General Risk Management:** A standardized trailing stop-loss protocol is emphasized: set initial stop, breakeven at +1% profit, then trail stops upward to lock in gains. *Disclaimer: All analysis is presented as a personal trading framework, not investment advice. Market conditions are complex and require dynamic adjustment.*

marsbit4h ago

Critical Game Week: BTC Retracement Confirmation vs. HYPE Support Battle | Guest Analysis

marsbit4h ago

Trading

Spot
Futures

Hot Articles

Discussions

Welcome to the HTX Community. Here, you can stay informed about the latest platform developments and gain access to professional market insights. Users' opinions on the price of SOL (SOL) are presented below.

活动图片