Both are Top Derivatives Protocols, Is Lighter's P/E Ratio Really Twice That of Hyperliquid?

marsbitPublished on 2026-10-08Last updated on 2026-10-08

Abstract

"Two top-tier derivative protocols, Hyperliquid and Lighter, are often compared, but with inconsistent metrics. This analysis standardizes the valuation framework using the same criteria for both. It employs the Outstanding Token Supply (OTS) method, which counts circulating tokens plus locked allocations for teams and investors, while excluding treasury reserves. Earnings are annualized from September 2026 data. The results show Lighter's price-to-earnings (P/E) ratio is approximately double that of Hyperliquid: 88.1x versus 43.3x. Hyperliquid's OTS valuation is $43 billion with annualized earnings of $994 million. Lighter's OTS valuation is $2.85 billion. As Lighter doesn't directly disclose profits, its September buyback amount of $2.7 million is used as a proxy, leading to annualized 'earnings' of $32.4 million. This comparison indicates the market currently values each dollar of Lighter's earnings about twice as much as Hyperliquid's. However, the article notes this single-month snapshot doesn't imply mispricing, as P/E ratios reflect growth expectations, profitability, and risk. Key limitations include using buybacks as an earnings proxy for Lighter, the short one-month sample period, and the exclusion of distributed ecosystem rewards from the OTS calculation."

Authored by: GLC Research

Compiled by: Chopper, Foresight News

Hyperliquid and Lighter are two projects often compared in terms of revenue and valuation in the market. However, most comparisons lack strong reference value because each side selects data favorable to their own argument: one uses circulating supply, the other fully diluted supply; one counts fees, the other net profit; or uses one week's revenue data versus annual data.

This article adopts the same set of calculation standards for both tokens. Token supply uses the framework established by HSI and HRC (Note: HRC is the Hyperliquid Research Consortium, jointly initiated by institutions including Four Pillars and GLC Research; HSI is a digital asset treasury listed company focused on the Hyperliquid ecosystem and is one of the largest HYPE holders in the market). Profit data uniformly selects September 2026 monthly data and annualizes it. This article does not provide any long/short judgments on the tokens; its purpose is solely to show the valuation levels of the two projects when definitions and metrics are completely consistent.

Result: 43x vs 88x

Under unified metrics, Lighter's price-to-earnings (P/E) ratio is approximately twice that of Hyperliquid, at 88.1x and 43.3x respectively.
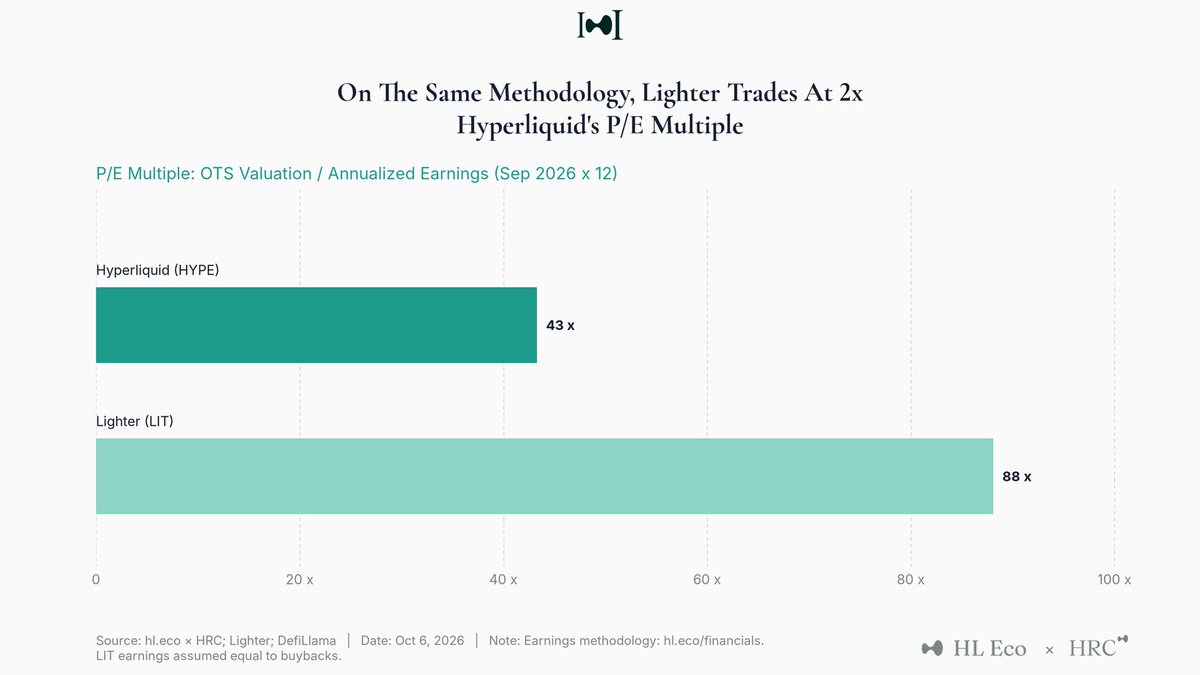
The P/E ratio here is derived by dividing the OTS valuation by the annualized earnings, where annualized earnings equal September 2026 earnings multiplied by 12.
Supply: Outstanding Token Supply (OTS)

This valuation entirely uses the OTS metric. OTS counts tokens that are already circulating or allocated to designated holders according to a public, fixed schedule. It sits between circulating supply and fully diluted supply, most closely resembling the equivalent concept of stock market capitalization.

Both tokens use exactly the same statistical rules:

  • Include: Circulating tokens, plus team and investor allocation shares (even if still locked, counted in full)
  • Exclude: Reserve tokens, such as future unreleased tokens, community rewards, ecosystem reserves
  • Deduct: Burned tokens, tokens repurchased and retired per buyback policies

According to hl.eco data, Hyperliquid's OTS valuation is $43 billion.

Lighter's token distribution plan comes from team tweets: 50% ecosystem share (half airdropped at launch), 26% team share, 24% investor share. Team and investor tokens have a 1-year lockup, followed by a 3-year linear vesting period.
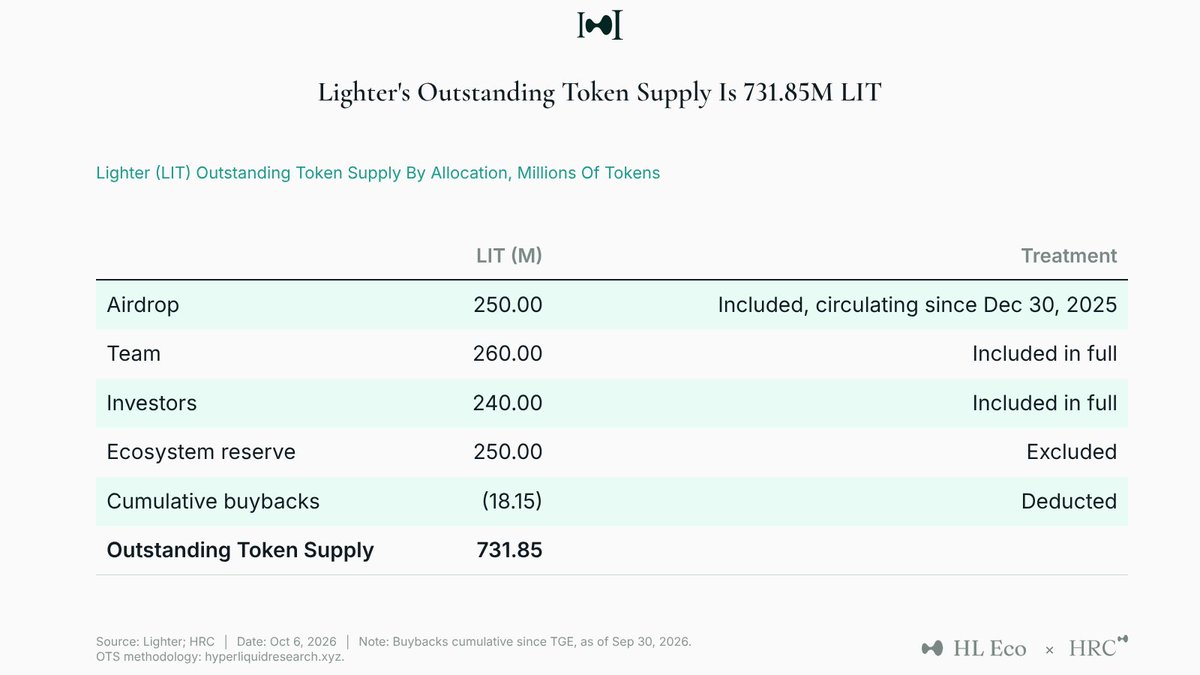
Calculated at the LIT price of $3.896 on October 6, 2026, Lighter's OTS valuation is $2.85 billion. According to team disclosure, Lighter has repurchased 18.15 million LIT since launch and burns the repurchased tokens. A portion is yet to be executed for burning, and this calculation has deducted them in full; consistent with the treatment of HYPE held by the Hyperliquid Rescue Fund, which is deducted immediately upon repurchase.

Both tokens undergo the same simplification: staking rewards and incentives already distributed from the ecosystem reserve are not counted in OTS. This portion is minimal relative to total supply, and this treatment aligns with the statistical approach for HYPE's future token releases and community rewards.

Earnings: Uniformly Using Same Month Data

Both projects' earnings data are taken from September 2026 and then annualized by multiplying by 12. A calendar month is chosen because Lighter discloses buyback data monthly.

Hyperliquid's earnings metric follows the financial framework established by hl.eco and HRC.

Revenue = Trading fees after deducting developer and deployer shares + Priority fees + HyperEVM Gas fees + Auction burn proceeds + USDC reserve interest.

Earnings = Revenue - Fee share paid to HLP.

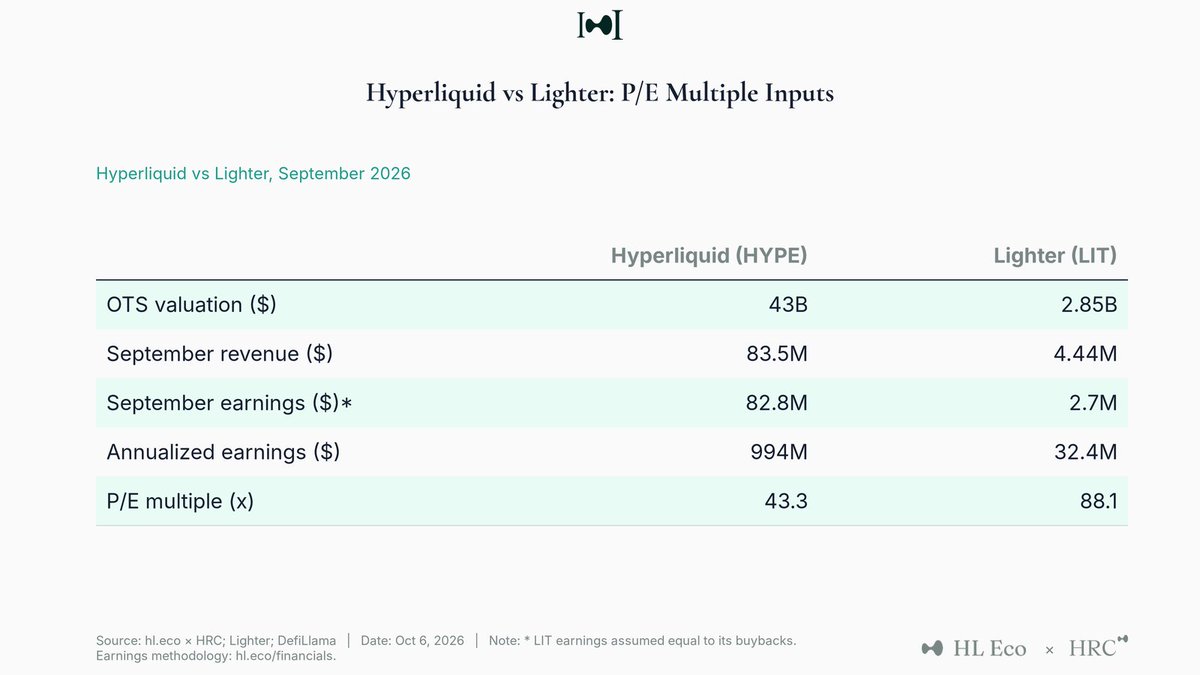
September revenue was $83.5 million, earnings were $82.8 million, annualized earnings $994 million. No team or shareholders take a cut; earnings are returned to HYPE holders via buyback and burn.

Lighter does not directly disclose earnings data. This article uses the buyback amount as the closest proxy. According to team disclosure, Lighter's total September revenue was $4.44 million, with 597,200 LIT repurchased. The average price for the month was $4.52, corresponding to a buyback amount of $2.70 million, annualized to $32.4 million.

The September buyback size nearly equals the $2.72 million revenue generated by Lighter's core business, with the remaining $1.72 million revenue coming from Robinhood Chain operations.

Conclusion Boundaries: What It Can and Cannot Explain

This comparison only indicates that, based on current annualized earnings, the market is paying approximately twice the valuation for every $1 of Lighter's earnings compared to Hyperliquid.

But this does not mean either token is mispriced. The P/E ratio reflects market expectations for growth, profit margins, and risk, which single-month earnings data cannot fully capture. A higher P/E can be supported by higher expected growth rates; a lower P/E often corresponds to a larger, more mature earnings base. The research team itself holds views on this, but this article makes no such judgments, only presenting the valuation multiples based on September data.

Three limitations of this article should be noted:

  • Lighter's earnings are an approximation; buyback amount is only a proxy. If Lighter retains part of its revenue (e.g., Robinhood Chain fees), its actual earnings would be higher, and its P/E would be lower. If using total revenue instead of buyback amount, the P/E would be approximately 54x.
  • Short sample window: Both protocols use September single-month data annualized, maintaining uniform comparison metrics, but single-month performance may be above or below long-term trends.
  • Reserve distributions excluded: Distributed ecosystem reserve rewards for both tokens are not included in OTS. If included, both valuations would increase slightly.


Related Questions

QWhat is the main comparison made in the article regarding Lighter and Hyperliquid?

AThe article compares the Price-to-Earnings (P/E) ratios of the Lighter (LIT) and Hyperliquid (HYPE) tokens. Under a unified calculation standard, it finds Lighter's P/E ratio is approximately double that of Hyperliquid (88.1x vs. 43.3x).

QWhat metric does the article use for token supply in its valuation comparison, and what does it stand for?

AThe article uses OTS (Outstanding Token Supply) for valuation. OTS counts tokens that are already circulating or allocated to specific holders (like team and investors) according to a fixed, public schedule, excluding reserves like future emissions, community rewards, and treasury holdings.

QWhat month's data is used to calculate the annualized earnings for both protocols in this analysis?

AThe analysis uses earnings data from September 2026, which is then multiplied by 12 to get an annualized figure.

QFor Lighter, what proxy is used to estimate its monthly 'profit' since it does not directly disclose this figure?

AFor Lighter, the article uses the amount of LIT tokens repurchased (and destined for burning) during September 2026 as a proxy for its profit.

QAccording to the article, what are two key limitations or caveats of the presented P/E ratio comparison?

ATwo key limitations are: 1) Lighter's 'profit' is an approximation based on buyback amount, not a direct financial figure. Its actual profit could be higher if it retains some revenue. 2) The analysis is based on a single month's data (September 2026), which may not represent long-term trends.

Related Reads

Google says hackers use AI agents to find and exploit software flaws

Google Threat Intelligence Group (GTIG) has for the first time identified attackers using AI large language model frameworks to automate software vulnerability discovery and exploitation without step-by-step human direction. In a report published Monday, researchers described a tool found on an exposed staging server that compared software versions, identified potential flaws, and generated and executed exploit code. GTIG said threat actors used LLM frameworks to fully automate vulnerability discovery and exploitation without a human in the loop, hosting a multi-agent vulnerability research and weaponization framework designed to conduct continuous differential analysis comparing code before and after patch announcements on popular web applications, autonomously discovering and exploiting software vulnerabilities. Google warned these automated workflows give organizations less time to apply security patches before attackers develop ways to exploit vulnerable systems. Attackers are leveraging AI agent frameworks to automate patch reverse engineering via differential analysis and weaponizing N-day vulnerabilities. Vulnerability disclosures more than doubled between January and August, with exploited zero-days averaging eight per month in 2025 and 11 per month from January through August 2026, reaching 22 in August. Automated workflows also accelerate attackers' ability to move from initial access to domain administrator access, as cited in an August 2026 PaperCut campaign where attackers achieved that control within minutes. GTIG said two PHP vulnerabilities involved in exploitation attempts were discovered using LLM analysis. Anthropic also warned that AI-assisted attacks have evolved into multi-agent operations automating most of the cyberattack cycle from discovery to exploitation and data theft.

cointelegraph27m ago

Google says hackers use AI agents to find and exploit software flaws

cointelegraph27m ago

Coin-Stock Trend Indicator丨Third-largest BTC treasury company Twenty One Capital buys $10 million in BTC for the first time since July 2025; Bitmine total holdings value drops $2.5 billion in a week (November 17)

This week's crypto stock snapshot notes that the recent US equity move was merely an oversold rebound rather than a new high, with the impact of the Democratic midterm election win still spreading and Nvidia founder Jensen Huang's resignation controversy evolving into a broader AI-sector storm. The week's biggest US market event is Anthropic's IPO on November 19, though its fundraising and valuation fall short of SpaceX's record. Japanese stocks remain favored by Morgan Stanley analysts despite AI-related weakness, while Korean stocks fell 2.59% to 4,968.45, their lowest since February 2. In crypto stocks, last week's market crash hit DAT treasury companies hard, with ETH treasury firm Bitmine's holdings value dropping from $14.3 billion to $11.8 billion in a week, nearly all due to ETH's price decline. Listed companies (excluding miners) bought a net $51.86 million in Bitcoin last week, down 45.2% week-over-week. Strategy bought 485 BTC at $68,887 each for about $33.4 million, bringing total holdings to 850,849 BTC; Metaplanet bought none. Capital B bought 12 BTC at $77,500.2, holding 3,550 BTC; Strive bought 251 BTC at $69,853 for about $17.53 million, holding about 43,404 BTC. Total tracked holdings reached 1,171,317 BTC, up 0.04% week-over-week, worth about $75.53 billion, or 5.8% of Bitcoin's circulating market cap. Twenty One Capital bought 154.32 BTC for about $10 million in cash, its first purchase since July 2025, bringing holdings to about 43,700 BTC and making it the third-largest listed Bitcoin treasury; CEO Rapha Zagury said volatility creates opportunity and the firm bought the dip. BitMine added 7,653 ETH last week, holding 6,077,745 ETH (4.97% of total supply, 0.03% short of its 5% goal) plus 216 BTC, a $180 million investment in Beast Industries, $67 million in Eightco Holdings, and $448 million in cash and securities; its ETH holdings are worth about $11.1 billion at $1,823 per ETH. Chairman Tom Lee attributed ETH's 28% two-week drop to Nvidia-related turmoil triggering Asian margin selling and investors raising cash for Anthropic's reported November 18 IPO, saying it contradicts improving fundamentals. DeFi Development Corp. added 9,482 SOL, with Solana treasury holdings reaching about 2.62 million tokens, growing for a 10th straight week; its CHAD preferred stock raised enough to buy over 230 SOL today. CZ said Japan-listed ASIAN STAR will distribute 8 million yen worth of BNB to shareholders and pursue Japanese real estate tokenization on BNB Chain. DeFi Technologies reported Q3 2026 revenue of $18.3 million (down about 18% year-over-year), operating income of $7 million, and net profit of $22.3 million, with $53.4 million in cash and stablecoins and $48.2 million in digital assets. Ripple-backed Evernorth disclosed its 346 million XRP was booked at $342 million versus an initial $847 million record value, with cumulative impairments of $505 million, a nearly 60% decline.

marsbit52m ago

Coin-Stock Trend Indicator丨Third-largest BTC treasury company Twenty One Capital buys $10 million in BTC for the first time since July 2025; Bitmine total holdings value drops $2.5 billion in a week (November 17)

marsbit52m ago

SMIC Closes In on Global No. 2

SMIC is closing in on the global foundry industry's second place. In the first three quarters of 2026, the company reported revenue of 60.618 billion yuan (up 22.43% year-on-year) and net profit of 7.314 billion yuan (up 91.57%), with gross margin hitting a four-year high of 25.59%. In Q2, Samsung held 5.9% of the global foundry market versus SMIC's 5.4%—a gap of just 0.5 percentage points, down from 1.4 points the previous quarter. Revenue-wise, the two were only about $254 million apart in Q2, and SMIC's Q4 guidance of $3.32–3.38 billion would exceed Samsung's Q2 level. Growth is no longer driven mainly by smartphones, whose share of wafer revenue fell from 21.5% to 14.3%, amid a 15.2% decline in domestic smartphone shipments. Instead, industrial and automotive revenue nearly doubled, rising from 11.9% to 19.3% of revenue, while computer and tablet revenue grew about 55%. SMIC has invested in BCD processes covering battery management, digital isolation, and smart power switches, with some processes meeting Grade 0 automotive standards. AI demand is also creating new opportunities in mature-node chips such as power management, controllers, and specialty memory; customer pull for these AI-supporting chips exceeded expectations, prompting SMIC to trim engineering and R&D wafers to prioritize mass-production orders. Q3 wafer shipments exceeded 3 million 8-inch equivalent wafers for the first time, with utilization at 97.3%. A key financial inflection point: after tripling capacity over a decade (from 339,000 to 1.1168 million wafers per month), SMIC's capital expenditure is falling—Q3 capex dropped 56.5% year-on-year to 7.423 billion yuan, and cash paid for fixed assets fell over 30% versus 2024 and 2025. Major expansion projects in Shanghai, Beijing, Tianjin, and Shenzhen are 95–98% complete, with construction-in-progress declining from 92.619 billion to 62.652 billion yuan as projects transfer to fixed assets. However, management cautions that longer equipment lead times could disrupt capex pacing, and Q4 gross margin guidance of 26–28% is below Q3's 29.9% due to new capacity and R&D costs. The next decade's challenge is not just overtaking Samsung, but proving that past massive investments can steadily convert into real profits and cash flow.

marsbit1h ago

SMIC Closes In on Global No. 2

marsbit1h ago

Trading

Spot
活动图片