Bitcoin Volatility Halved Yet Extreme Days Exceed 2018: VaR Models May Underestimate Tail Risk

marsbitPublished on 2026-10-10Last updated on 2026-10-10

Abstract

Bitcoin's volatility has significantly decreased in 2026, with annualized volatility dropping to approximately 46% from around 84% in 2018. However, it has already recorded 10 "3-sigma" trading days this year—days where price moves deviate by at least three standard deviations from recent norms—surpassing the 8 such days observed in the entirety of 2018. This indicates that while average daily price swings are calmer, extreme outlier movements remain frequent, even surpassing the frequency seen in a previous bear market. This paradox presents a challenge for standard risk models like Value-at-Risk (VaR), which often rely on recent volatility to gauge risk. Lower volatility can misleadingly signal reduced risk, potentially encouraging larger positions while failing to adequately capture persistent "tail risk"—the potential for rare but severe losses. Experts note the industry is shifting towards metrics like Expected Shortfall to better account for these extreme outcomes. Market participants attribute the continued occurrence of these sharp swings to unpredictable macroeconomic shocks and highly leveraged options positions, particularly strategies like shorting volatility or call overwriting. These strategies can amplify price moves when unexpected news triggers a market shift. Despite the persistent volatility spikes, the market demonstrates greater resilience in absorbing them, attributed to increased institutional participation, deeper liquidity from ETFs, and improved o...

Author: Omkar Godbole

Translated by: TechFlow

TechFlow Introduction: CoinDesk calculations show that Bitcoin has already recorded 10 '3-sigma' trading days in 2026, exceeding the 8 such days in the entire 2018 bear market, while its annualized volatility has dropped from about 84% to around 46%. For VaR position models reliant on volatility, the seemingly calmer surface may precisely encourage increasing positions, yet miss the recurring tail shocks that are still happening.
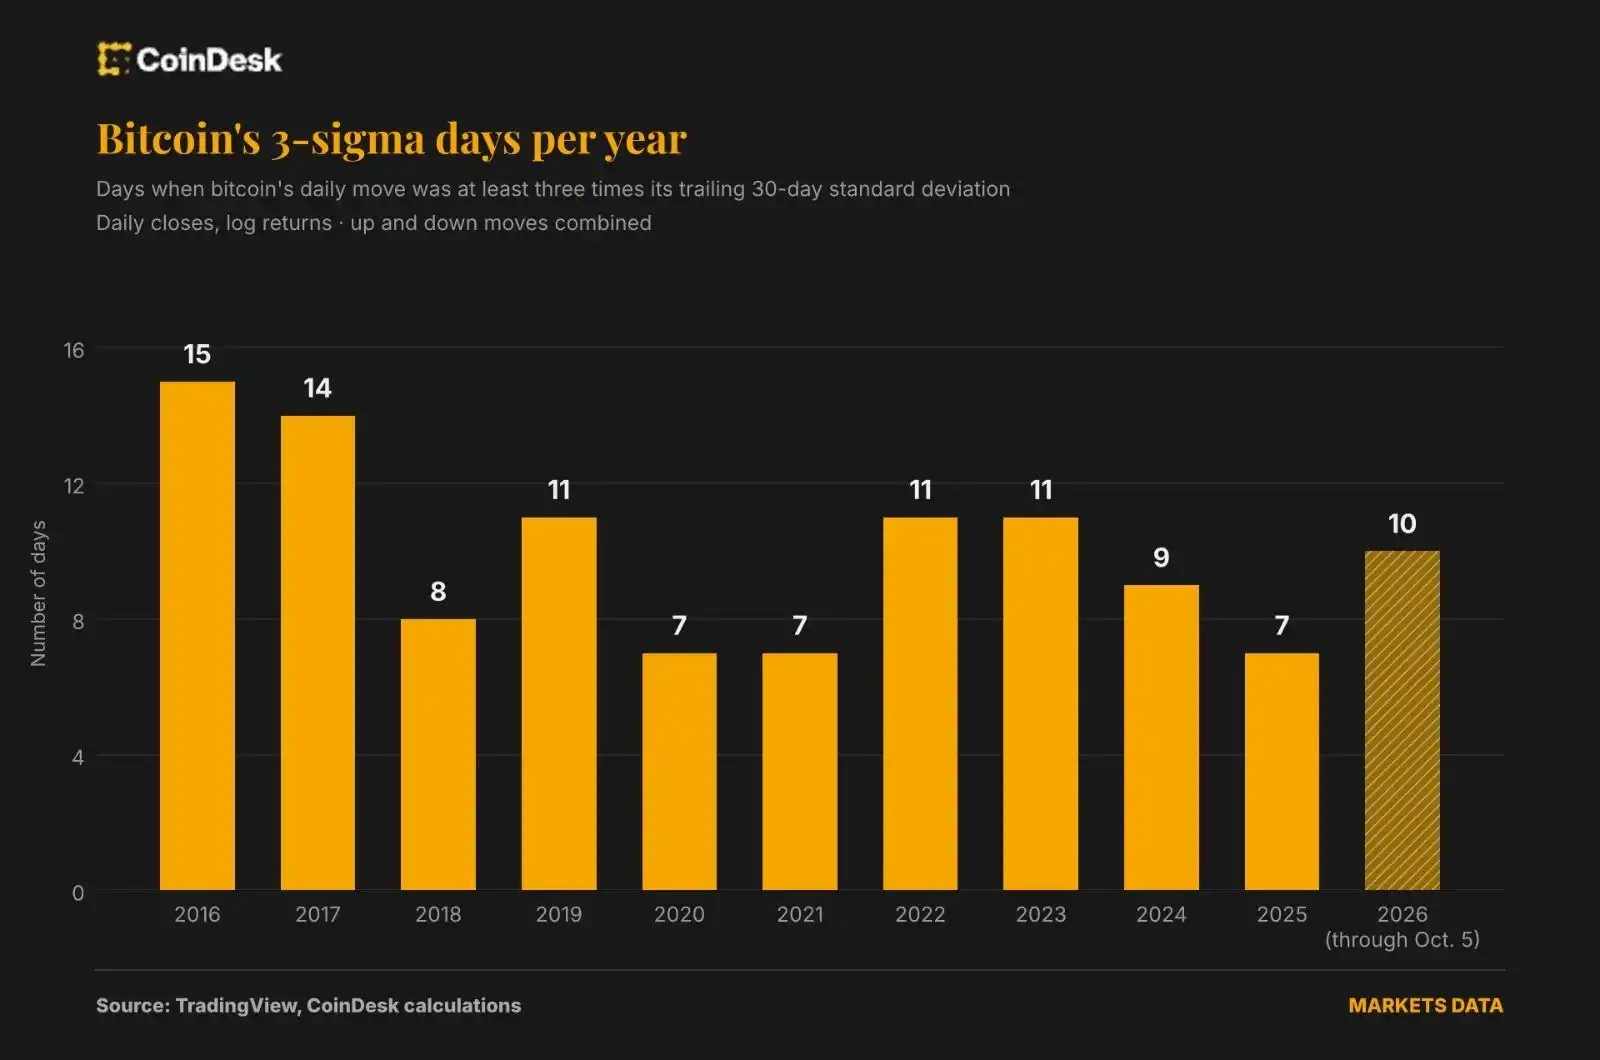
Bitcoin (BTC) has experienced more abnormally large price swings this year than during the 2018 bear market, even as its overall volatility has significantly declined — presenting a challenge for those relying on standard risk models.

According to CoinDesk's analysis, the largest cryptocurrency by market capitalization has recorded 10 trading days in 2026 where its price deviated from its recent trading pattern by at least three standard deviations. This surpasses the 8 such days recorded in all of 2018; a year in which Bitcoin's market value evaporated by 73%.

Traders use 'sigma' to measure these unusually large swings, signifying how far an asset's price has deviated from its normal behavior. To quantify these days, CoinDesk compared each trading day's price change with Bitcoin's 30-day realized volatility — a measure of how much the price typically moved daily over the past month. Any day where the move was at least three times that value (regardless of direction) was counted as a '3-sigma day'.

In a normal bell curve distribution, about 95% of moves fall within 2 sigma, and 99.7% within 3 sigma. Therefore, 3-sigma moves are inherently rare, and traders use them to mark exceptionally sharp swings. A high count suggests that even as overall volatility cools, the asset remains prone to sudden jolts.

These findings indicate that Bitcoin has indeed 'calmed down' over the years but still experiences extreme days, and this year they are occurring more frequently than in 2018. This implies: relative to its recent volatility, Bitcoin is undergoing more abnormally large swings, even though the absolute magnitude of these swings has become smaller. Bitcoin's annualized volatility this year is about 46%, compared to 84% in 2018; meanwhile, the average magnitude of its 3-sigma moves is about 7%, lower than the roughly 10% eight years ago.

"What hasn't changed is that Bitcoin still goes through long quiet periods followed by sudden repricing. The market has matured, with far more institutions, ETFs, and liquidity, so average days are calmer. But the shocks haven't disappeared: macro, leverage, positioning," said Nicolas Quatravaux, Head of Europe, Middle East, and Africa at Paradigm, a leading institutional liquidity network for crypto derivatives.

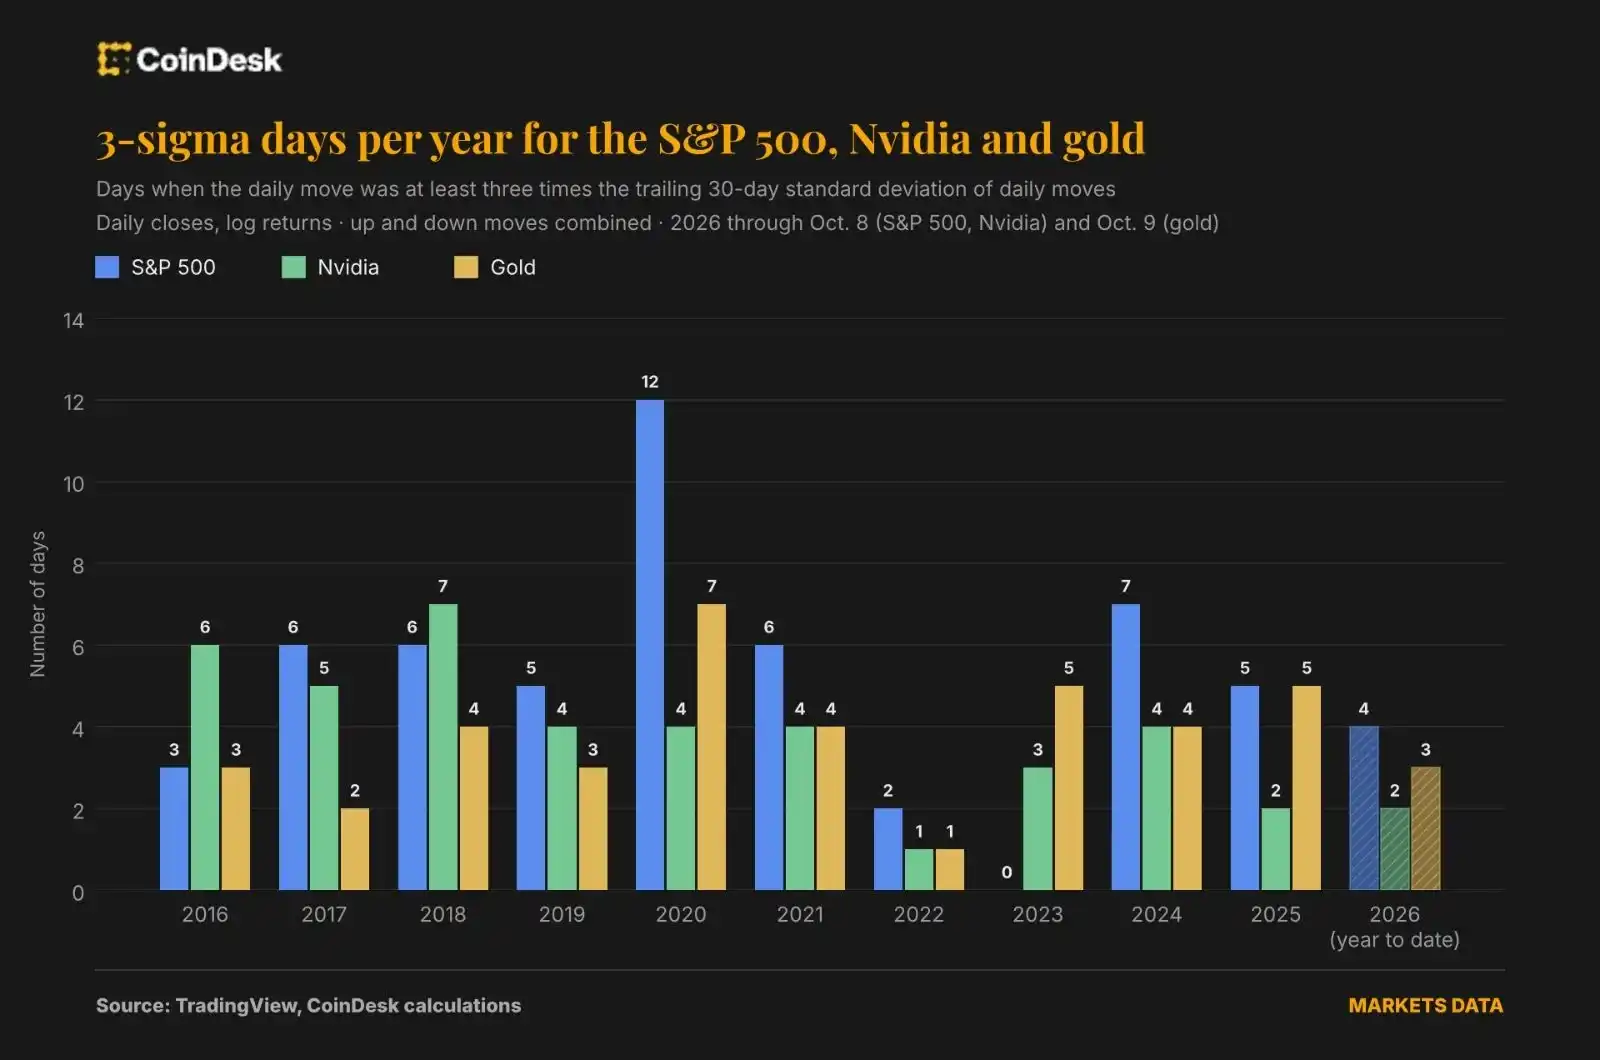
This contrast is evident even compared to other high-volatility assets. Since 2024, Bitcoin's volatility has been roughly comparable to Nvidia's, around 47%. But during the same period, it recorded 26 3-sigma days, while Nvidia had only 8; the S&P 500 had 16, and gold had 12.
How Declining Volatility Misleads Risk Models

The persistence of extreme volatility poses a challenge for investors who use volatility-based risk models to determine their Bitcoin positions.

A widely used metric is value-at-risk (VaR), which estimates how much a portfolio might lose on a bad trading day. Some VaR models heavily rely on recent price fluctuations, meaning an asset can appear less 'dangerous' if trading has been calm for an extended period.

Therefore, the decline in Bitcoin's 30-day, 90-day, and 180-day volatility metrics may encourage investors to increase their exposure. However, depending on how the model is constructed, this apparent decrease in risk may not adequately capture the potential for abnormally large losses.

It also estimates a loss threshold without telling investors how severe losses could be once that threshold is breached. This is known as tail risk — the potential for rare but exceptionally large losses that fall outside an asset's normal trading pattern. Bitcoin's recurring 3-sigma swings show that investors still need to factor in such extreme outcomes, even as day-to-day volatility decreases.

"Standard VaR metrics don't properly assess the full tail risk, which is one of the main reasons the industry is moving towards Expected Shortfall and similar metrics that do account for tail risk," said Luuk Strijers, CEO of crypto options exchange Deribit.

Expected Shortfall looks at how severe losses are on the worst trading days, not just how often such days occur. Unlike using VaR alone, this approach helps investors gauge the destructive power of those extreme losses.

"If the portfolio target doesn't account for tail risk, then a calmer Bitcoin would indeed encourage a larger allocation within the portfolio, making sudden price jumps more impactful for the portfolio," Strijers said.

He added that these 3-sigma risks can be hedged using Bitcoin options.

Why Sudden, Sharp Swings Still Recur

Market participants point to unpredictable macro shocks and highly leveraged options positioning as the dual drivers of these high-VaR trading days.

This year is a good example, said Paradigm's Quatravaux.

"Started slow, with rotation into tech stocks, and a string of DeFi hacks pushing people into selling volatility and structured products for yield. Then you hit Trump, Iran war, the Fed, and everyone is short volatility within a range. One headline is enough to give you an abnormal day," he said.

Essentially, risk builds when traders bet that prices will remain relatively stable. That positioning involves selling (shorting) options — essentially 'insurance' against large price moves — to collect premiums.

Such strategies work when markets are quiet. But when macro headlines hit and prices swing sharply, those sellers get caught on the wrong side, and their scramble to cover can amplify a move into a shock.

Alexander S. Blume, Co-founder and CEO of US SEC-registered investment adviser Two Prime, highlighted a particularly popular variation of this trade called call overwriting. Investors sell call options on Bitcoin they already own, giving up some upside potential in exchange for steady premium income from selling the calls.

"I believe the large increase in derivatives market positioning, despite the convergence in overall volatility, still enables outsized moves to occur relatively frequently. Currently, call overwriting is a highly crowded trade. When we see rallies like the past month, it creates a short squeeze and amplifies moves," Blume said.

A More Resilient Market?

The good news is the market is better equipped to absorb these jolts than before.

On September 21st — the day of Bitcoin's most recent 3-sigma jump — Paradigm facilitated a record $6.7 billion in options volume.

"This time we didn't see, nor hear of, any trading desks taking big losses," Quatravaux said.

"Participants are far more sophisticated than a few years ago, risk management has improved significantly, and there's more institutional money in the market. So a tough month is often just a tough month," he said.

Just don't expect these wild swings to stop.

"They're here to stay. Ten years of data show these days haven't disappeared as the market matured, because macro shocks aren't going anywhere," Quatravaux said.


Related Questions

QAccording to the article, how many '3-sigma' trading days has Bitcoin recorded in 2026 compared to the entire year of 2018?

ABitcoin has recorded 10 '3-sigma' trading days in 2026, exceeding the 8 recorded throughout the entire bear market year of 2018.

QWhat is a key limitation of standard Value-at-Risk (VaR) models highlighted in the article, and what alternative metric is suggested?

AA key limitation of standard VaR models is that they fail to adequately assess the full severity or 'tail risk' of extreme losses. The article suggests the alternative metric of Expected Shortfall, which considers how bad losses can be in the worst-case scenarios.

QWhat two main factors does the article cite as drivers for the continued occurrence of sudden, high-VaR price swings in Bitcoin?

AThe article cites unpredictable macro shocks and highly leveraged options positioning as the two main drivers for the continued occurrence of sudden, high-VaR price swings in Bitcoin.

QWhat specific, popular options trading strategy does Alexander S. Blume mention as contributing to amplified volatility during price rallies?

AAlexander S. Blume mentions the 'covered call' or 'call overwriting' strategy as a highly crowded trade that can create short squeezes and amplify volatility during price rallies like those seen in the past month.

QDespite the persistent extreme volatility, what positive development regarding market resilience does the article point out?

AThe article points out that the market's ability to absorb these shocks has improved. Participants are more mature, risk management has advanced significantly, and there is more institutional capital, meaning a difficult month is often just that, without causing major casualties like in the past.

Related Reads

Conversation with Macro Analyst Jordi Visser: Micron Has 60%-80% Upside, the Longevity Economy Is a High-Confidence Main Theme

Macro analyst Jordi Visser argues that AI is the sole real driver of the economy today, with traditional GDP metrics failing to capture its value—AI-driven productivity shows up in corporate profit margins instead, as large firms grow revenue while hiring freezes. He attributes rising Treasury yields to AI-related capex and debt issuance, not Fed policy, and views credit default swap widening as a concentration-risk hedging issue rather than an AI bubble. He expects hyperscaler external financing to peak as data centers come online and free cash flow turns positive (citing Oracle's guidance). On labor, he sees Microsoft's buyout of 27% of its workforce as a template: AI-driven revenue-per-employee surges will push governments toward redistributing profits from capital to labor via tax restructuring, since personal income tax bases erode. He warns the market is discounting risks like labor turmoil, political gridlock, memory/data center bottlenecks, and cybersecurity. His key themes are agentic compute and the longevity economy. He is bullish on Eli Lilly as the purest longevity play, predicting it will become the S&P 500's largest company by 2030, and on Micron, which he re-entered around $800 with only ~10% downside and 60-80% upside, citing humanoid robot RAM demand, SpaceX's 10GW compute plan, and long-term supply agreements through 2030. He also holds crypto as his largest allocation, expecting 2027 to mark a breakout year for blockchain commercial applications and payment networks.

marsbit1h ago

Conversation with Macro Analyst Jordi Visser: Micron Has 60%-80% Upside, the Longevity Economy Is a High-Confidence Main Theme

marsbit1h ago

Michael Saylor: Four Centuries of Digital Credit Evolution

Michael Saylor traces the four-century evolution of digital credit, showing how centuries of financial infrastructure paved the way for Bitcoin-based corporate treasuries. The story begins in 1602 with the Dutch East India Company, which separated a company's capital duration from investors' holding periods through transferable shares. Preferred stock followed, exemplified by the Baltimore and Ohio Railroad's 6% perpetual preferred dividend in 1836 and Delaware's 1899 recognition of distinct share classes. Exchanges and tickers—from the 1792 Buttonwood Agreement to the 1867 stock ticker and 1971 Nasdaq—gave ownership a public market. U.S. securities and commodities law (1922–1974) established the distinction between assets a company holds and securities it issues. The 1940 Investment Company Act's "40% test" still shapes how bitcoin treasury companies use common stock, preferred stock, and debt. Tax law dating to 1921–1954 distinguishes return of capital from income, allowing preferred dividends to reduce cost basis before gains are realized. Shelf registration (Rule 415, 1982–1983) and at-the-market programs (1982, 2005) let companies prepare financing in advance and raise capital at market prices. Buybacks, recognized since 1828 with the 1982 Rule 10b-18 safe harbor, let firms manage capital in both directions. Bitcoin, launched in 2008–2009 and classified as a commodity by the CFTC in 2015, provides a new reserve asset, while companies supply capital structure, dollar liquidity, and distribution policy. Digital credit thus combines over 400 years of corporate ownership transfer, roughly 190 years of U.S. preferred stock, more than a century of tax cost-recovery rules, and four decades of modern shelf and ATM regulation into a familiar framework for investors.

marsbit2h ago

Michael Saylor: Four Centuries of Digital Credit Evolution

marsbit2h ago

The Hidden Risks Behind Anthropic's Nearly $1 Trillion Bet

Anthropic's IPO filing reveals a fragile, high-risk financing mechanism behind its AI ambitions. The company has committed to up to $895.4 billion in data center spending through 2045, with profits squeezed by rising compute costs. Rather than paying upfront for hardware, Anthropic relies on supplier-backed financing: Broadcom arranged a $63 billion equipment financing deal under which it absorbs losses if Anthropic defaults—up to roughly $43 billion once equipment is delivered. Google and AMD similarly tie funding to hardware leases or deployments. This shifts risk onto chipmakers' balance sheets, and because custom TPUs serve a narrower ecosystem than Nvidia GPUs, resale risk is higher. Analysts warn that while individual loans appear safer, risk concentration across the system is rising and harder to assess. Anthropic also can issue up to $42 billion in convertible notes to Broadcom to cover rent, with interest rates rising from 9% to 13% and conversion terms worsening if revenue targets are missed. Despite holding $146.6 billion in liquidity as of September 30, its massive forward obligations and tangled partnerships could limit access to investment-grade financing. Key concerns: whether revenue growth can outrun compute costs and cover future commitments, and whether drawing on credit lines signals distress. Anthropic's Direct initiative—separating data center leasing from chip purchases—and IPO proceeds could give it more flexibility, but ultimately debt repayment depends on end-customer revenue.

marsbit13h ago

The Hidden Risks Behind Anthropic's Nearly $1 Trillion Bet

marsbit13h ago

Trading

Spot
活动图片