Executive Summary
- Bitcoin has evolved into a global asset with extremely deep liquidity that is available at all hours of the day. This creates the conditions for investors to speculate, trade, and express their macro-economic views at times when traditional markets are closed.
- Bitcoin continues to prove itself as an emerging store of value asset, accruing over $850B in net capital inflows. It also serves a role as a medium of exchange asset, processing nearly $9B in economic volume per day.
- Multiple metrics for new demand remain elevated, however they are substantially lower than was experienced during the heights of previous cycles.
- The composition of investors in digital assets is also changing, with a notable rise in more sophisticated institutional investors within the Bitcoin space. This has led to a general decline in the magnitude of drawdowns and a compression of volatility over time.
Proving Ground
Since Bitcoin’s inception in 2009, it has grown into a global asset with extremely deep liquidity, and remains actively traded at all hours of the day. Given global events often occur outside of traditional market trading hours, this makes Bitcoin of of the few assets where investors can express a view over weekends for example.
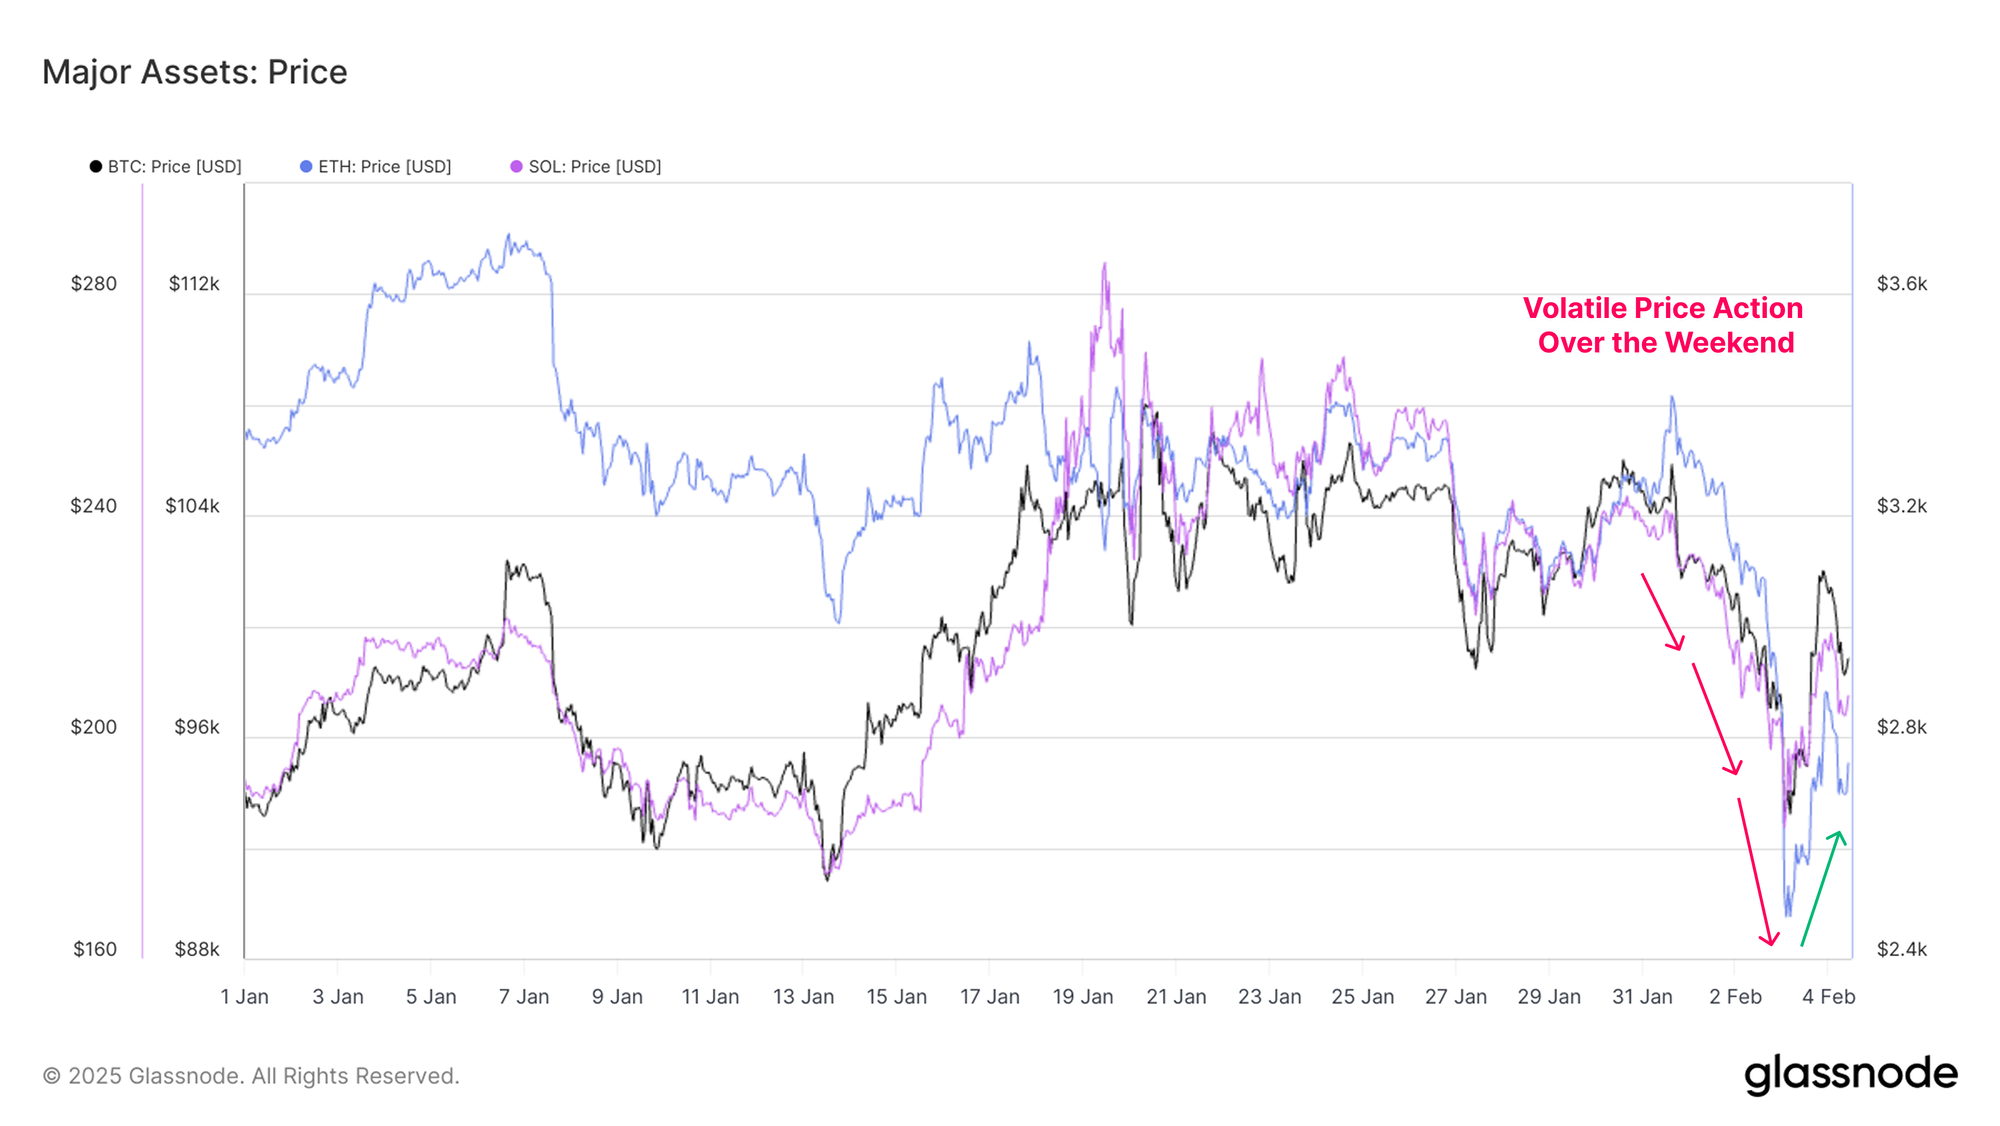
Over the weekend, Bitcoin experienced a sharp decline as market participants responded to the Trump administration's implementation of tariffs on Mexico, Canada, and China. Given other markets were closed, Bitcoin and other digital assets saw a sharp decline and then a recovery:
- BTC traded from $104k down to $93k (-10.5%) before recovering to $102k.
- ETH traded from $3.4k down to $2.5k (-26.5%) before recovering to $2.8k.
- SOL traded from $236 down to $184 (-22.0%) before recovering to $217.
Bitcoin in particular now has increasingly role on the world stage, with nation-states such as the Kingdom of Bhutan running large-scale Mining operations, El Salvador promoting the currency to legal tender, and the United States Government considering the potential of Bitcoin as a strategic reserve asset.
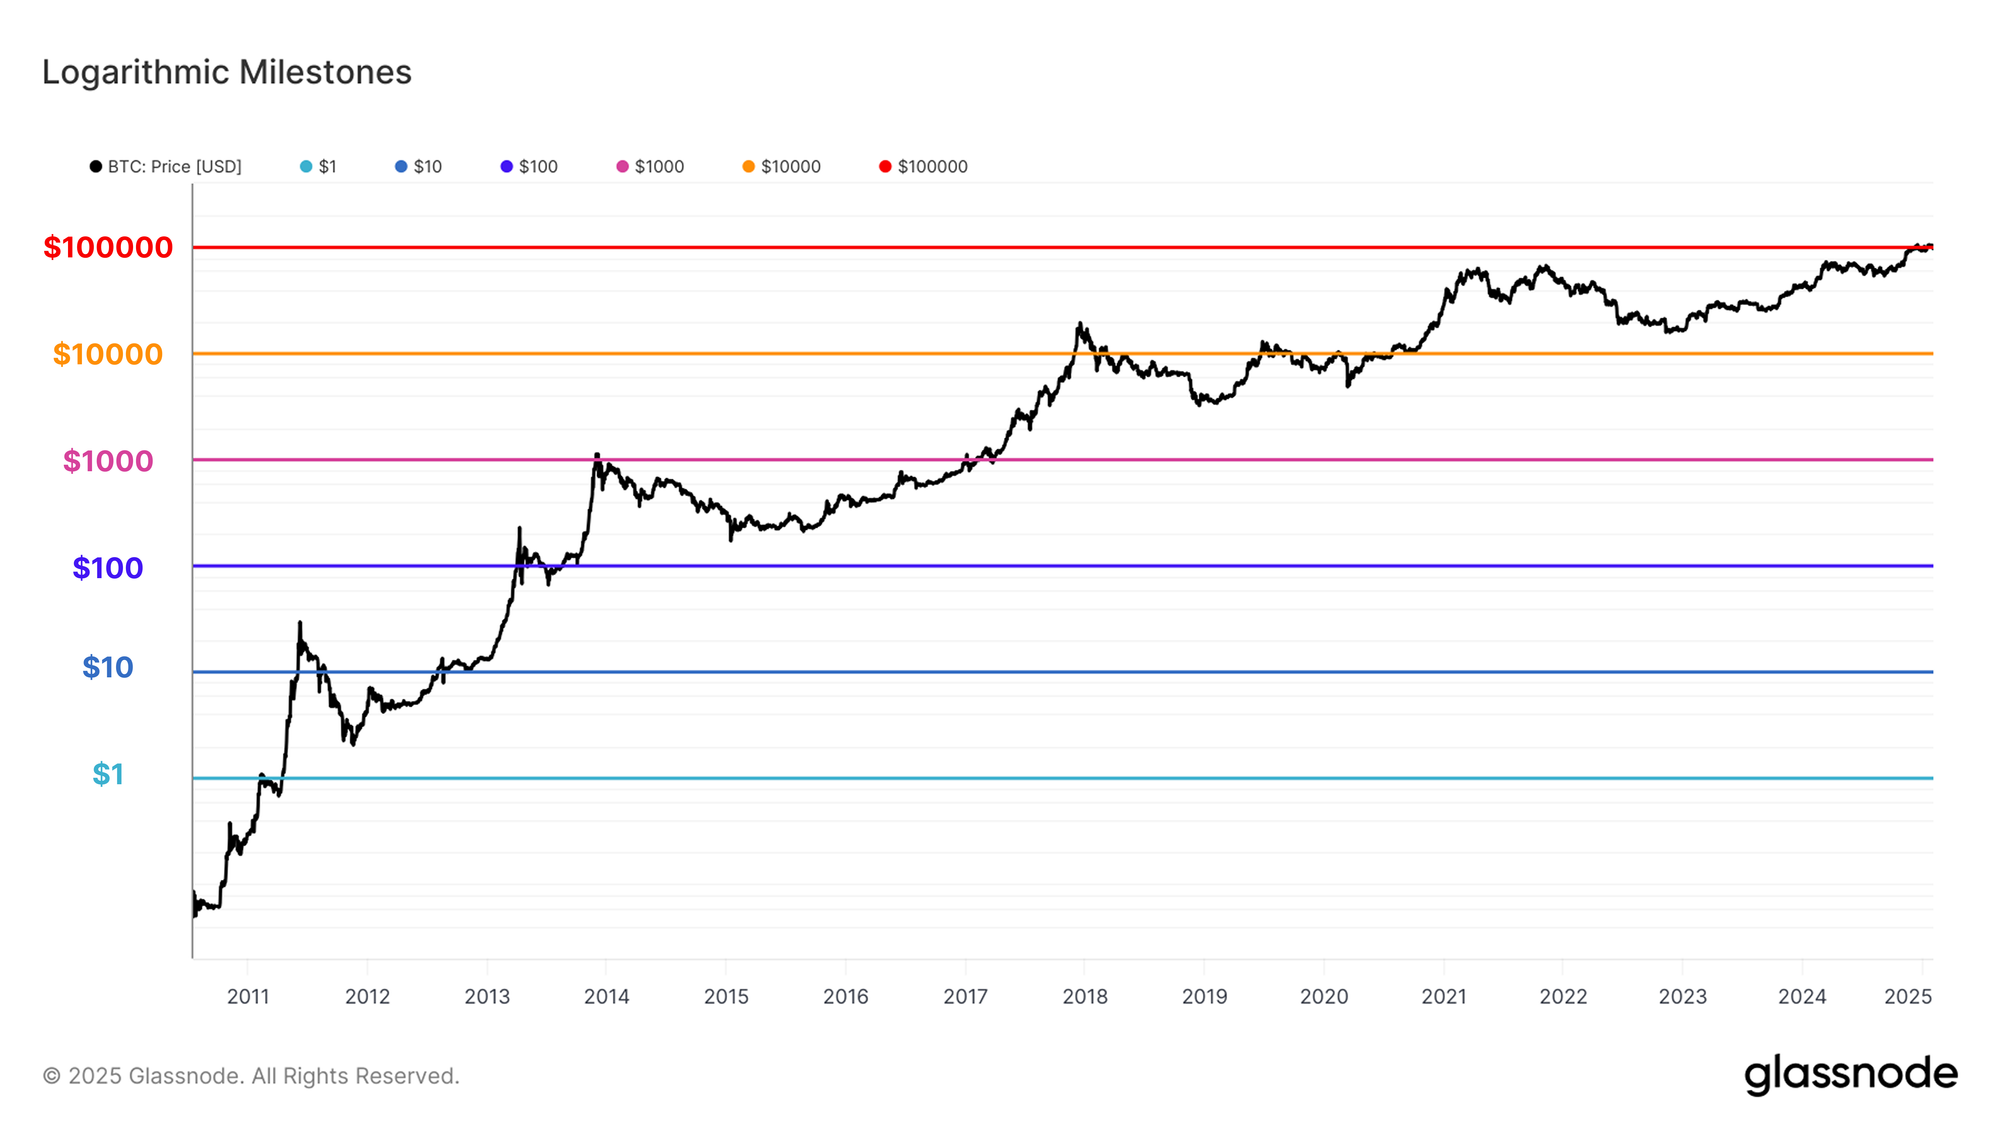
Bitcoin has now traded above the psychologically important $100k level for several weeks now, a feat many critics deemed impossible. This was achieved 7 years on from its last logarithmic milestone of $10k, achieved during the 2017 bull run.
Whilst Bitcoin’s acceptance is growing amongst traditional investors, it still remains a contentious and polarising topic for many, often based on questionable claims regarding a lack of intrinsic value or utility.
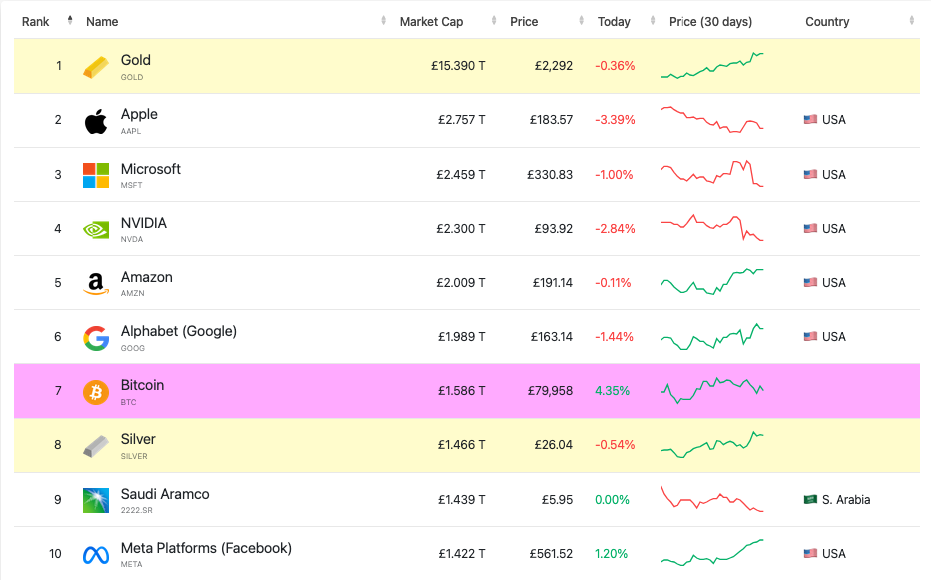
Nevertheless, Bitcoin has cemented its position as one of the largest assets in the world, sporting a market capitalization of $2T, and ranking as the 7th largest asset worldwide. Notably, this positions Bitcoin above Silver ($1.8T), Saudi Aramco ($1.8T) and Meta ($1.7T), making it increasingly difficult to ignore.
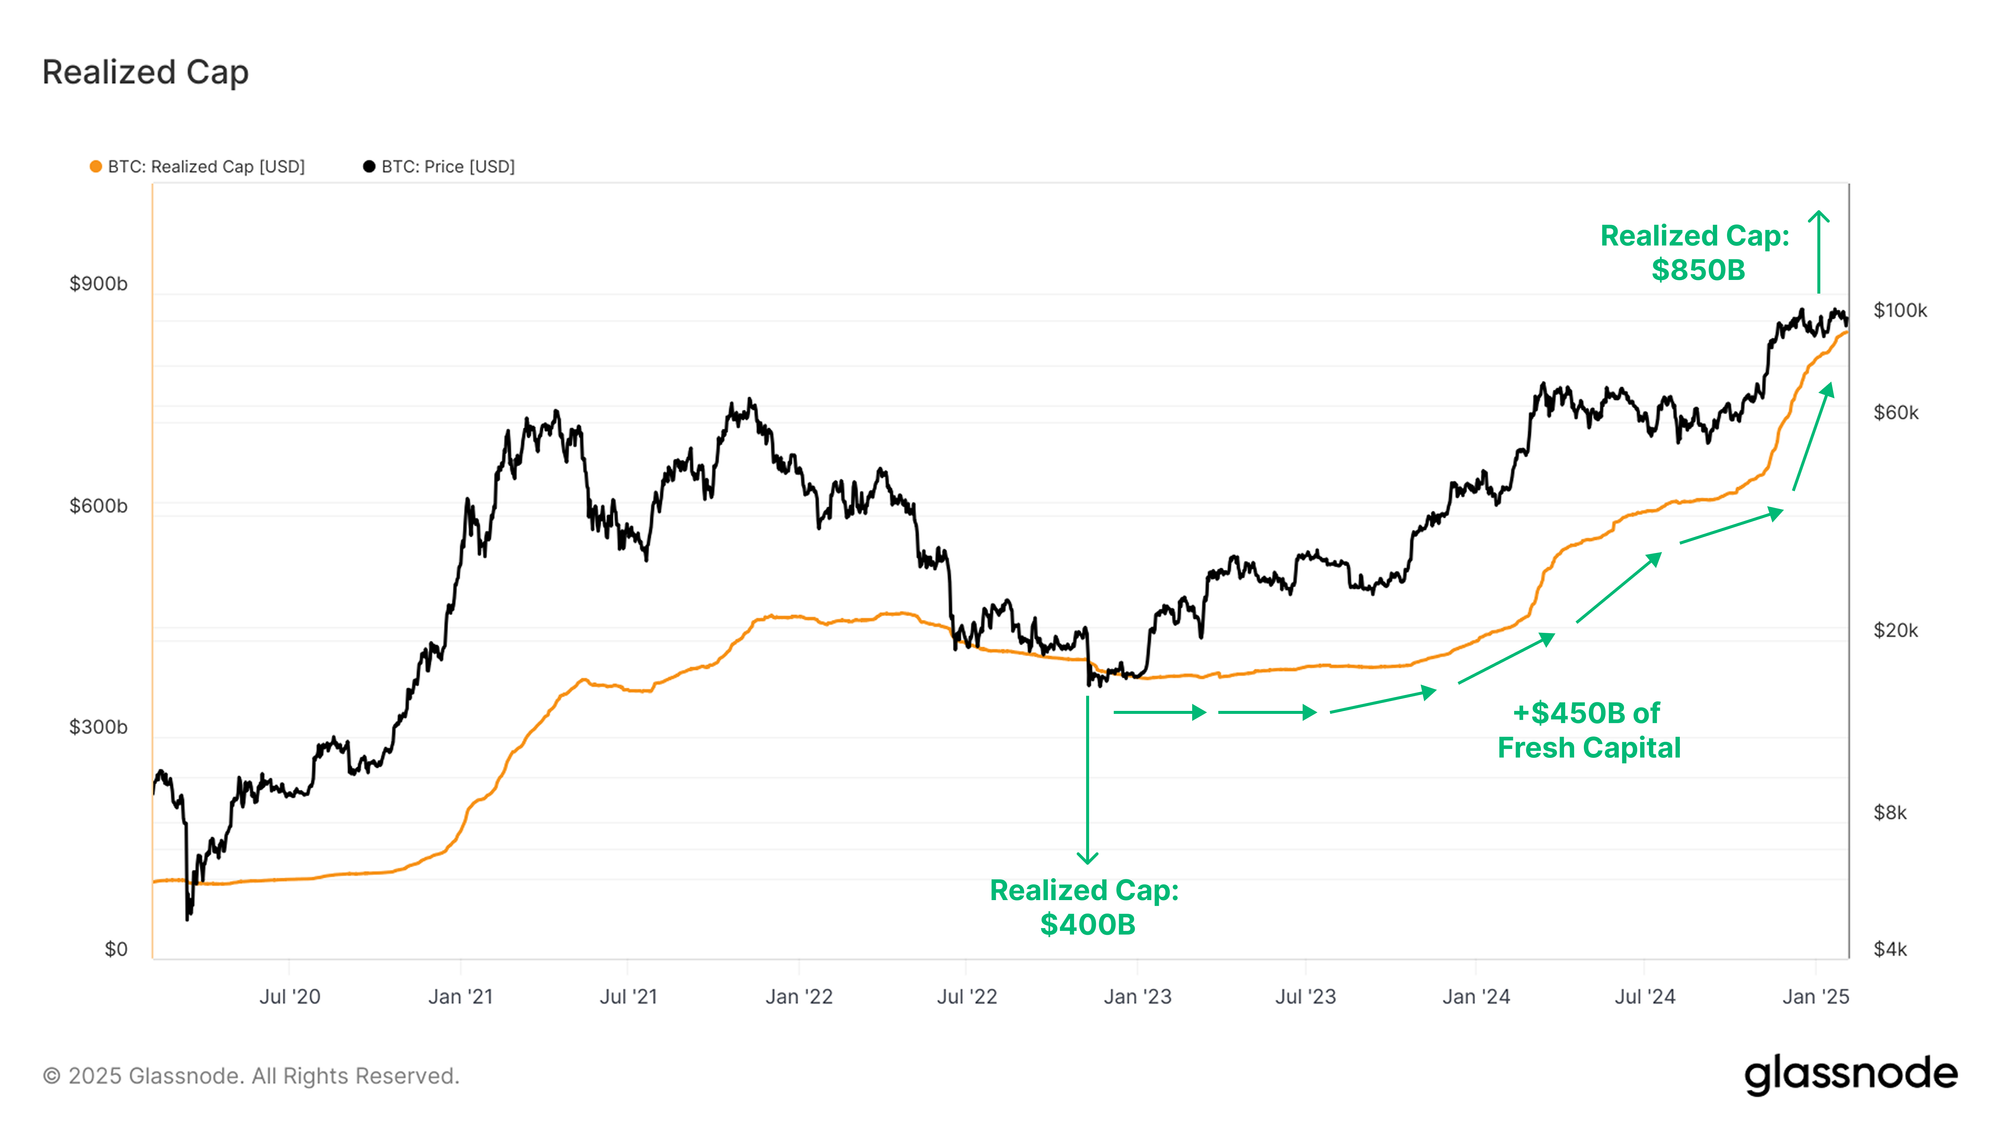
As the valuation and weight of an asset reaches these large scales, its inertia rises in tandem. The knock on effect is that Bitcoin now requires significantly larger inflows of fresh capital to achieve continued growth in its market cap. To explore this idea, we can utilize the Realized Cap metric which measures the cumulative netflow of capital into a digital asset.
If we benchmark from the cycle low set in Nov 2022, when the Realised Cap was $400B, Bitcoin has since absorbed an additional capital inflow of just approximately +$450B, more than doubling the Realized Cap.
This reflects the aggregate “value stored” in Bitcoin at around $850B, with each coin priced at the time it last transacted on-chain.
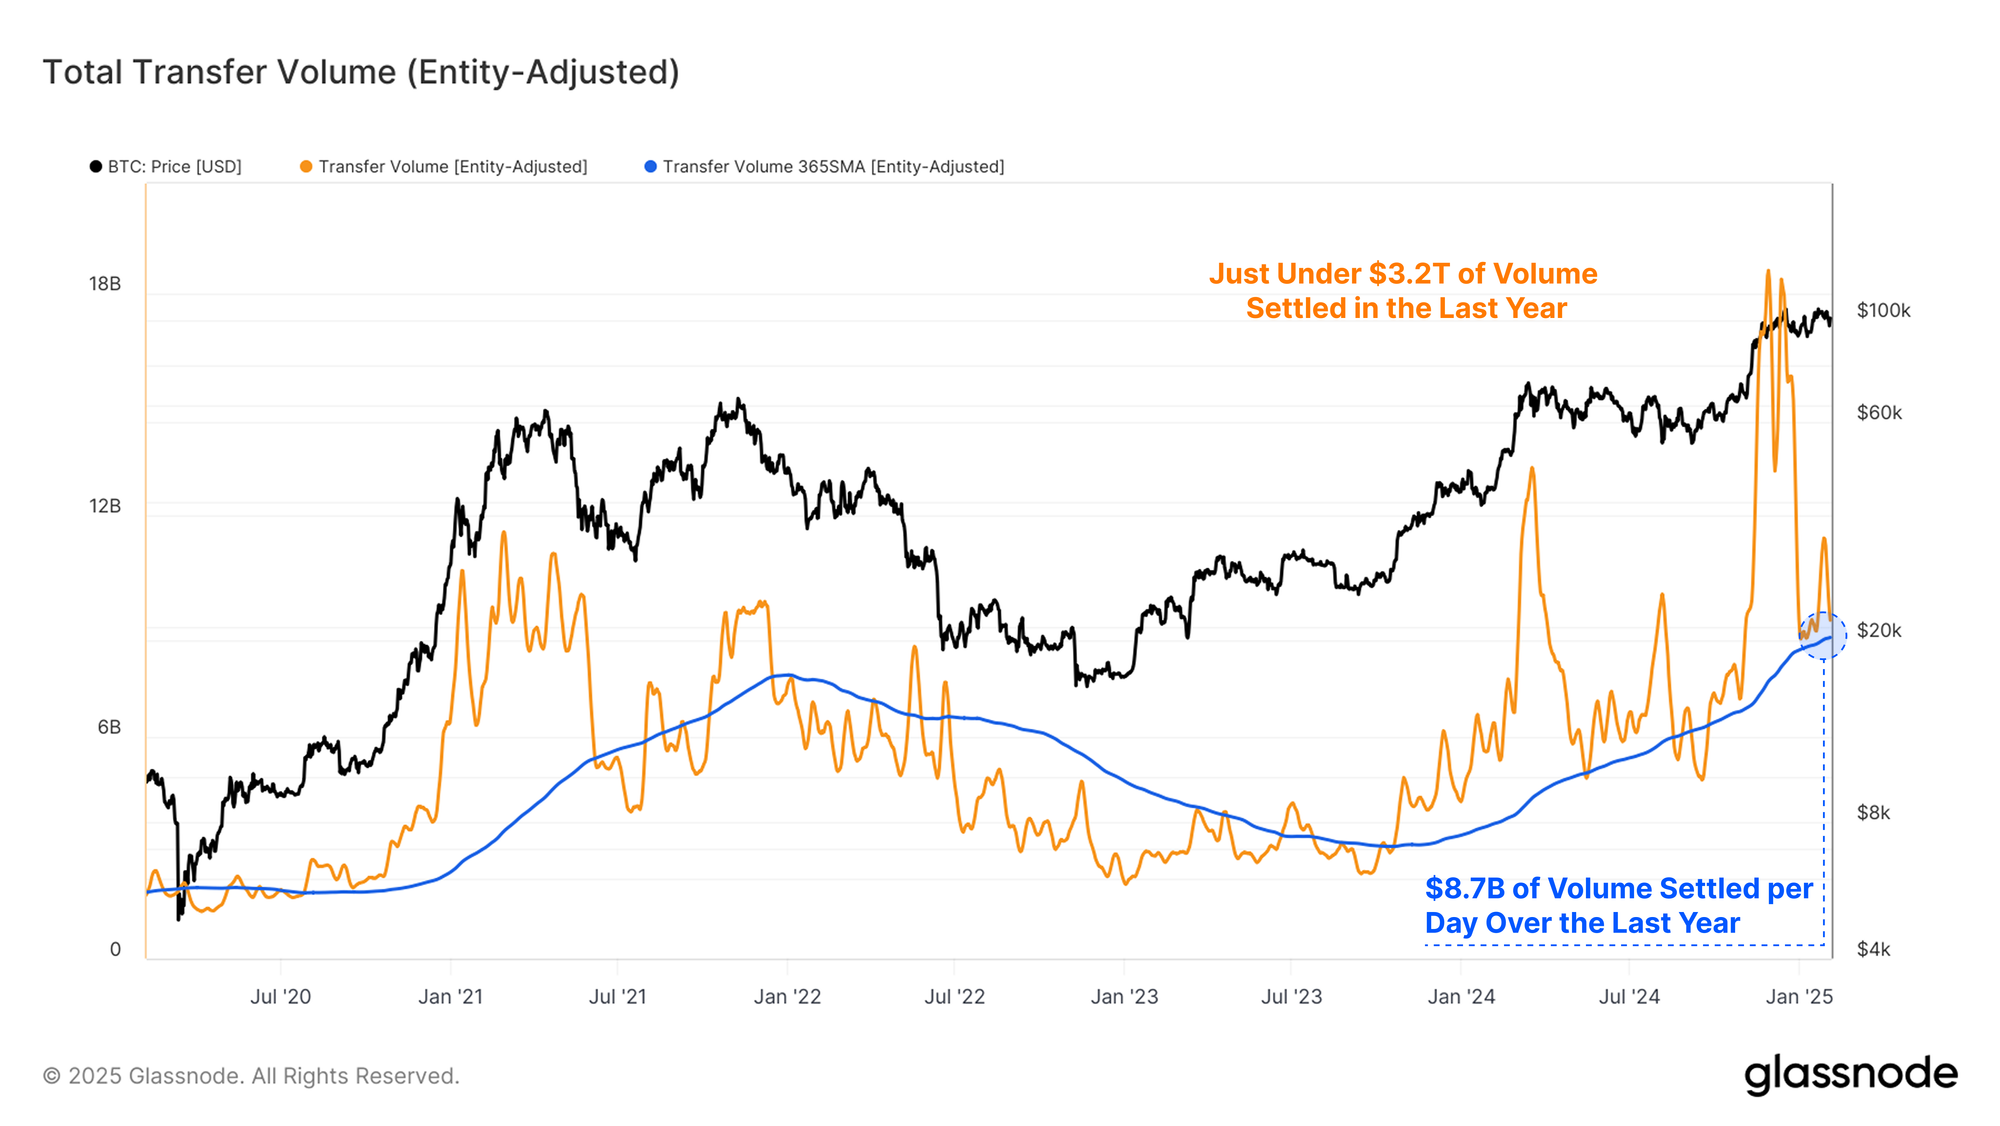
Whilst BTC is often viewed primarily as an emerging store of value asset, the Bitcoin network is also able to operate as decentralized rails for BTC as a medium of exchange. The combination of nodes and miners allow for any individual or entity to settle payments across borders, without the interaction of a third-party intermediary.
When utilizing Glassnode’s entity-adjustment heuristic to filter for only economical transactions, over the last 365 days, the Bitcoin network has processed an average of $8.7B per day, with total value transferred over the last year reaching $3.2T.
Both the Realized Cap, and the economic volumes settled by the Bitcoin network offer ewmpirical evidence that Bitcoin both has ‘value’ and ‘utility’, challenging the assumption by critics that it has neither.
Relative Dominance
After establishing Bitcoin’s growing relevance as a macro asset, we can shift our focus internally, and analyze its dominance relative to the wider Digital Asset ecosystem.
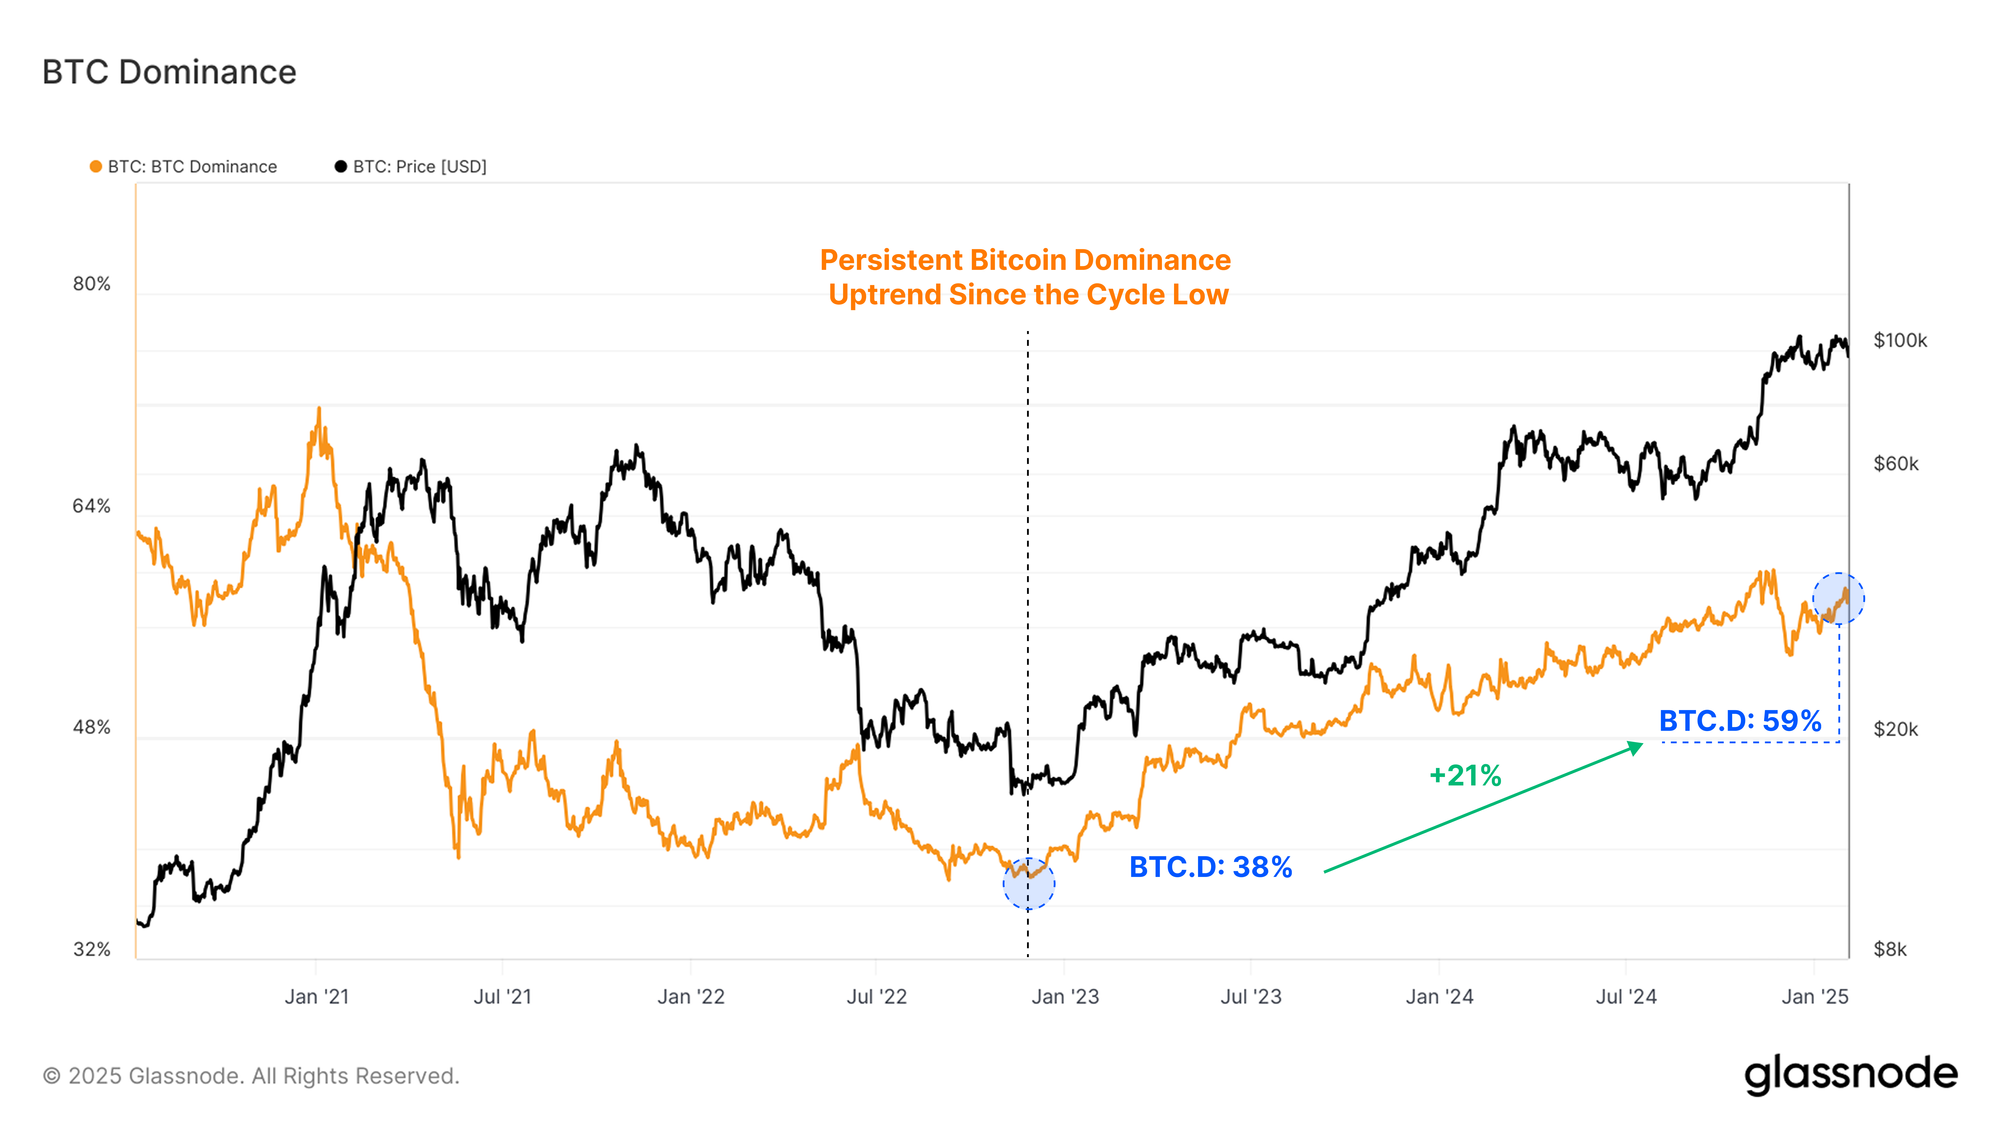
Since the collapse of FTX in Nov 2022, Bitcoin Dominance has been in a persistent uptrend, rising from 38% to 59%. This suggests that there has been a net rotation and value accrual towards Bitcoin preferentially over others in the digital asset landscape.
This may be in part explained by the wider access that the US spot ETFs offer for institutional capital. Bitcoin also has a somewhat clearer core narrative as a scarce asset, held by many as a monetary hedge against the debasement of fiat currencies globally.
When we compare the Market Cap of Bitcoin and various altcoins (excluding Ethereum and Stablecoins), we can see a growing divergence in valuation is underway. Anchoring ourselves to the 2022 low once more, we can compare the growth in Market Caps.
- Bitcoin Market Cap: $363B > $1.93T (5.3x)
- Altcoin Market Cap: $190B > $892B (4.7x)
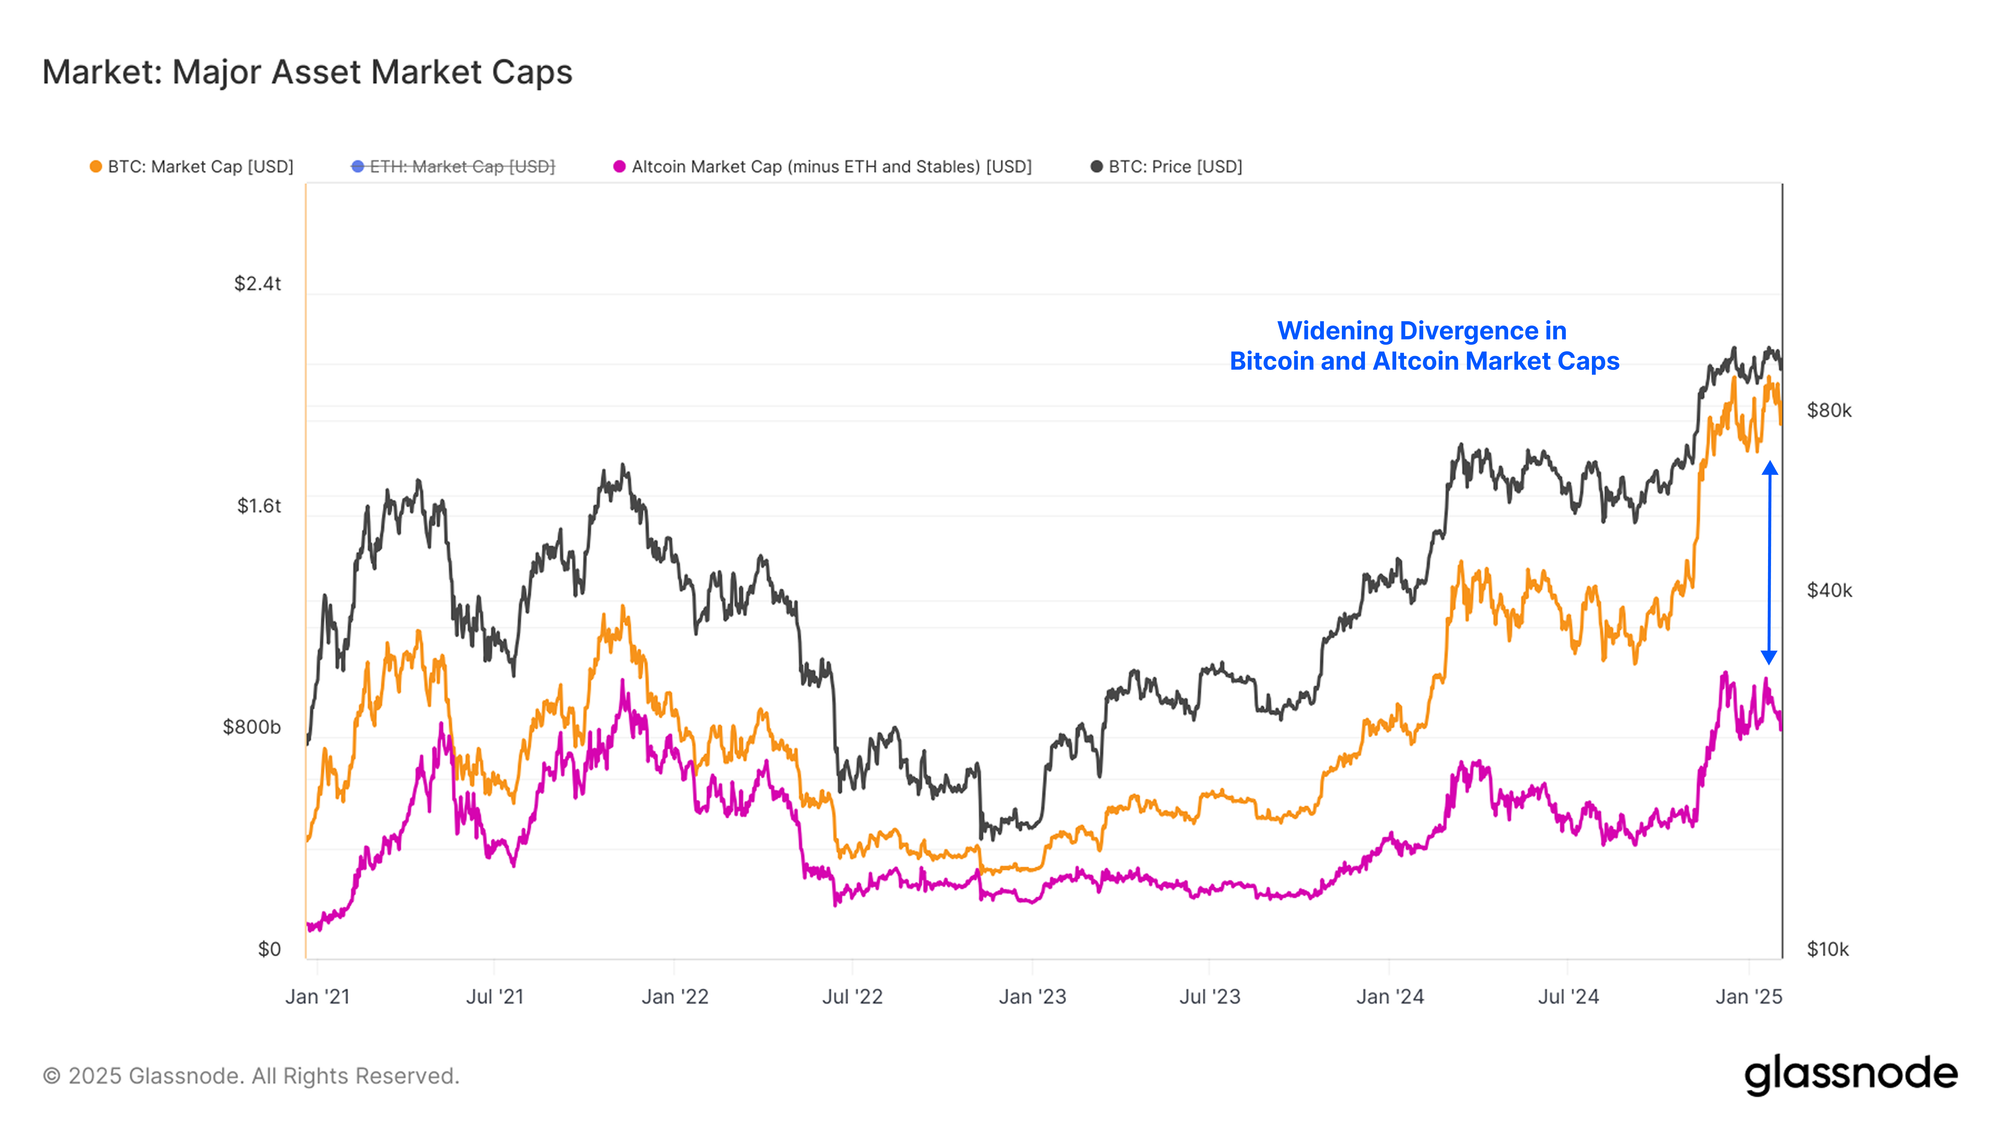
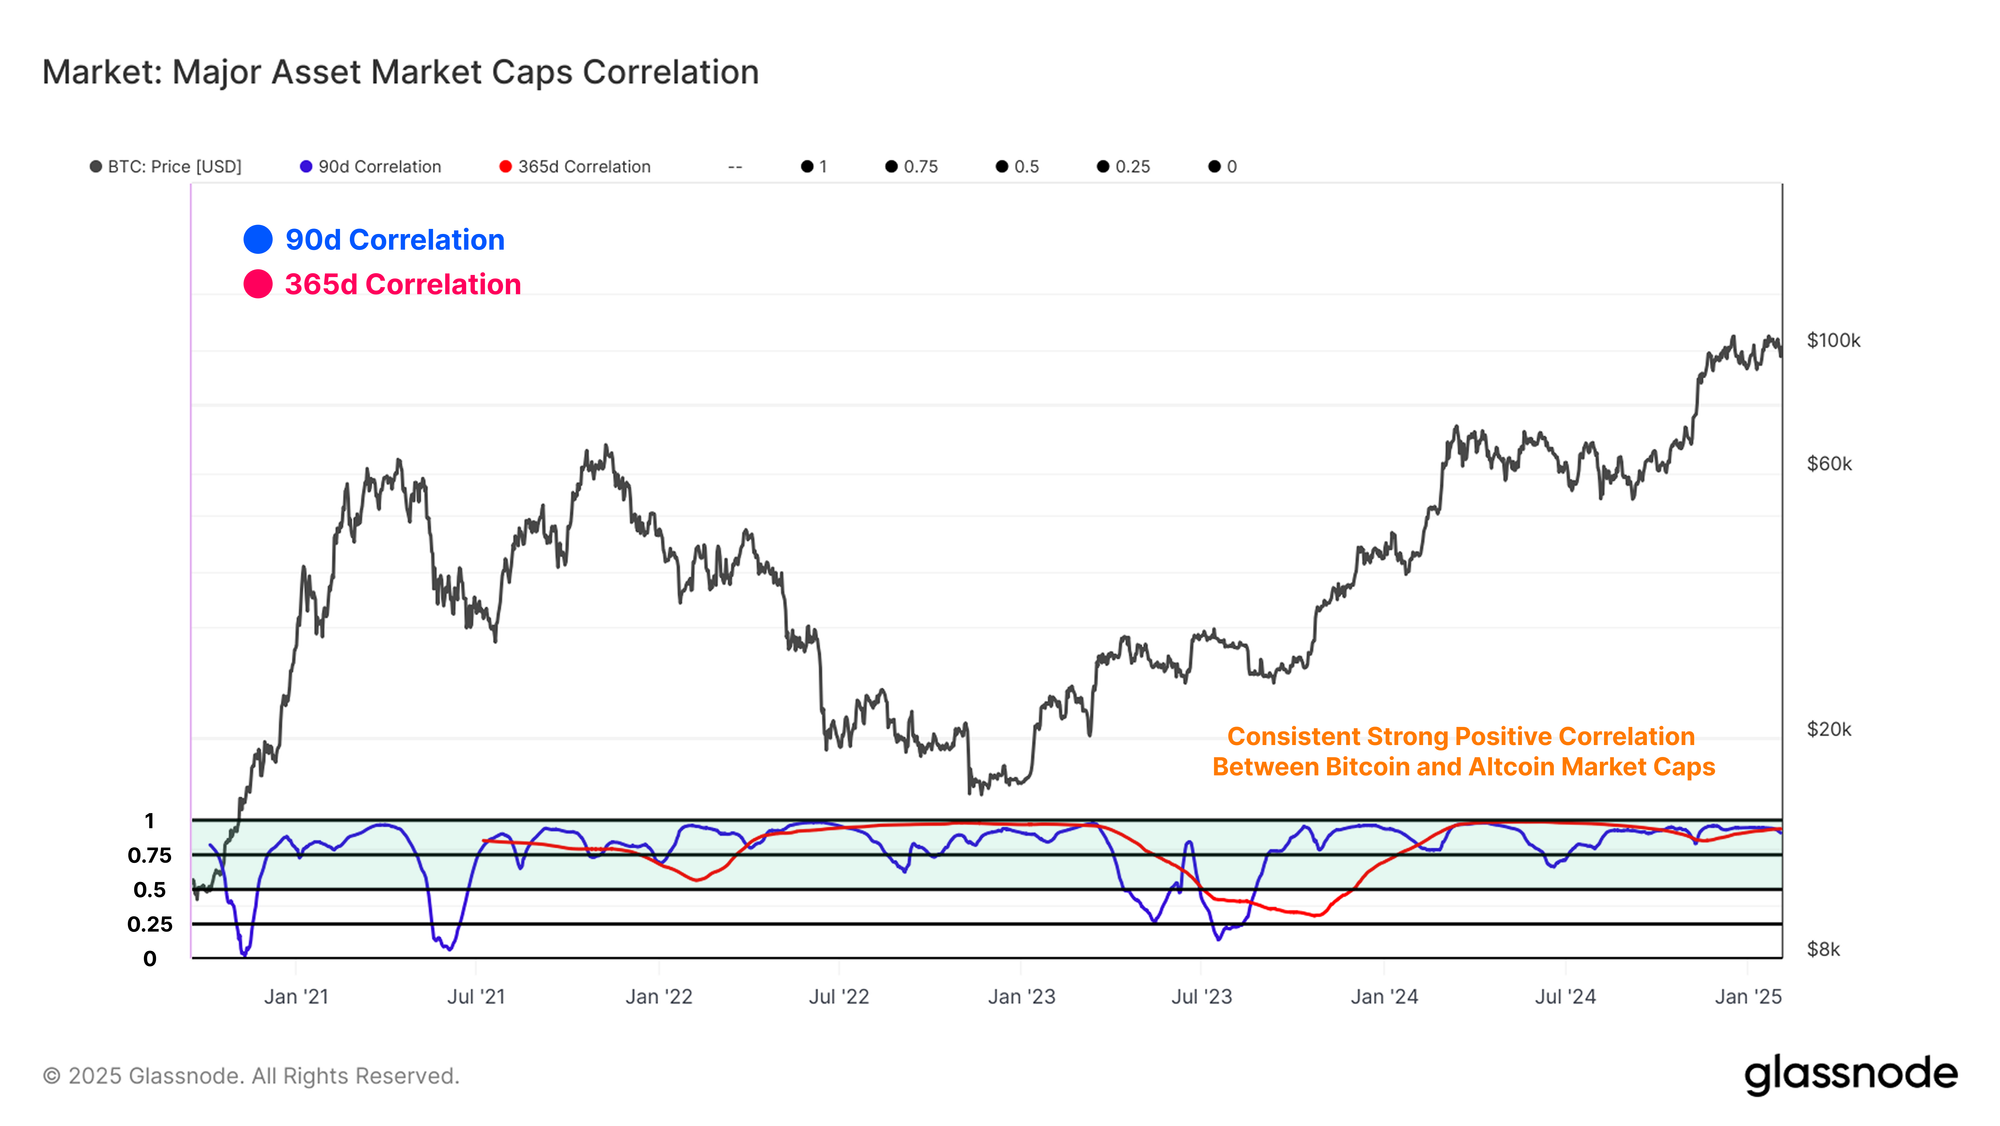
Whilst there is a divergence in size of Bitcoin and altcoin valuations, the correlation between the two remains robust. This suggests that the driver for this divergence is not the rate of growth between the two, but instead a substantial difference in capital entering Bitcoin relative to the Altcoin sector.
Whilst Bitcoin continues to garner the lions share of the capital from investors, it would be expected that Bitcoin dominance would continue to climb (with a reversal in that metric being a signal for capital rotation in the other direction).
Where is New Demand?
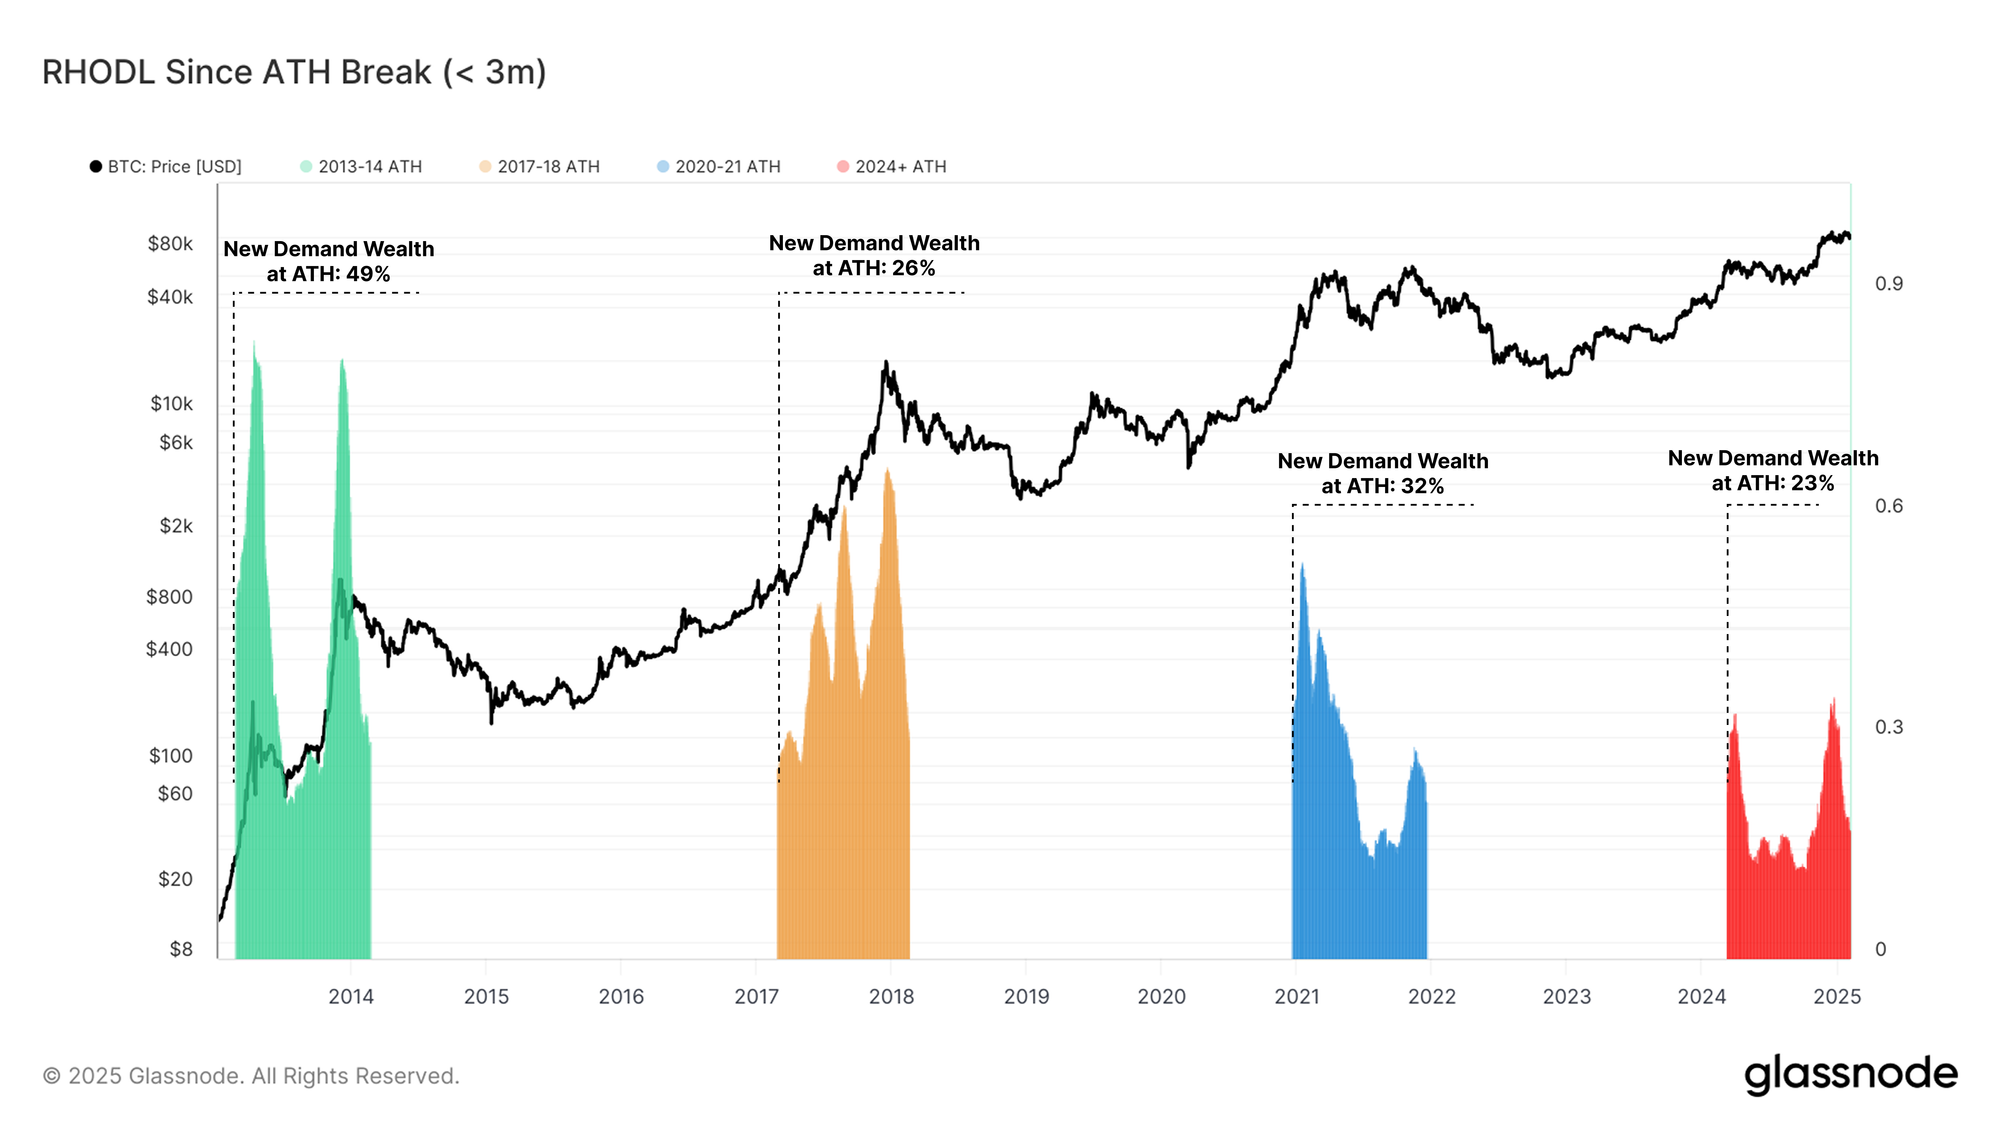
With BTC prices breaking the $100k mark, one would expect the magnitude for Bitcoin exposure to be significantly heightened. We can evaluate this by assessing the percentage of network wealth which is held by coins acquired less than 3 months ago. The chart below plots how this metric has evolved over the 12 months after breaking to a new cyclical ATH.
Whilst new demand this cycle is meaningful, the wealth held in 3month old coins is much lower than it was compared to previous cycles. This suggests that there has not been the same magnitude of new demand inflows, seeming to occur in bursts and peaks, rather than on a sustained basis.
Interestingly, all previous cycles had concluded approximately one year after the first ATH break, which highlights the atypical nature of our current cycle, which first reached a new ATH in March 2024.
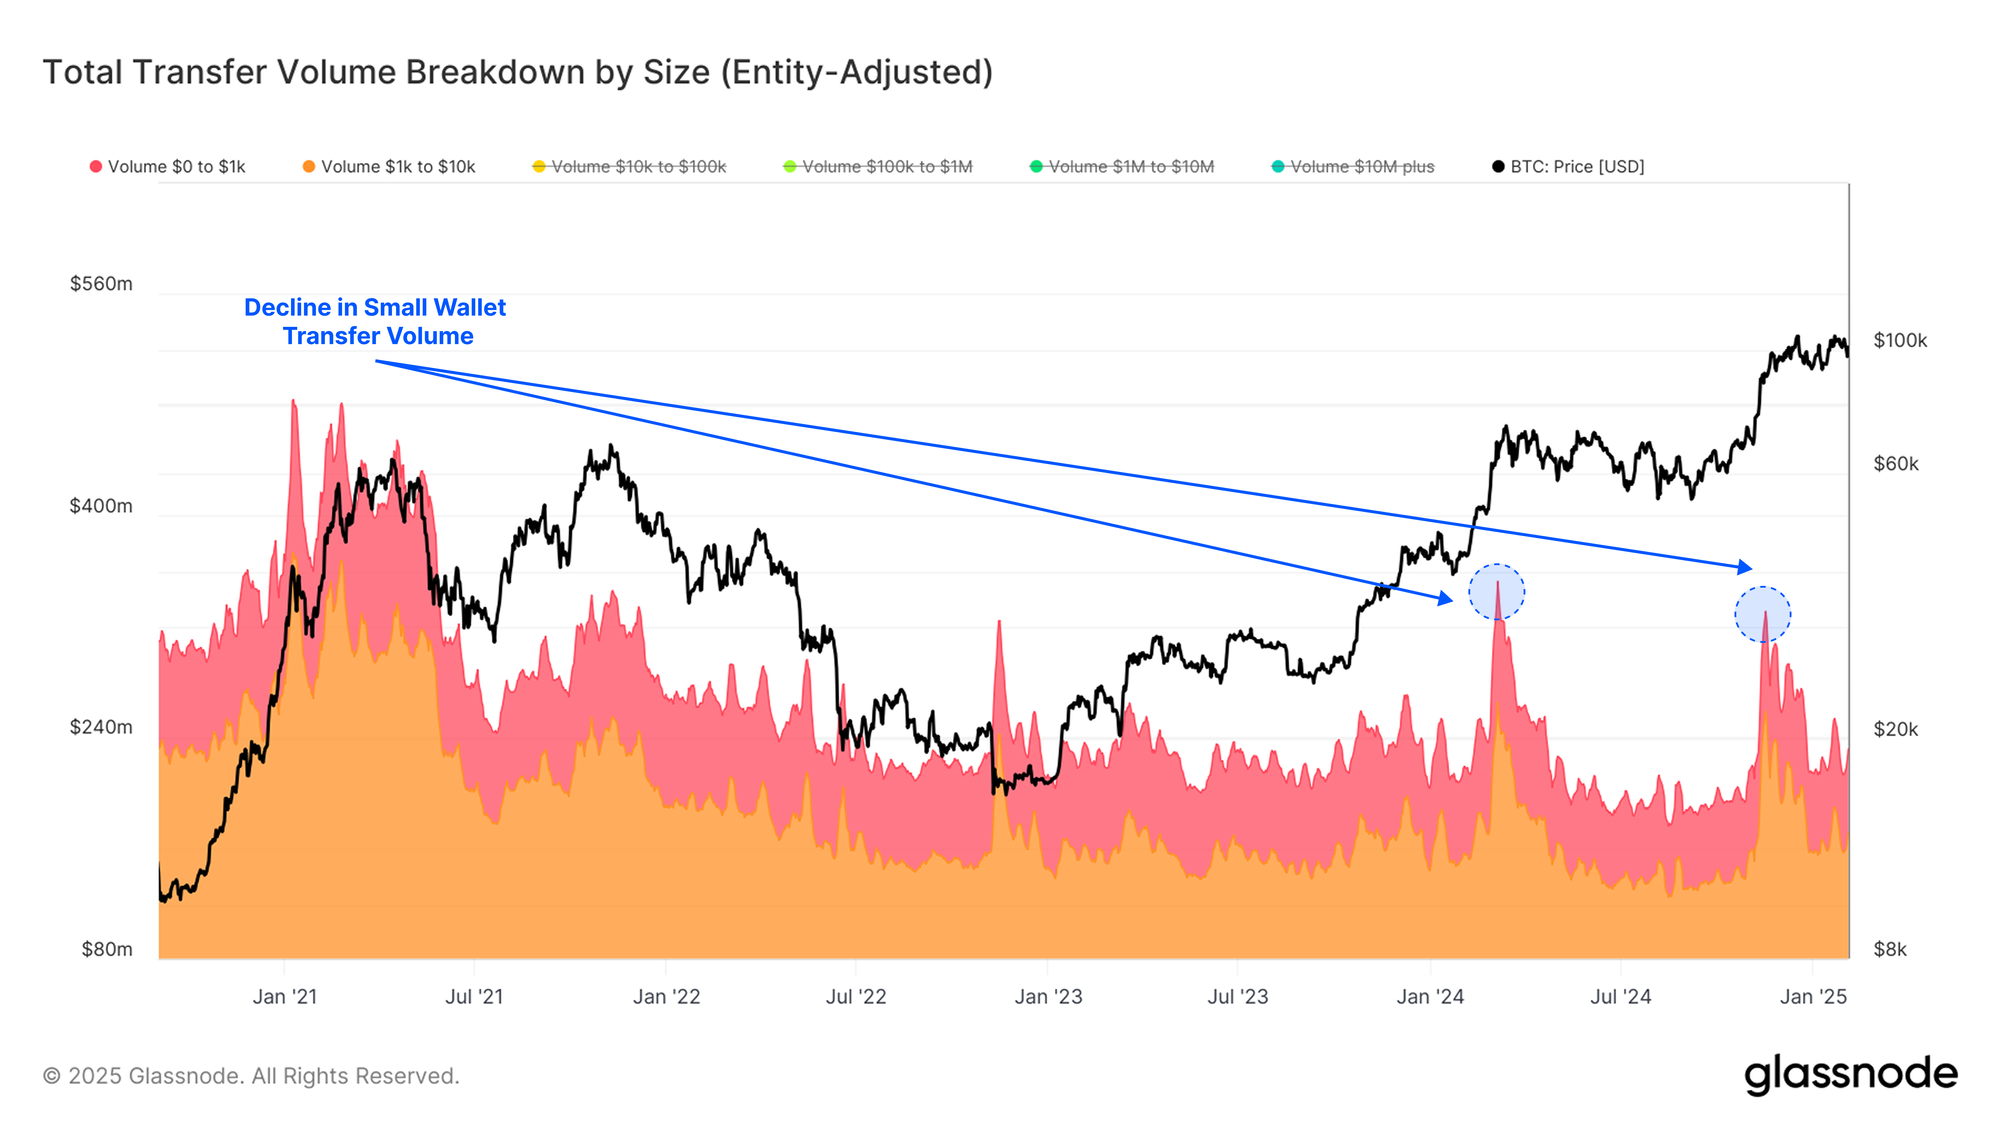
If we isolate the transfer volume from small wallets (with less than $10k), we can see a notable decline when compared to the 2021 ATH. This comes despite the significant increase in overall volume settled this cycle, and significantly higher Bitcoin prices.
This suggests that new demand for BTC has been dominated by larger sized entities, rather than small retail sized entities.
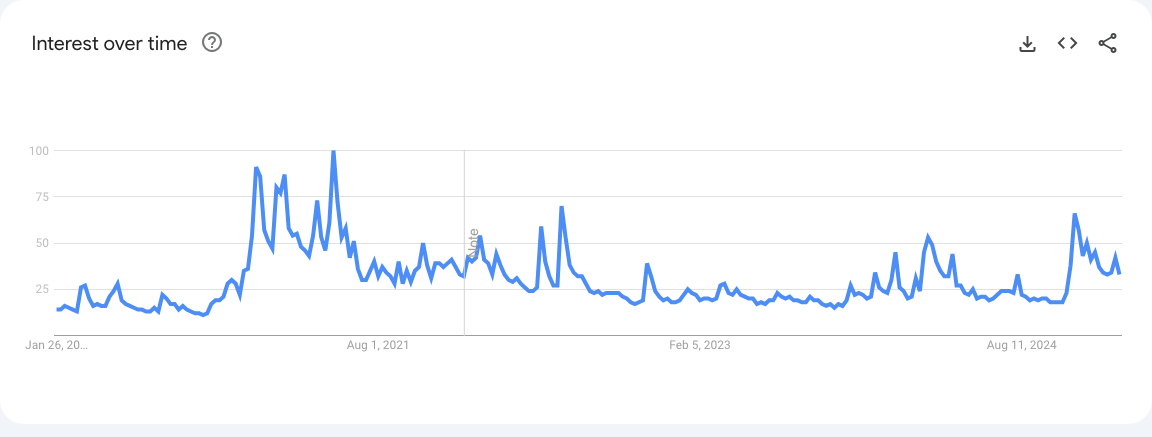
We can also utilize alternative datasets such as the Google Analytics search interest over time to support our thesis. Search intensity has not reached the previous euphoria levels witnessed during the 2021 bull run, despite a multitude of tailwinds for the asset.
An Evolving Investor Base
Whilst the Bitcoin protocol is largely fixed in its structure and consensus code, the market response to it is an ever-evolving and dynamic process. The regulatory environment is in constant flux, and new financial instruments such as derivatives and the ETF products continue to develop around it. As the environment around Bitcoin evolves, so too does the composition of Bitcoin investors, which is most notable during this cycle.
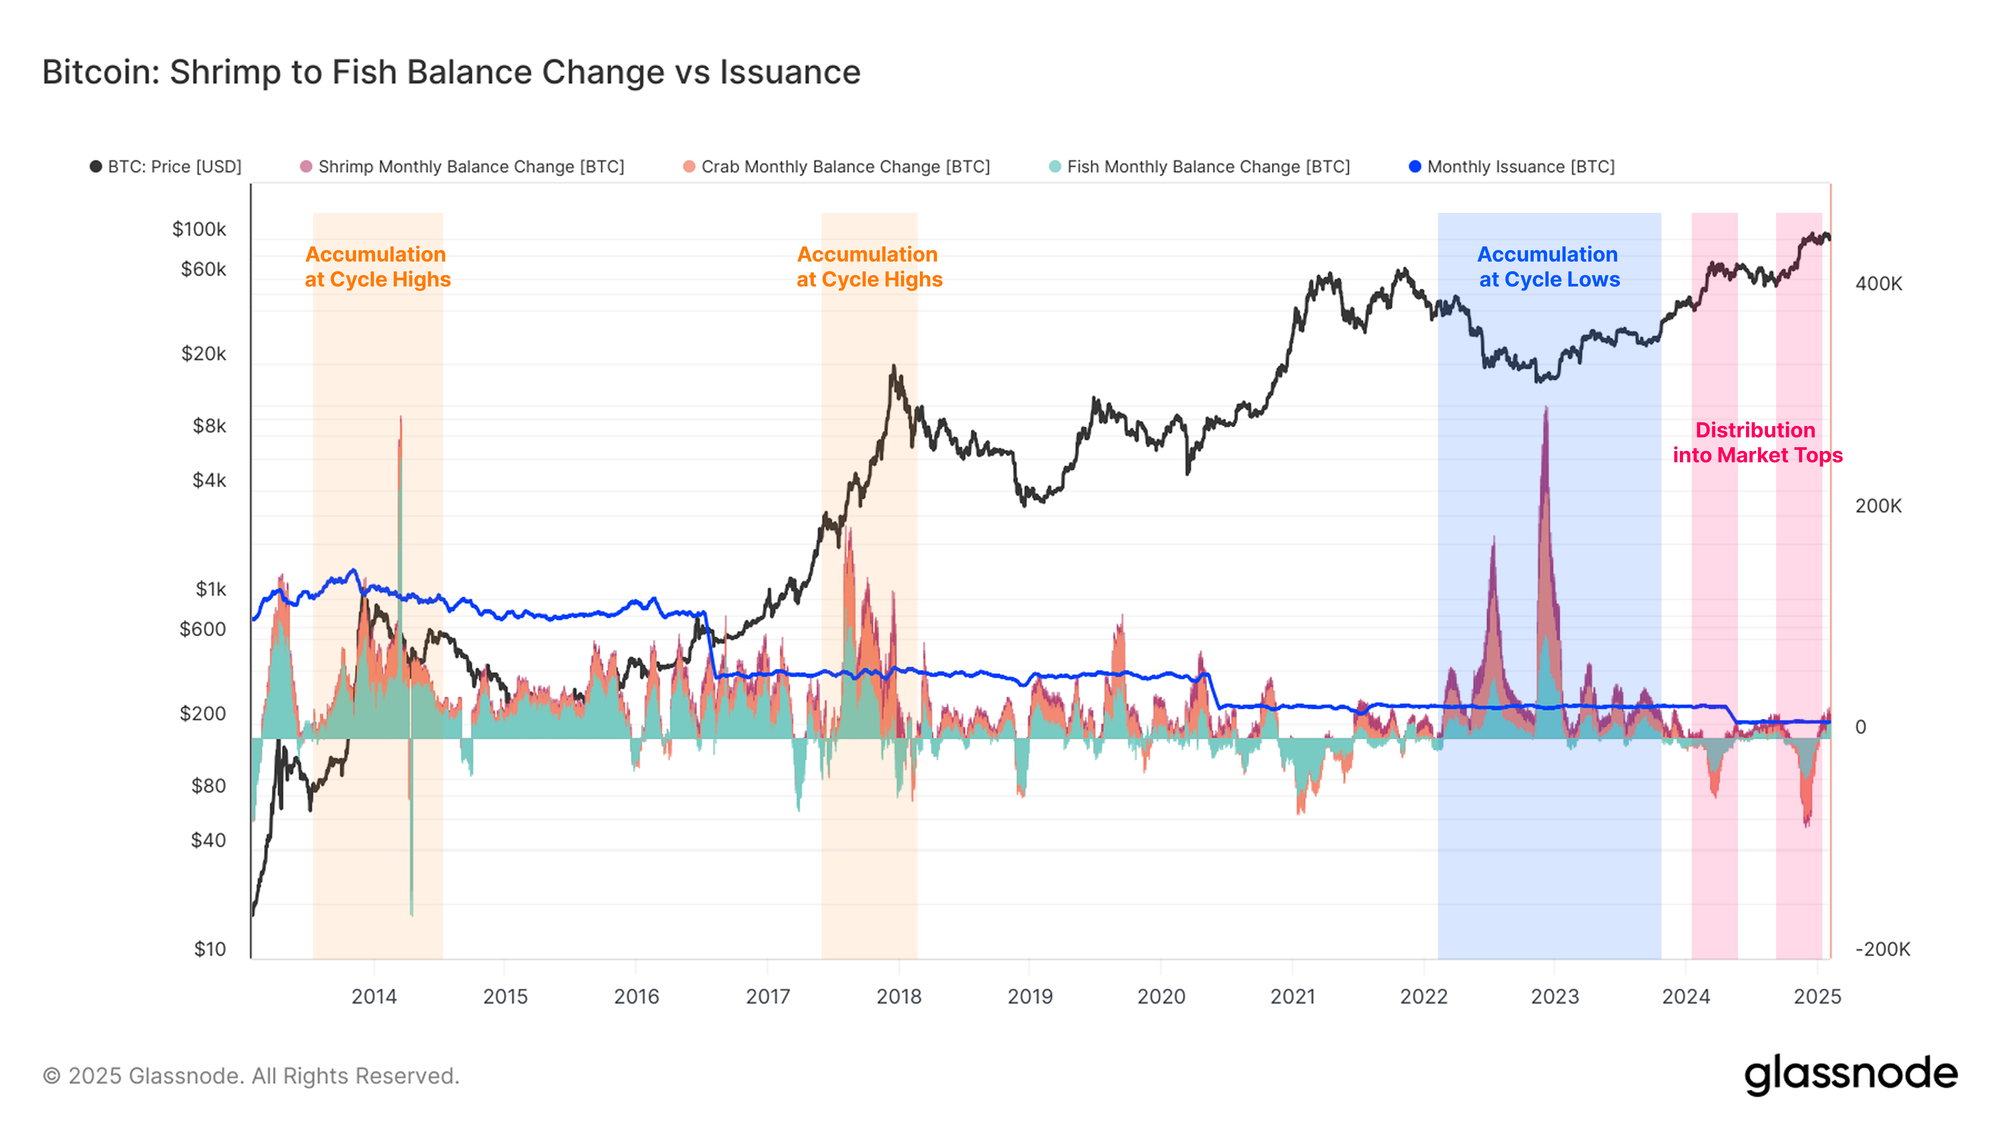
When comparing the balance changes of smaller entities (Shrimp-Crab holding <10 BTC), we note a stark change in behavioral patterns in recent years.
During the 2013 and 2017 bull runs, we can identify periods of significant coin accumulation from these cohorts, often synonymous with ‘euphoric top buying’. This pattern appears to have broken down this cycle, with smaller entities engaging in more intense accumulation during corrections and pullbacks, and then transitioning into distribution as the market rallies to new ATHs.
This suggests the presence of a more sophisticated and educated investor base, even amongst those typically considered retail investors.
The introduction of the US Spot ETF Bitcoin instruments has also allowed new access for institutional investors, providing regulated exposure to Bitcoin. This has enabled the flow of latent institutional capital, with the ETFs taking in over $40B in net inflows, and breaching $120B in combined AUM in the 12-months since launch.

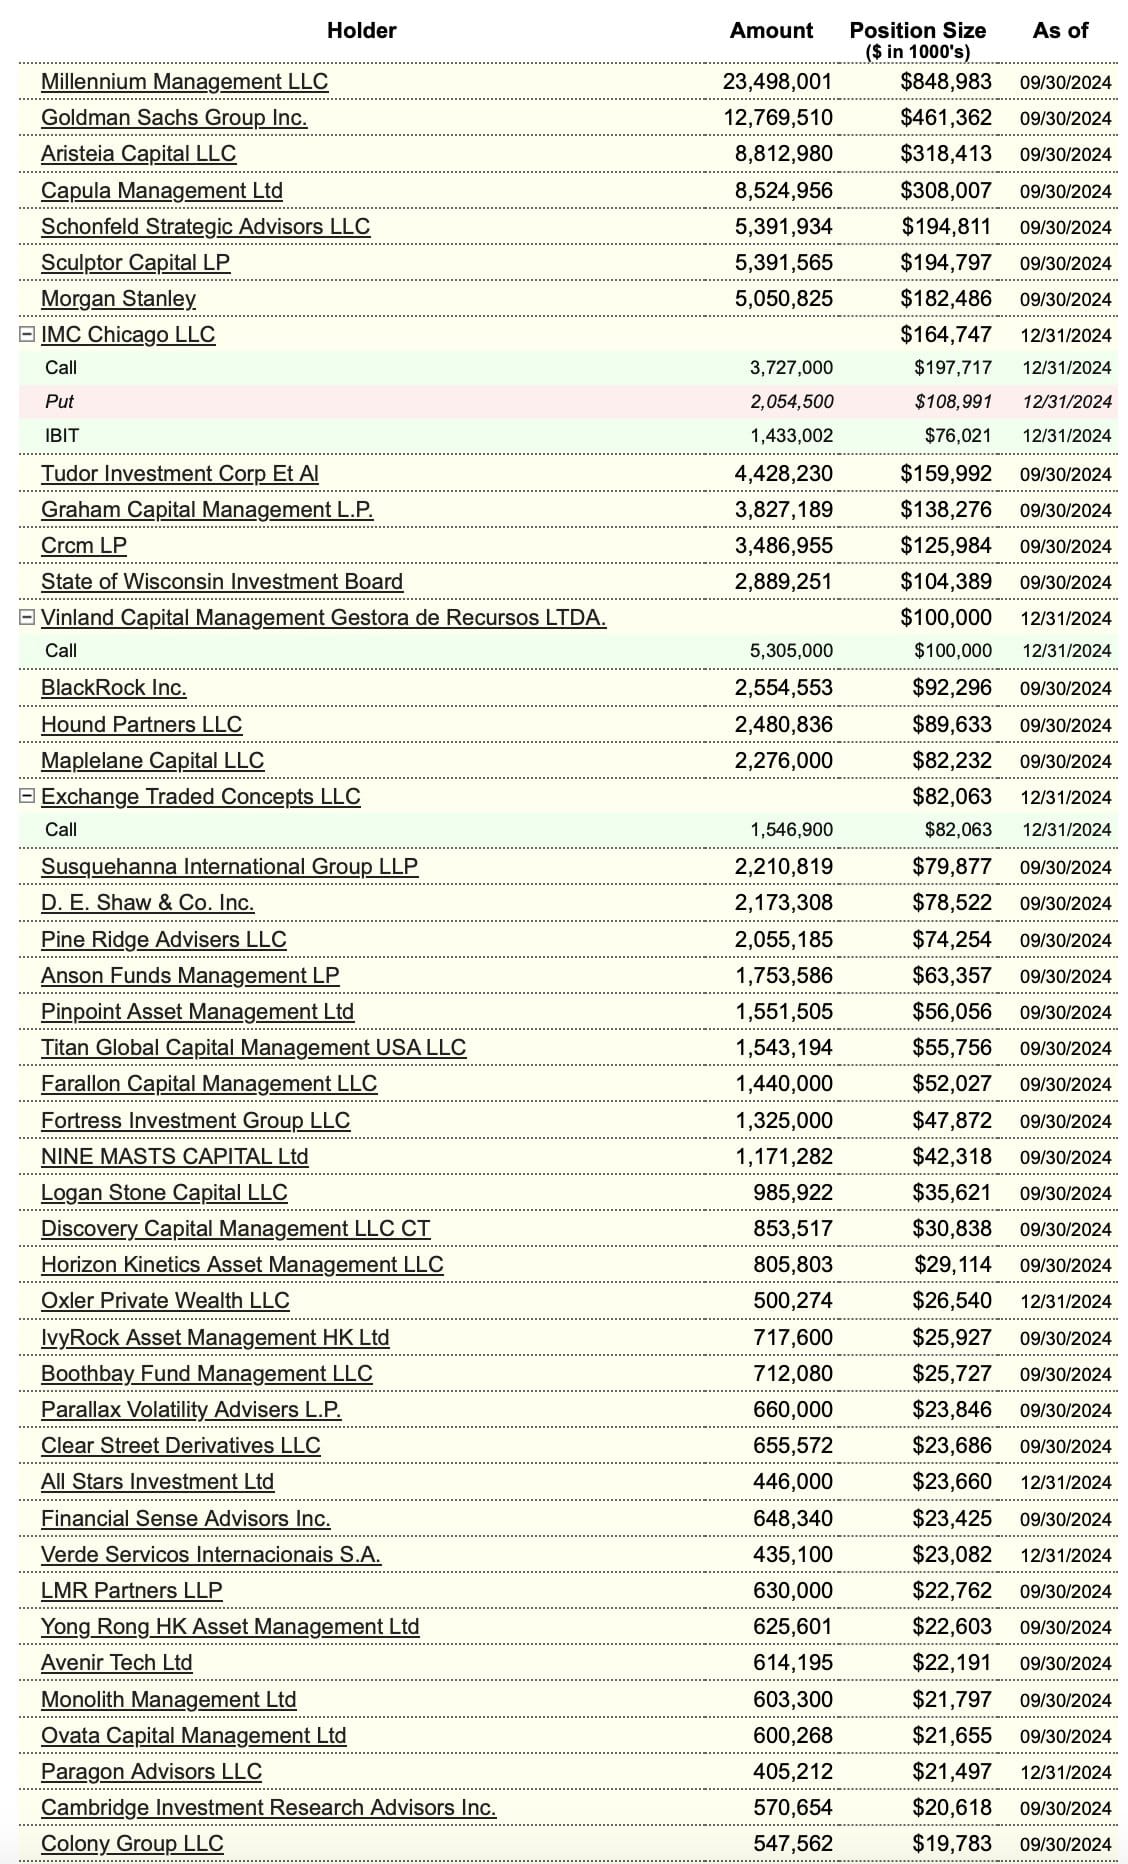
If we dive into the IBIT investor cap table (as noted by analyst TXMC), we can see clear signs of heightened demand from institutional investors. This provides further evidence that Bitcoin is attracting an increasingly sophisticated investor base.
Controlled Downside
One of the many advantages of onchain data is it helps us profile the behavior of investors during periods of stress, such as during pullbacks and drawdowns.
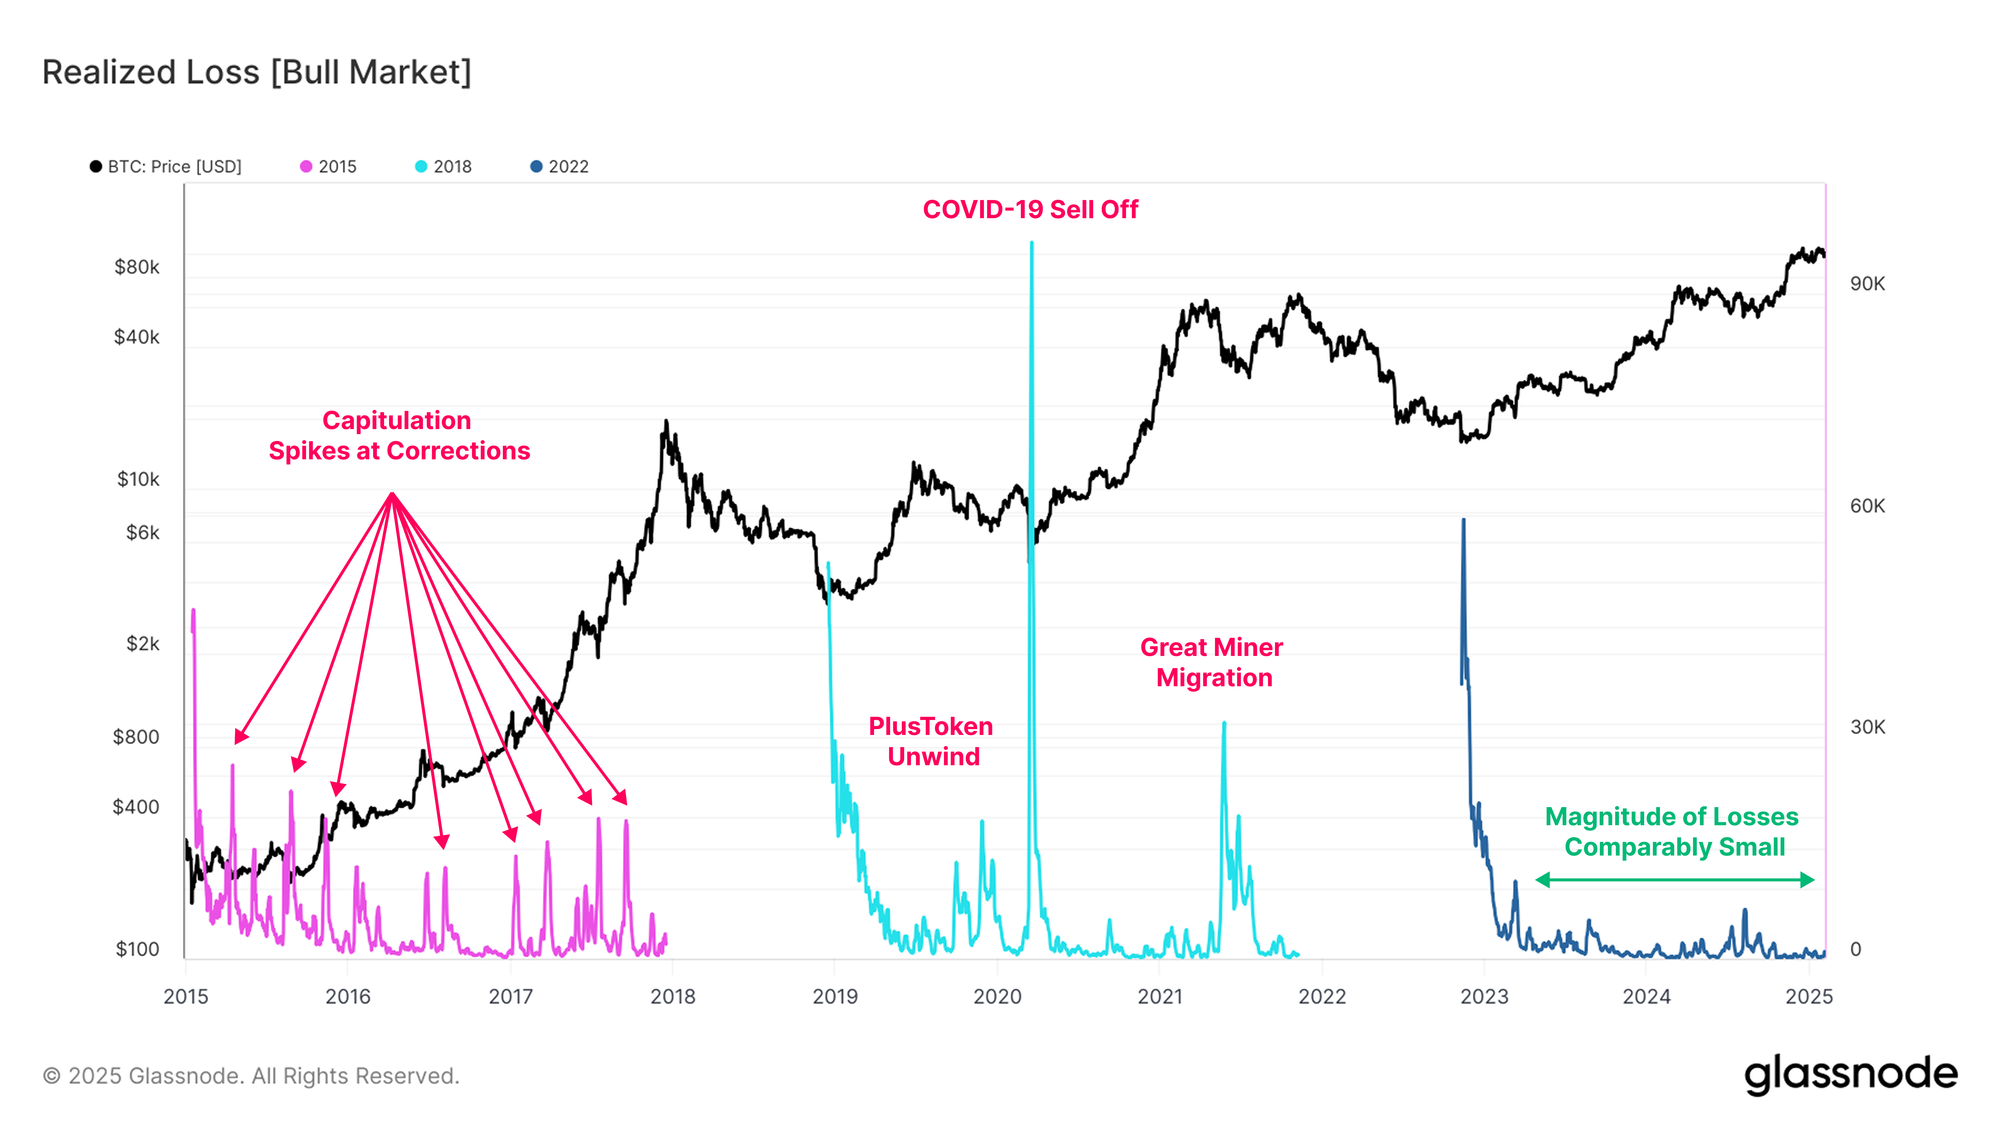
When we assess the magnitude of realized loss locked in during bull markets, our current cycle remains the most reserved. The only standout event where significant losses were taken by Bitcoin holders is the yen-carry unwind on 5-August. Outside of this, loss magnitudes have remained comparatively small, portraying a more patient, resilient, and price insensitive investor base.
This deviates meaningfully from previous cycle structures, where the 2015-2018 cycle was characterized by multiple periods of local capitulation. The 2019-2022 period was even more volatile, experiencing several deep and severe capitulation events, such as PlusToken unwind in mid-2019, The COVID-19 sell off in March 2020, and the great miner migration in mid 2021.
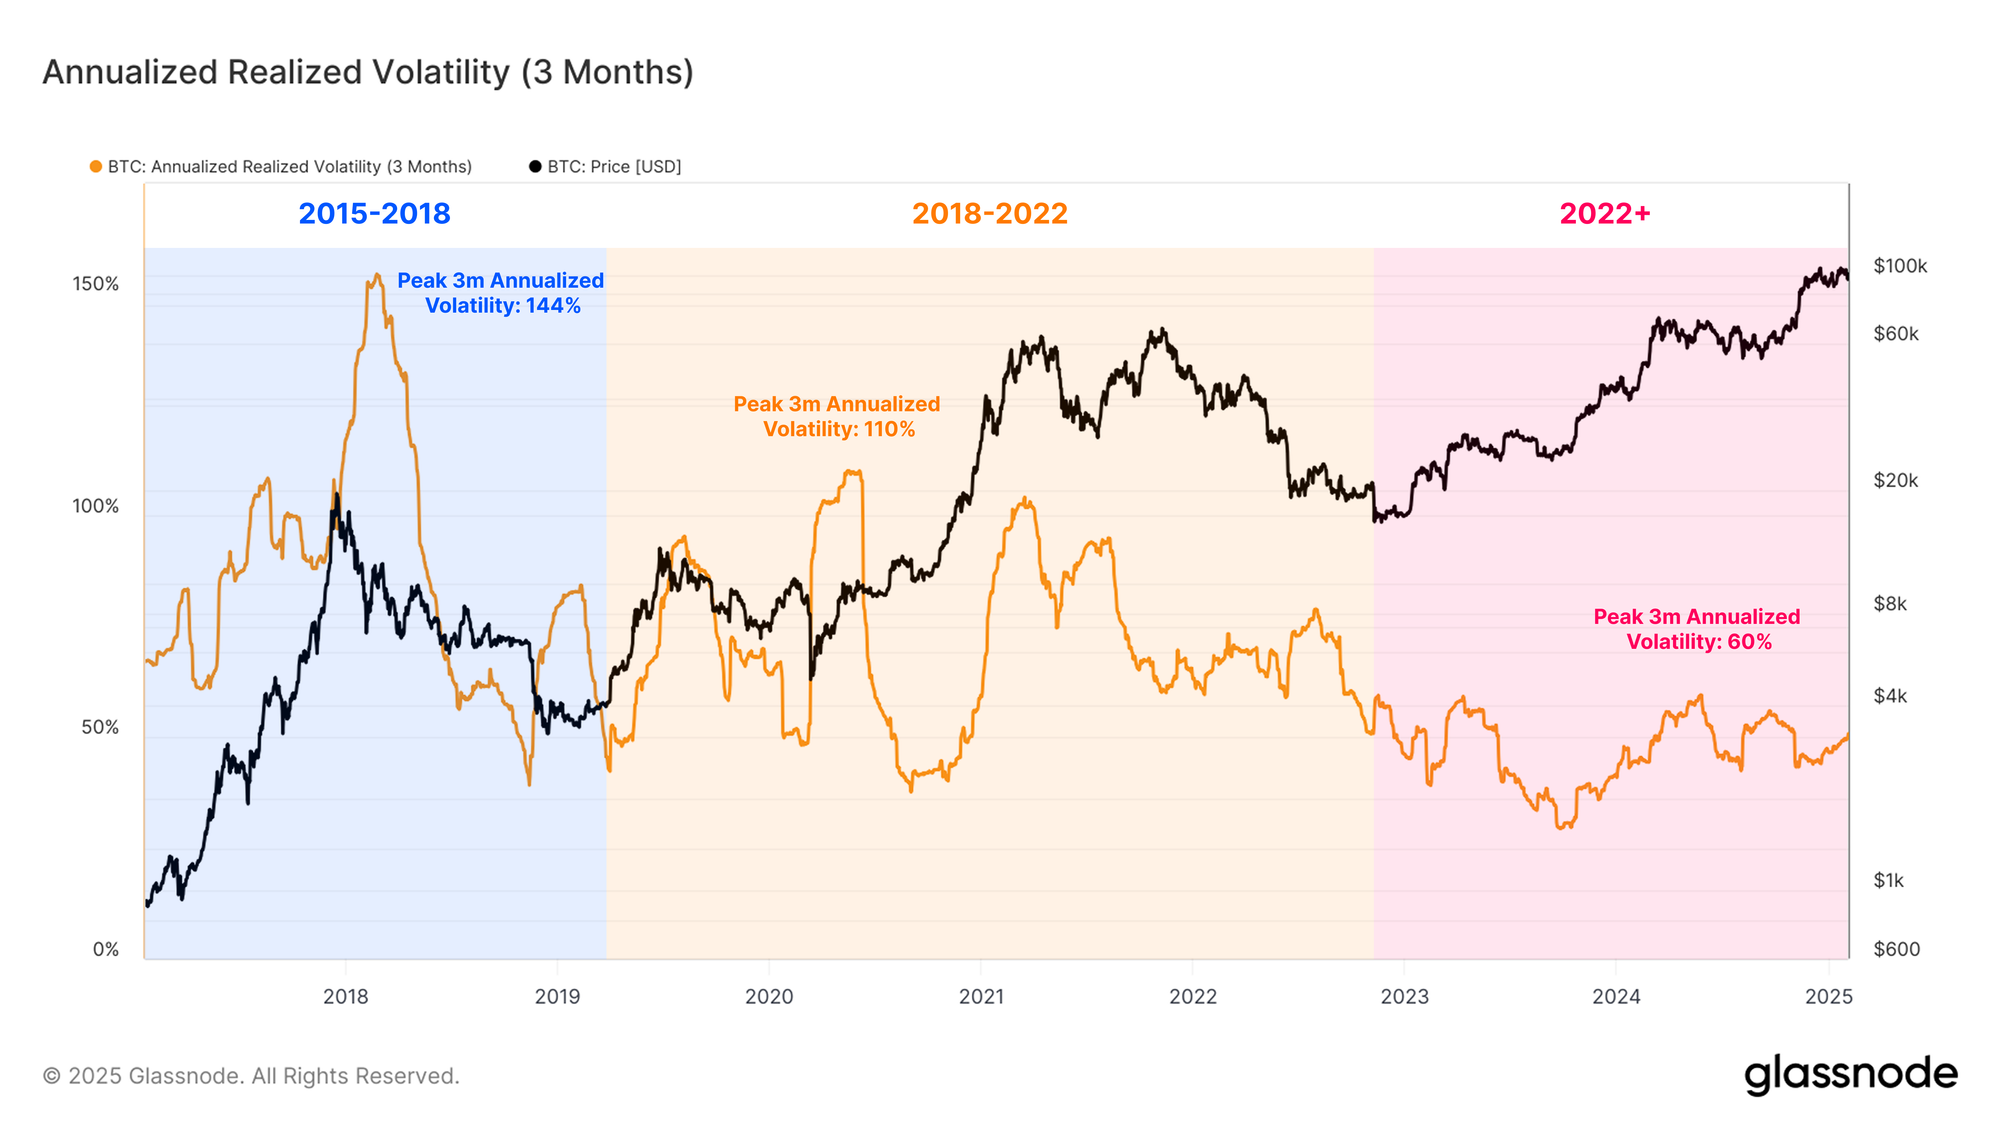
The volatility profile of Bitcoin is also in a state of change, with realized volatility trading at historically low levels for a bull market. Realized volatility on a 3-month rolling window is typically below 50% this cycle, whereas it regularly exceeded 80% to 100% in the prior two bull runs.
This reduced volatility profile, alongside the relatively level-headed investor base, has manifested as a much more stable price structure. The 2023-25 cycle thus far has been largely a sequence of stair-stepping price action (upwards rallies followed by periods of consolidation).
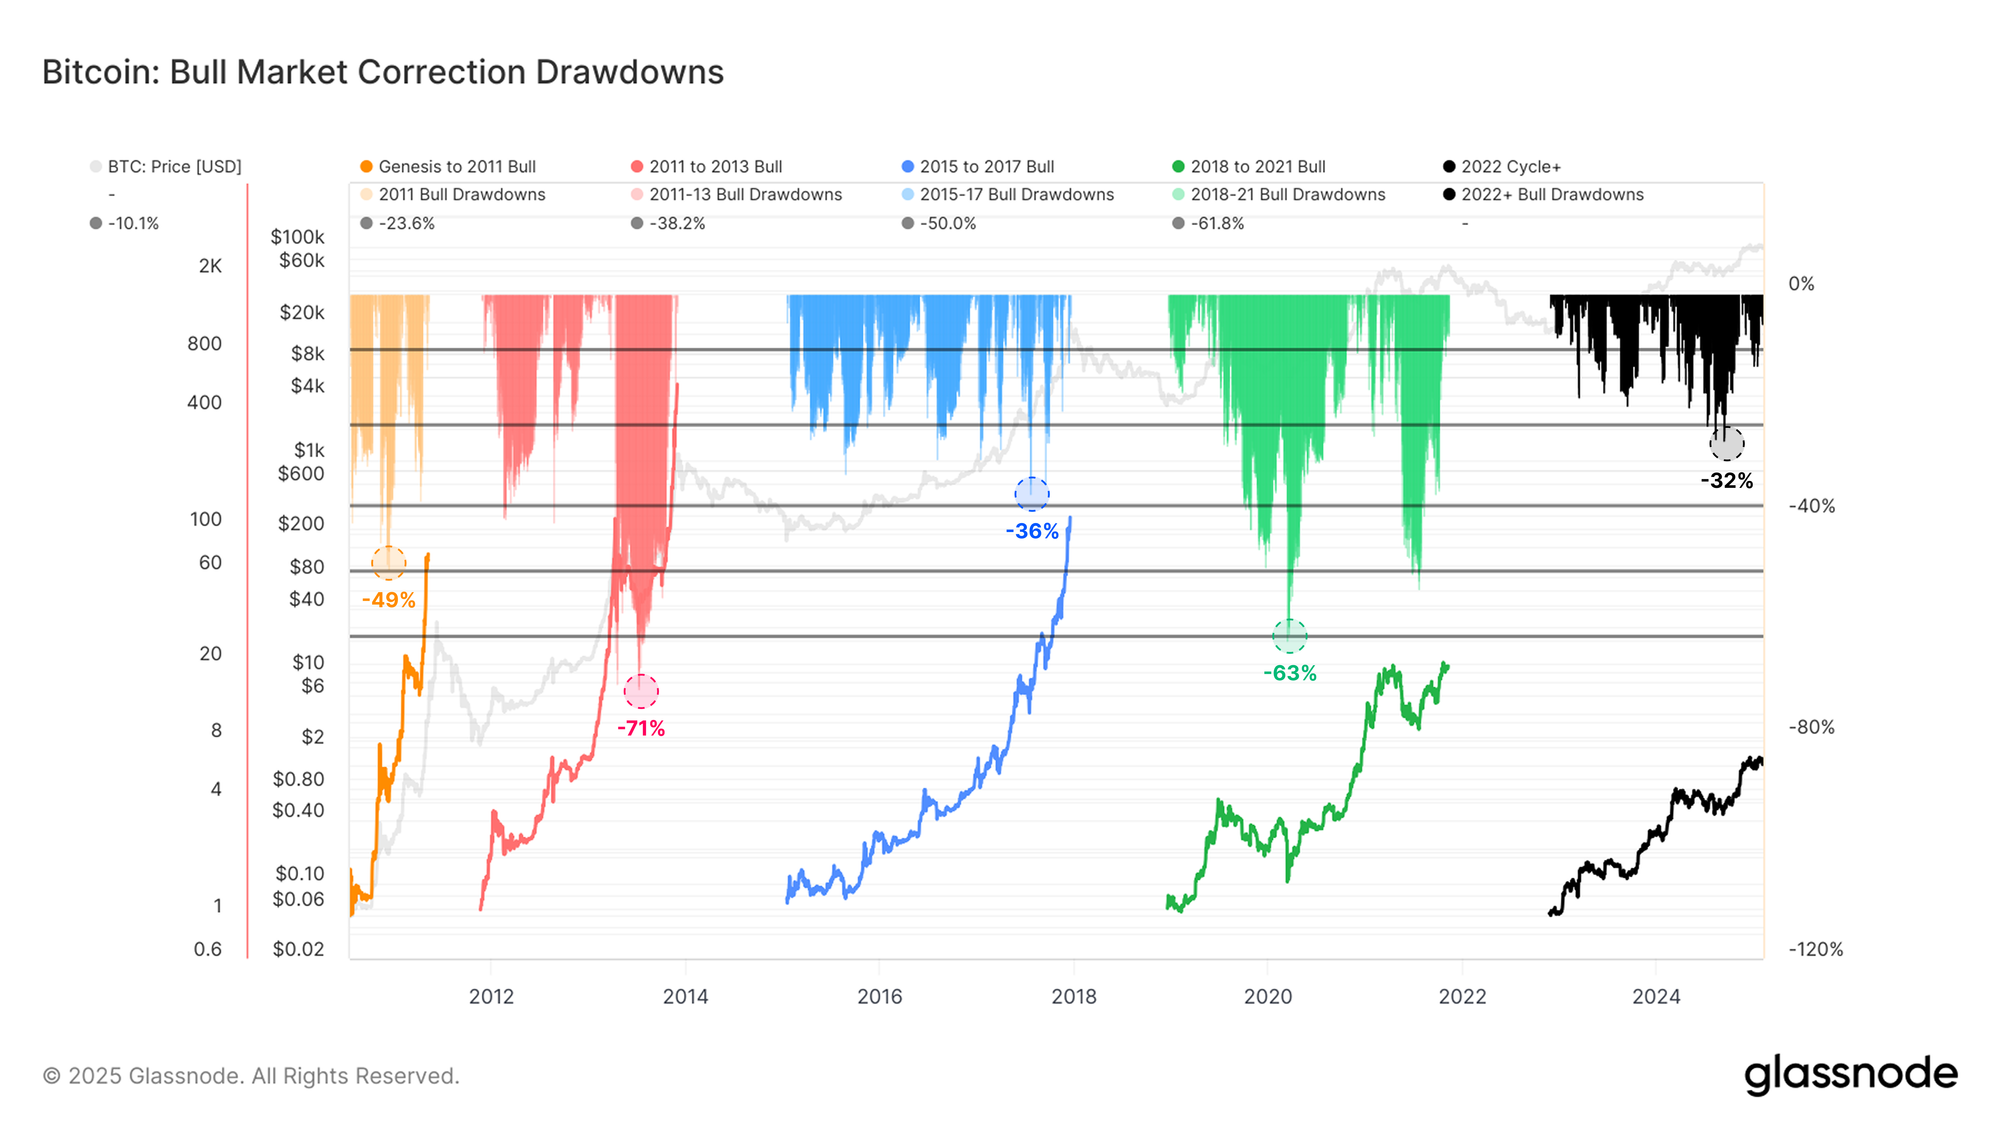
We have also seen a more controlled drawdown profile, with the current cycle experiencing the shallowest average drawdown from the local high of all cycles to date.
Summary and Conclusions
Bitcoin continues to establish itself as a global macro asset. Its constant availability for trading allows investors to express their market opinions at any time of the day, whilst its deep liquidity enables investors to execute trades at significant sizes.
Addressing the criticisms regarding Bitcoin's role as a store of value and medium of exchange, the network has attracted over $850 billion in net capital inflows, whilst processing nearly $9 billion in economic volume daily. This data largely dispels challenges about these claims.
Recent regulatory changes in the digital asset ecosystem have spurred an evolution in the composition of investors, leading to a greater presence of sophisticated institutional investors in the Bitcoin market. This more patient, resilient, and less price-sensitive investor base has contributed to a reduction in the magnitude of drawdowns and a decrease in volatility over time.
Disclaimer: This report does not provide any investment advice. All data is provided for information and educational purposes only. No investment decision shall be based on the information provided here and you are solely responsible for your own investment decisions.
Exchange balances presented are derived from Glassnode’s comprehensive database of address labels, which are amassed through both officially published exchange information and proprietary clustering algorithms. While we strive to ensure the utmost accuracy in representing exchange balances, it is important to note that these figures might not always encapsulate the entirety of an exchange’s reserves, particularly when exchanges refrain from disclosing their official addresses. We urge users to exercise caution and discretion when utilizing these metrics. Glassnode shall not be held responsible for any discrepancies or potential inaccuracies. Please read our Transparency Notice when using exchange data.
- Join our Telegram channel.
- For on-chain metrics, dashboards, and alerts, visit Glassnode Studio.