
HTXqueen
08/20 17:08
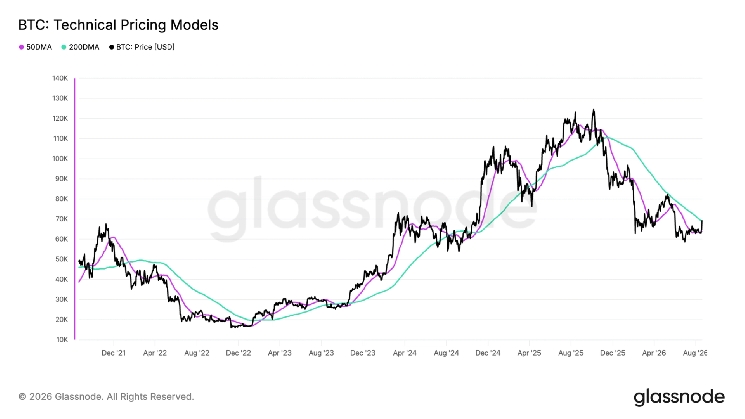
pattern commonly interpreted as a bullish long-term momentum signal. The pattern would emerge if bitcoin’s 50-day simple moving average (SMA), currently at $63,976, continues to rise and crosses above its 200-day SMA, currently at $69,005.
The potential crossover comes as bitcoin trades above $71,000, having gained more than 12% over the past week. The price is also slightly above its 200-day SMA.
The 200-day SMA tracks bitcoin’s average closing price over the previous 200 days and is widely# Trending Token Price Prediction Challenge #HTX Creation Challenge — Post and Win 1,500U #HTX Refer And Earn
2Chia sẻ
Tất cả bình luận0Mới nhấtPhổ biến