Bitstar2
06/21 07:28
Ethereum Price Analysis: The Daily Chart
Ethereum Price Analysis: The Daily Chart
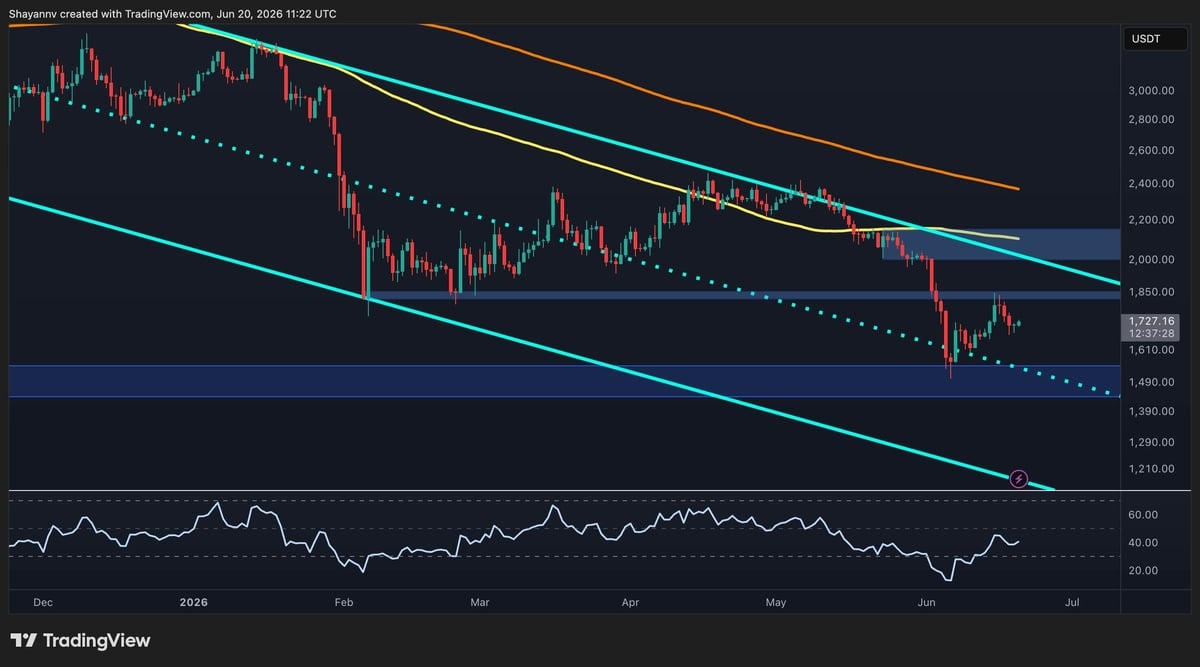
On the daily timeframe, $ETH remains firmly inside the large descending channel that has guided price action lower for several months. The asset recently broke below the important $1.85K support area, which has now flipped into resistance. The breakdown accelerated selling pressure toward the major demand zone at roughly $1.5K. This area, coinciding with the mid-line of the channel, has successfully halted the decline so far, producing a relief bounce back toward the $1.8K region.
However, the asset was rejected from the $1.8k zone, and the broader structure remains bearish as $ETH continues to trade below both the 100-day and 200-day moving averages, which are sloping downward in the $2.1K-$2.4K range.
The former support zone around $2K now represents the most significant resistance cluster overhead. A recovery into that area would likely attract fresh selling interest unless accompanied by a decisive breakout above the descending channel.
Yet, as long as $ETH remains below $1.85K and beneath the channel resistance, the prevailing trend favors sellers. A decline from current levels could expose the $1.5K support region once again, while a breakdown below that demand zone would open the door for a deeper drop toward the lower boundary of the channel below the $1.2K mark.
#HTX Creation Challenge — Post and Win 1,500U 💥 #World Cup Predictions: 100,000 USDT Daily #BTC Prophet: 20-Day 380 Million HTX Challenge $ETH
24Chia sẻ
Tất cả bình luận0Mới nhấtPhổ biến