T4Trader
09/04 12:56
SUI Price Action:
SUI Price Action: Breakout Patterns Build Across the Charts
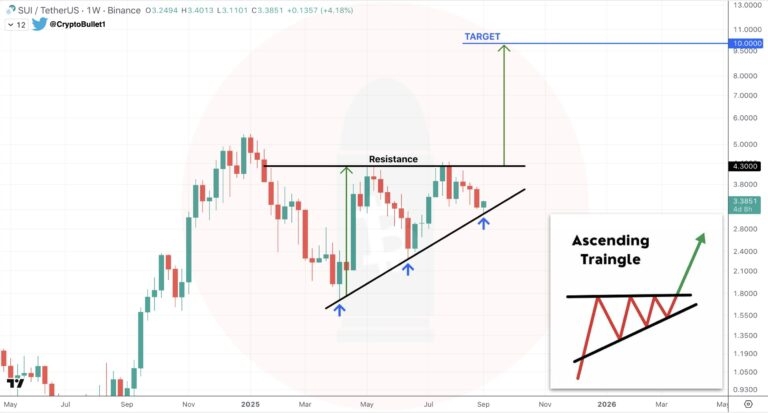
On the weekly chart, SUI price has built a rising base through an ascending triangle, holding firm above $3.10 across several tests. Each bounce off support has added pressure to the $4.30 barrier, which continues to act as the gatekeeper for higher levels with the SUI current value trading at $3.31.
According to an analyst on X platform, a breakout above this ceiling could spark a run toward $10, aligning with the measured target of the triangle. The pattern reflects steady absorption of sell pressure, with green candles forming after each dip.
Buyers appear willing to step in repeatedly, reinforcing the base. If $4.30 finally cracks, the structure favors a swift climb as liquidity thins above.
On the 4-hour chart, the picture has strengthened further after price broke out of a falling wedge and retested the upper boundary around $3.25. This retest provided clean confirmation, flipping the level into fresh support before the next advance.
The breakout has opened a pathway toward $3.50–$3.80, identified as a critical near-term zone. Parabolic SAR dots now sit beneath the candles, while MACD lines have crossed into positive territory, both adding weight to the bullish case.
Holding above $3.18 remains essential, since losing that ground would weaken this setup. With confirmation of the wedge retest and improving technicals, the structure now leans heavily toward continuation.
Importantly, the long-term SUI price outlook remains constructive, supported by strengthening technical structures across multiple timeframes
Tất cả bình luận0Mới nhấtPhổ biến