54551**
08/06 15:35
The 4-Hour Chart Zooming into the lower timeframe
The 4-Hour Chart
Zooming into the lower timeframe, the breakout above $3.4 quickly reversed as sellers stepped in, reinforcing the idea of a bull trap. XRP has since declined sharply, finding support at the 0.5–0.618 Fibonacci retracement zone, which has triggered a minor bullish pullback.
The current price is range-bound between $2.7 (support) and $3.1 (resistance). This consolidation phase could persist unless a strong catalyst emerges.
A bullish breakout above $3.1 would open the door for a retest of the $3.4 high, while a breakdown below $2.7 would expose the $2.58 support as the next key level.
This price behavior reflects classic market manipulation and liquidity dynamics, with smart money exploiting key levels. Traders should remain cautious and watch for a confirmed breakout before positioning for the next move.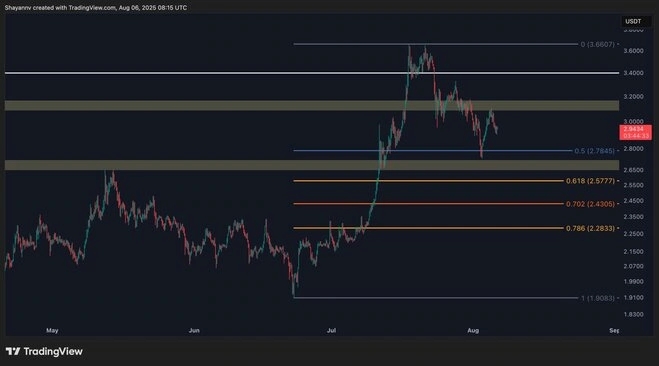
Tất cả bình luận0Mới nhấtPhổ biến