sumaiya
07/14 07:26
Technical Indicators Point to Overheated but Stron
Technical Indicators Point to Overheated but Strong Momentum
HBAR’s technical structure reveals a clear bullish trend. The asset has broken out from the $0.17 range and quickly moved above $0.25. It now trades well above all key EMAs: 20-day ($0.1809), 50-day ($0.1723), 100-day ($0.1776), and 200-day ($0.1801), signaling sustained strength.
The Relative Strength Index (RSI) is at 85.50, solidly in the overbought range. Although this typically indicates caution, good trends tend to keep RSI high for longer times.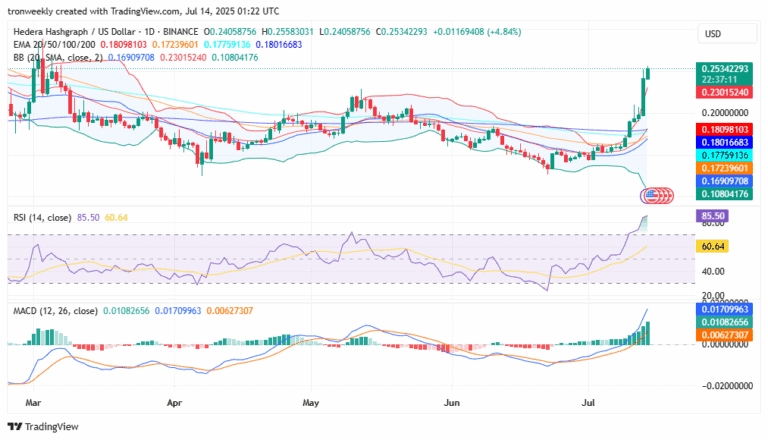
MACD indicators affirm the same, as the MACD line is 0.0171, while the Signal line is 0.0108. The increasing histogram validates positive accelerating momentum.
Bollinger Bands have also become much broader. The present price of $0.2534 is well ahead of the higher band of $0.2301. Although this indicates strong momentum, it is also likely to enhance the possibility of a short-term cool-down or sideways correction ahead of the next move.
Tất cả bình luận0Mới nhấtPhổ biến