This week's Federal Reserve interest rate decision is the core market variable, with short-term volatility expectations rising significantly. Technically, BTC's rebound structure initiated from the July low has entered a crucial stage of range-bound consolidation and central pivot verification, with bulls and bears locked in a tug-of-war near the 364-day moving average; HYPE, after completing a multi-segment rally on the 4-hour chart, has turned to a correction, with topping characteristics gradually emerging near previous highs. This article will combine Chan Theory structure, moving average systems, and position monitoring models to analyze the price action of both assets this week, providing corresponding trading strategies for reference.
Summary of core trading views for this week:
• BTC Daily Chart Structure Analysis (Detailed in Part 1)
• BTC Weekly Forecast and Medium/SHORT-term Trading Strategies (Detailed in Part 2)
• HYPE Hourly Chart Structure Analysis (Detailed in Part 3)
• HYPE Weekly Forecast and Short-term Trading Strategy (Detailed in Part 4)
1. Bitcoin Daily Chart Structure Analysis
The previous column's weekly review introduced the Chan Theory analysis framework, providing a clear assessment of BTC's rebound structure from the July 1st low of $57,820: the price was expected to maintain range-bound consolidation within the $75,500~$82,850 interval and simultaneously form the second rising central pivot on the daily chart. Last week's actual price action showed the price center remained confined within this range, with the pace of central pivot development highly consistent with the prior forecast. This week, we shift our perspective to the moving average dimension, combining multi-period moving average theory to further deconstruct and project the internal structure, evolution, and potential trend-change windows of this rebound.
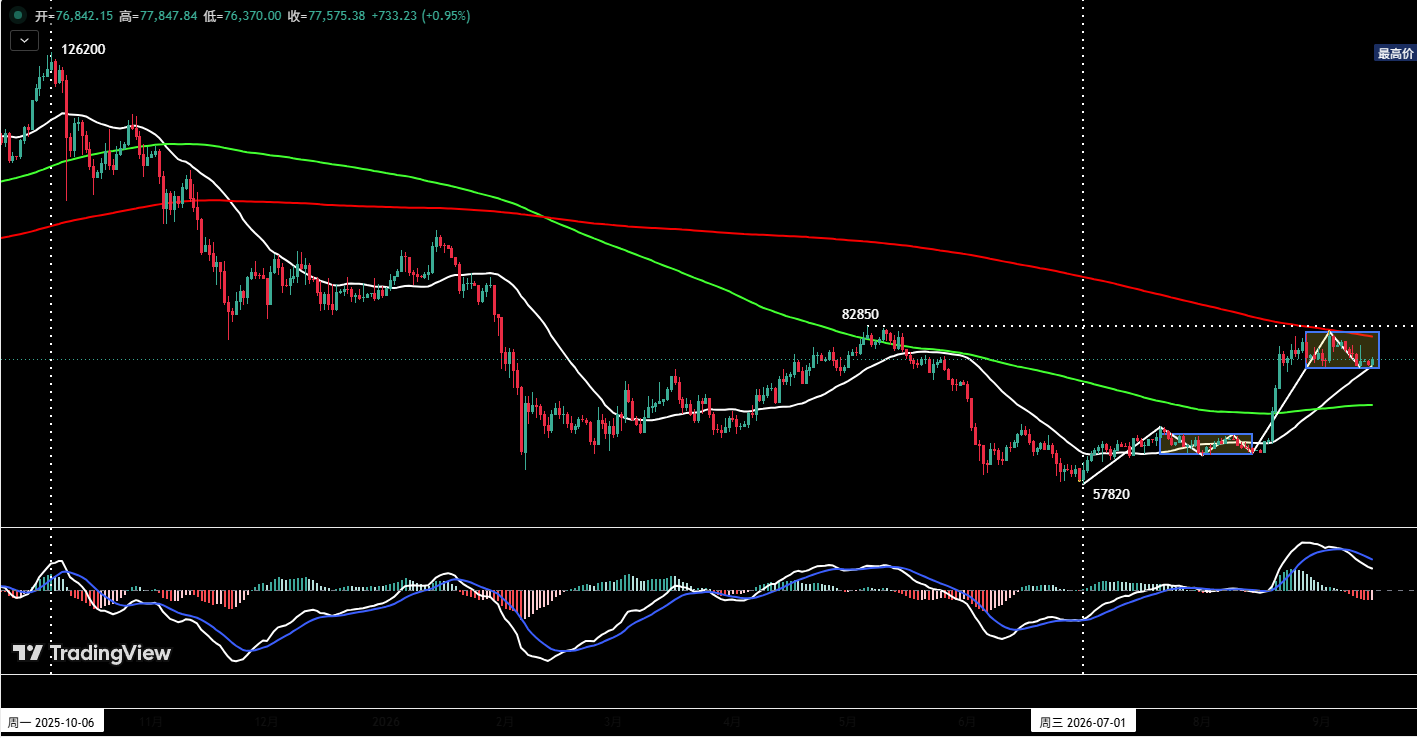
Figure 1: Bitcoin Daily Candlestick Chart
1. Overall Summary
1. As shown in (Figure 1), since peaking at $126,200 in October 2025, BTC has been undergoing a prolonged correction for nearly 345 trading days. On October 29, 2025, the price first effectively broke below the 182-day moving average (green line), and two weeks later, further breached the 364-day moving average (red line); We regard the 364-day moving average (i.e., the 52-week MA) as the market's "bull/bear" dividing line. Its effective breakdown marked the official entry into a deep bear market adjustment phase. As of now, the price has been trading below the 364-day MA for approximately 307 trading days, with the medium-to-long-term bearish structure yet to show signs of reversal.
2. Regarding the current market environment, the most positive factor is: after being absent for nearly 300 trading days, the price reclaimed the 182-day moving average (green) on August 19th and challenged the 364-day moving average (red) for the first time on September 3rd. This move opens up possibilities for subsequent market trends.
2. Short-term Trend Assessment and Scenario Projection
1. BTC's daily-level rebound from the July 1st low initially broke through the 182-day moving average (around $68,940) with volume on August 19th, then continued rising until encountering resistance near the 364-day moving average (around $82,200). The market subsequently entered a high-level range-bound consolidation pattern. Currently, the price is in a state of "resistance above, support below"; overhead pressure comes from the dual suppression of the 364-day MA and the key resistance level at $82,850, while support below is provided by the dual buffers of the 30-day moving average (white) and the range bottom at $75,500.
2. The latter half of this week, the Fed will announce its interest rate decision. Therefore, the market has entered a critical window period. Based on the current situation, we project two possible subsequent paths.
Path One (Pre-announcement Rebound): The market continues its rebound in the first half of the week. After the interest rate decision is announced, there is a possibility of a rapid surge influenced by the news, potentially even a brief breakout above the dual overhead resistance. However, investors are reminded not to blindly chase the rally, as upside space would be relatively limited. Be wary of the risk of a pullback following a potential "bull trap" spike.
Path Two (Pre-announcement Consolidation or Minor Correction): Supported by the range bottom and the 30-day MA, the price consolidates narrowly or undergoes a minor correction around this area in the first half of the week. After the announcement, there is a possibility of a rapid sell-off due to the impact, potentially even a momentary breach of support. However, we believe this is not the time to chase and short-sell. Instead, be vigilant for a potential rebound after the "event risk" clears, utilizing the key support of the 182-day MA below, which could lead to another challenge of the recent high around $82,500.
2. Bitcoin Weekly Forecast and Trading Strategy
1. BTC Weekly Price Action Forecast Core View for This Week: Adopt a wait-and-see approach in the first half of the week. After the decision news "lands" in the latter half, make trading decisions based on the price level.
2. Key Resistance Levels
• First Resistance Zone: $81,700~$82,850 area (previous important levels)
• Second Resistance Zone: $84,500~$86,500 area (previous key resistance zone)
• Third Resistance Zone: $90,000 area (key round-number level)
3. Key Support Levels
• First Support Zone: $73,500~$75,000 area (previous important support)
• Second Support Zone: $67,300~$69,100 area (previous important support)
4. Weekly Trading Strategy (Excluding Unforeseen News Impact)
1. Medium-term Strategy:
Figure 2: Bitcoin Daily Candlestick Chart (Position Monitoring Model)
Position Monitoring Model: As shown in (Figure 2), the price has broken through the "Bull/Bear Channel," leading to a change in the short-term market structure. However, the post-breakout retest and confirmation phase has not yet occurred. Given this, the current medium-term position is maintained at zero, with a primary stance of holding cash and observing.
2. Short-term Strategy: Utilize 30% of capital, set stop-loss points, and look for "spread" trading opportunities based on support and resistance levels. (Use 30-minute/60-minute charts as the operating cycle).
3. For short-term operations, to dynamically adapt to the market's complex evolution, we have prepared two operational plans A/B in advance.
Plan A: Lightly Test Long in Strong Support Zone.
• Entry: If, after the decision is announced in the latter half of the week, the price retraces to the area above the second key support, showing clear signs of stabilization and the quantitative model simultaneously emits a bottoming signal, a long position of around 30% can be established.
• Risk Control: Set an initial stop-loss level.
• Exit: When the rebound reaches near important resistance levels and combined with model signals, gradually liquidate the position to take profits.
Plan B: Lightly Test Short in Strong Resistance Zone.
• Entry: If, after the decision is announced in the latter half of the week, the price rises to the $82,850~$84,500 area, showing clear signs of rejection and a top signal from the quantitative model simultaneously, a short position of around 30% can be established.
• Risk Control: Set an initial stop-loss level.
• Exit: When the correction reaches near important support levels and combined with model signals, gradually liquidate the position to take profits.
3. HYPE Hourly Chart Structure Analysis
This week's review continues to introduce the Chan Theory analysis framework to systematically deconstruct and analyze HYPE's rebound structure from the August 2nd low of $51.11.
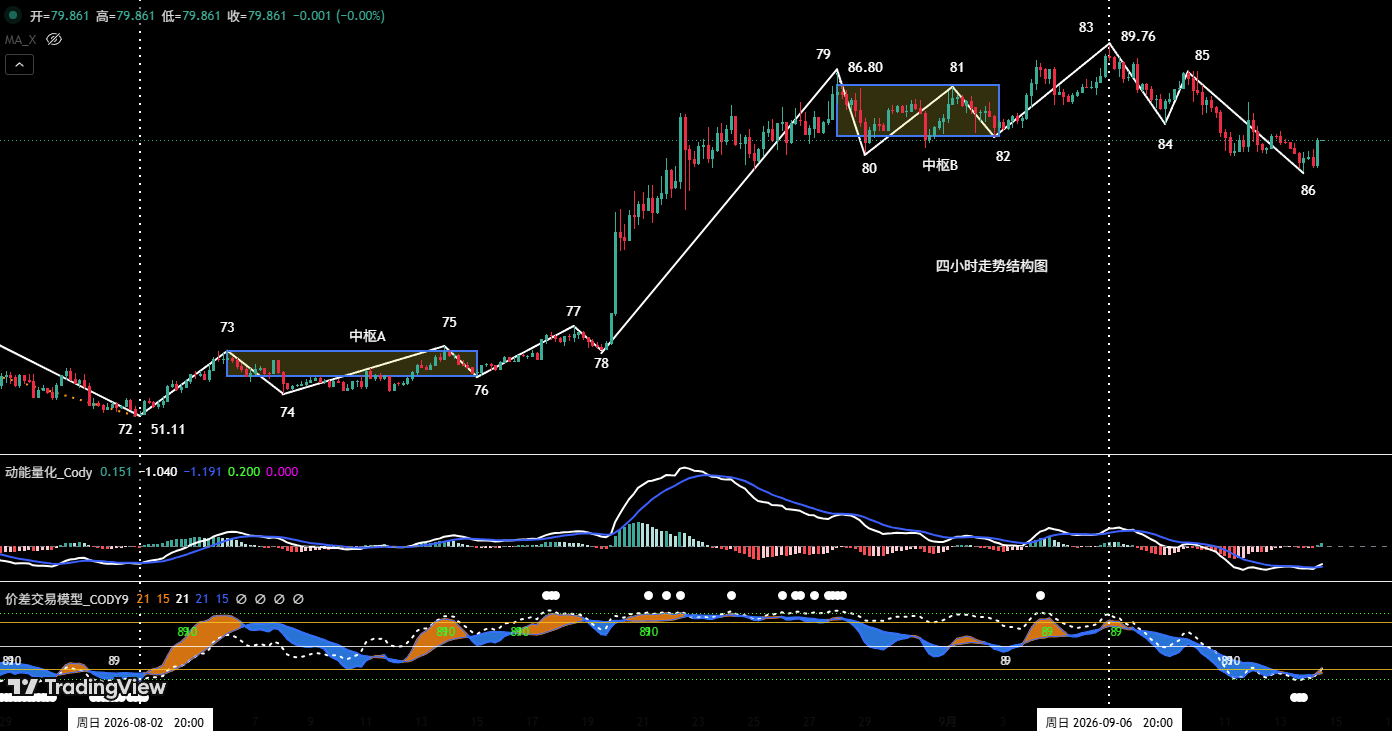
Figure 3: HYPE 4-Hour Candlestick Chart
1. Overall Structure Overview
As shown in (Figure 3): The uptrend in HYPE initiated from the August 2nd low of $51.11 can be clearly deconstructed on the 4-hour chart into a 14-segment rising structure from (72-73) to (85-86).
2. Rising Central Pivot Construction
1. Central Pivot A Construction: Based on the overlapping price ranges of the three segments (73-74), (74-75), (75-76), the first rising central pivot (Central Pivot A) was constructed. Segment (72-73) is the entry segment, and (78-79) is the exit segment. (Detailed in the previous weekly review)
2. Central Pivot B Construction: According to the overlapping price ranges of the three segments (79-80), (80-81), (81-82), the second rising central pivot (Central Pivot B) was constructed. (78-79) is the entry segment, and (82-83) is the exit segment.
3. Analysis Based on Central Pivot B Structure
The exit segment (82-83) of Central Pivot B showed significant correction after reaching a new all-time high of $89.76. Comparing the rising momentum, this segment exhibits a clear divergence relationship with the entry segment (78-79). Based on this, it is assessed that the probability is extremely high that this daily-level uptrend initiated from the August 2nd low of $51.11 concluded around the $89.76 level.
4. Post-Uptrend Conclusion Assessment Starting from "Endpoint 83," the market developed a three-segment correction structure: (83-84), (84-85), (85-86). As shown in (Figure 3), the termination point of (85-86) has already broken below the key support of $80, and the force of this correction segment is noticeably stronger than segment (83-84). These structural features further confirm that the previous rebound concluded at $89.76 and has transitioned into a downward adjustment phase.
4. HYPE Weekly Forecast and Short-term Trading Strategy
1. HYPE Weekly Price Action Forecast
1. Key Resistance Levels:
• First Resistance Level: Around $90
2. Key Support Levels:
• First Support Zone: $76~$77 area;
• Second Support Zone: $71.5~$73 area;
3. Core View for This Week: Focus closely on the strength of the rebound after potential stabilization around $77. Its intensity is a key variable in assessing the duration of the subsequent adjustment cycle.
2. HYPE Weekly Short-term Trading Strategy
Long positions previously established according to the plan in the $50~$52 interval were fully liquidated for profits around $80 last week. Approaching the critical interest rate decision window this week, it is recommended to hold cash and observe for now.
5. Special Notes
- When Opening a Position: Immediately set an initial stop-loss level.
- When Profit Reaches 1%: Move the stop-loss to the entry price (breakeven point) to ensure capital safety.
- When Profit Reaches 2%: Move the stop-loss to the level where profit was 1%.
- Continuous Tracking: Thereafter, for every additional 1% profit the price makes, move the stop-loss up by 1%, dynamically protecting and locking in gains.
Financial markets are ever-changing. All market analysis and trading strategies require dynamic adjustment. All views, analytical models, and operational strategies mentioned in this article are derived from personal technical analysis, intended solely as a personal trading log, and do not constitute any investment advice or operational basis. The market carries risks; investment requires caution. Please do not make decisions based on this content.