Author: Bull Theory
Compiled by: Yuliya, PANews
Is the Bitcoin 4-year cycle still valid? It was the most predictable crash in crypto history, yet no one was prepared.
At the peak of the 2025 bull market, a common refrain in the crypto space was: The 4-year cycle is dead, institutional entry has changed everything, the old rules no longer apply. Yet, Bitcoin topped almost exactly on schedule, subsequently fell 50%, and is now exactly where the cycle framework predicted it would be. So, let's be honest about what happened.
The Four-Year Cycle Isn't Dead, the Buyers Are Just Different
Throughout 2024 and early 2025, the crypto market was flooded with a narrative: Bitcoin ETFs changed everything, institutions are buying, the traditional 4-year cycle driven by halvings and retail FOMO no longer applies. This is a super-cycle, bear markets won't come again.
The argument sounded convincing. Bitcoin made a new all-time high before the halving even occurred, which was unprecedented. ETF inflows broke records. Michael Saylor was buying billions worth of Bitcoin every week. Mainstream financial media covered Bitcoin as a compliant asset class for the first time. The entire atmosphere suggested the old rules were obsolete.
However, Bitcoin peaked at $126,296 on October 6, 2025, and began to decline. Currently, its price has fallen about 50% from the high, the Fear & Greed Index is in Extreme Fear, and a death cross has appeared on the chart. The cycle thought to be dead is playing out with the same precision as in 2013, 2017, and 2021.
The 4-year cycle didn't die; it just became more stealthy. The reason it became stealthy, and the reason why no one saw the top coming, why none of the top indicators triggered, is the single most important point for understanding where we are and where we're going.
But before diving into that, it's necessary to understand what the cycle is and why it has held for over a decade. Because those denying the cycle weren't entirely wrong. The market *did* change; it's just that the cycle didn't break, it changed along with the market.
Every four years, a halving event cuts the number of newly minted bitcoins by 50%. Miners are Bitcoin's largest and most consistent sellers, mining it and selling it to cover operational costs. When a halving cuts their output in half, the daily number of bitcoins dumped onto the market plummets. If demand remains constant or increases, price must eventually rise. This is the fundamental mechanism of Bitcoin's price action; it's not a theory, it's supply and demand.
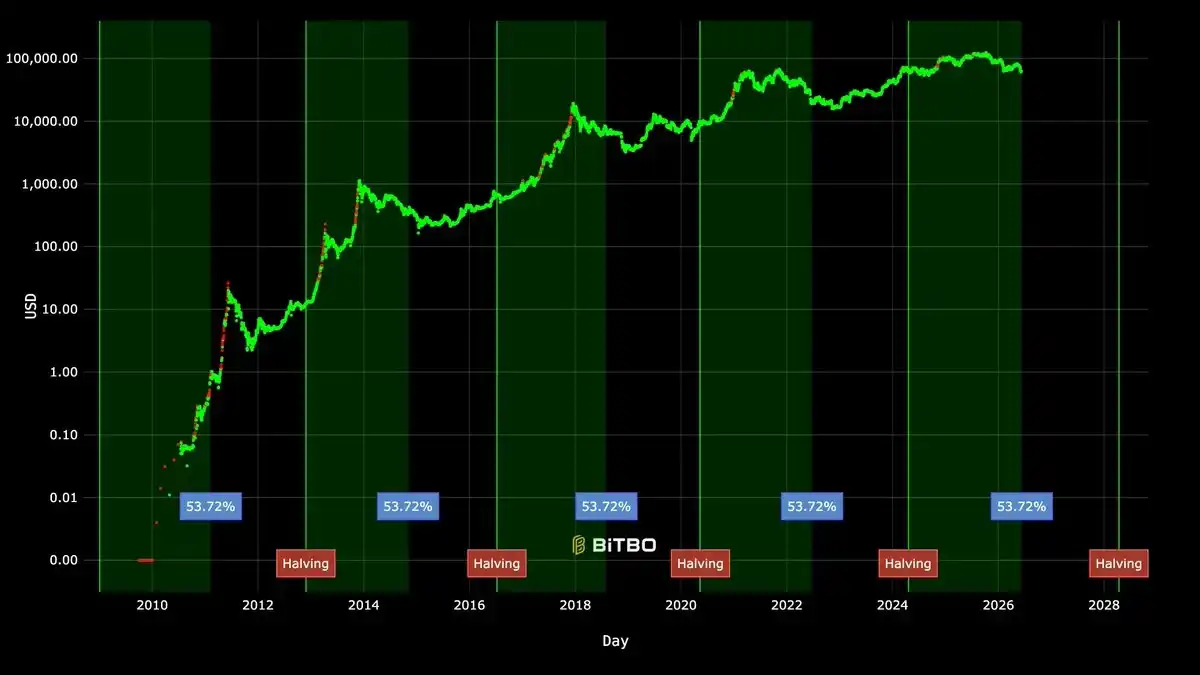
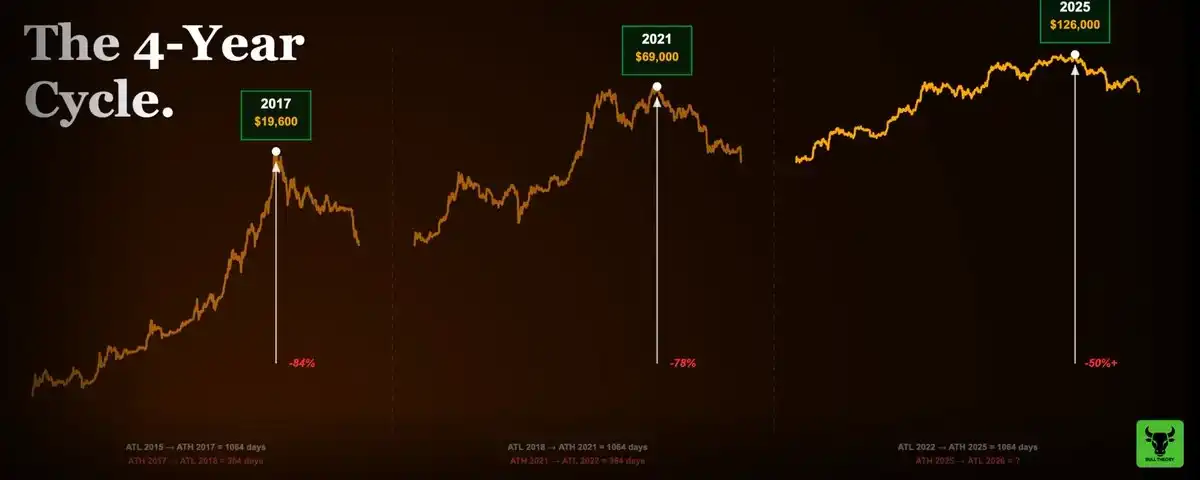
Looking back at each halving since 2012, Bitcoin's bull and bear transitions repeated without exception.
Four cycles, four halvings. Each had essentially the same basic structure. This is what those declaring the cycle dead missed: The cycle doesn't care about narratives. It runs on a supply-demand mechanism, and that mechanism doesn't change just because institutions started buying via ETFs. The April 2024 halving occurred on schedule. Bitcoin peaked 535 days later, on October 6, 2025. This falls right within the historical window of 480 to 550 days post-halving for previous cycle tops.
The cycle never died. It just *looked* different on the surface because the buyers were different. And this difference—institutional demand replacing retail demand—is precisely why none of the top indicators triggered, and why most people watching for top signals completely missed the top.
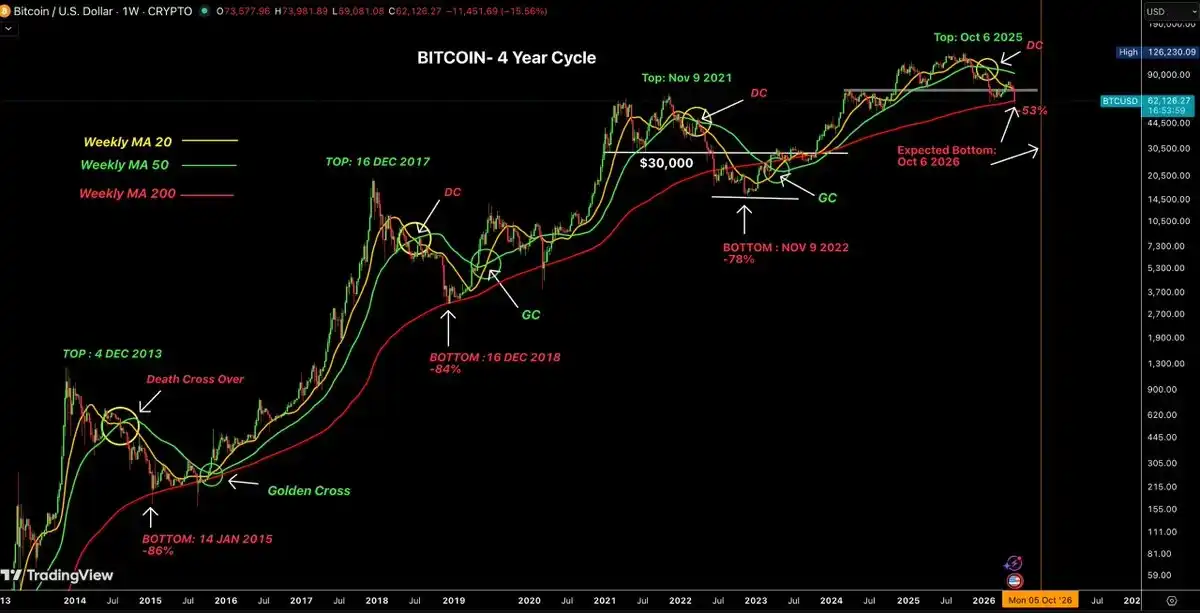
Tracking these four Bitcoin cycles, recording tops, bottoms, death crosses, golden crosses, and the 200-week moving average
There's another stable pattern in these cycles that doesn't get enough attention: Bottoms always occur roughly one year after the top. Not exactly one year, but the range is remarkably tight. After the 2013 top, the bottom came 410 days later. After 2017, it was 363 days. After 2021, it was 376 days. If this rhythm still holds, the bottom for the current cycle would fall between late September and mid-November 2026.
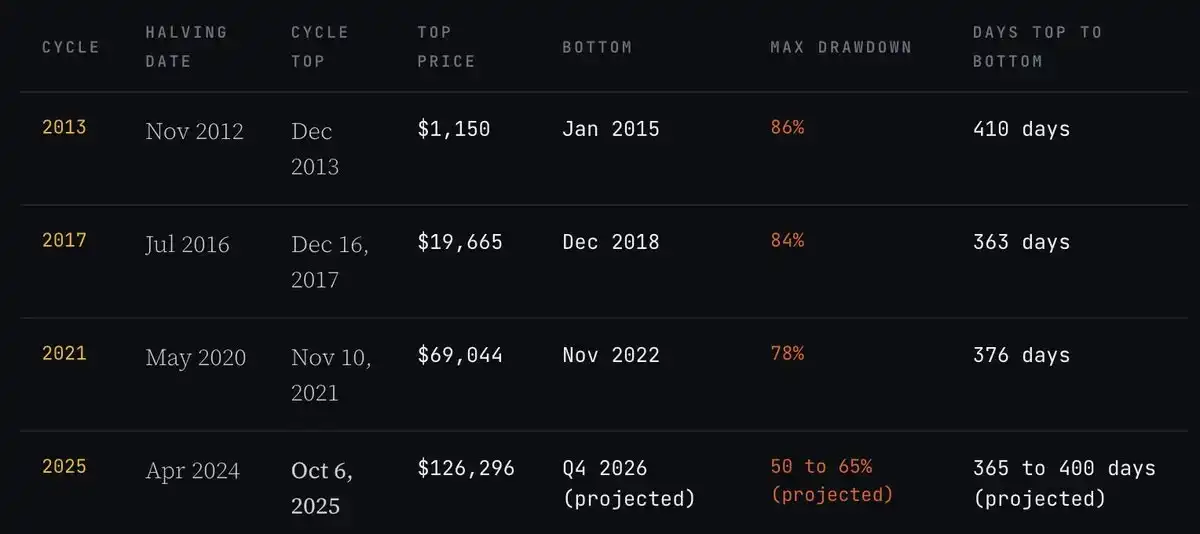
The drawdown data also shows a clear trend: 86%, 84%, 78%, and now possibly 50% to 65%. Each bear market has been shallower than the last. This is no accident. It reflects a maturing asset: it now has institutional buyers who don't panic sell, a regulated ETF market creating structural demand, and corporations holding Bitcoin as treasury reserves on their balance sheets. As the buyer base matures, volatility is being compressed.
Something else unprecedented happened this cycle: Bitcoin made a new all-time high before the halving. In March 2024, a full month before the April 20 halving, Bitcoin hit $73,581, breaking the $69,000 ATH from 2021. This was a new high, but not the cycle top. Each previous cycle ultimately peaked months after the halving, and this one was no different—the true cycle top occurred at $126,296 on October 6, 2025, well after the April 2024 halving. The difference was, making a new high *before* the halving had never happened before. The reason was the approval of spot Bitcoin ETFs in January 2024, which pulled institutional demand into the market ahead of the halving, front-running the cycle in time, which confused many tracking the usual post-halving timing.
What Happened to Retail This Cycle?
To understand why Bitcoin peaked without any of the usual signals, you have to understand what happened to retail money in the 18 months leading up to the top. In short: most of it was already gone before Bitcoin reached $126,000.
In previous Bitcoin bull markets, retail played a specific role. They provided the final fuel, creating the final party and the parabolic blow-off. It was retail FOMO that pushed Bitcoin from a sensible price to an extreme one in the final stage of each cycle. This was also why top indicators triggered—those tools were originally designed to measure retail behavior, not institutional behavior. Without retail mania, there's no trigger.
In this cycle, retail never arrived in Bitcoin at scale. Not because they weren't in crypto; they were, but they got cleaned out elsewhere first.
The Memecoin Liquidity Trap
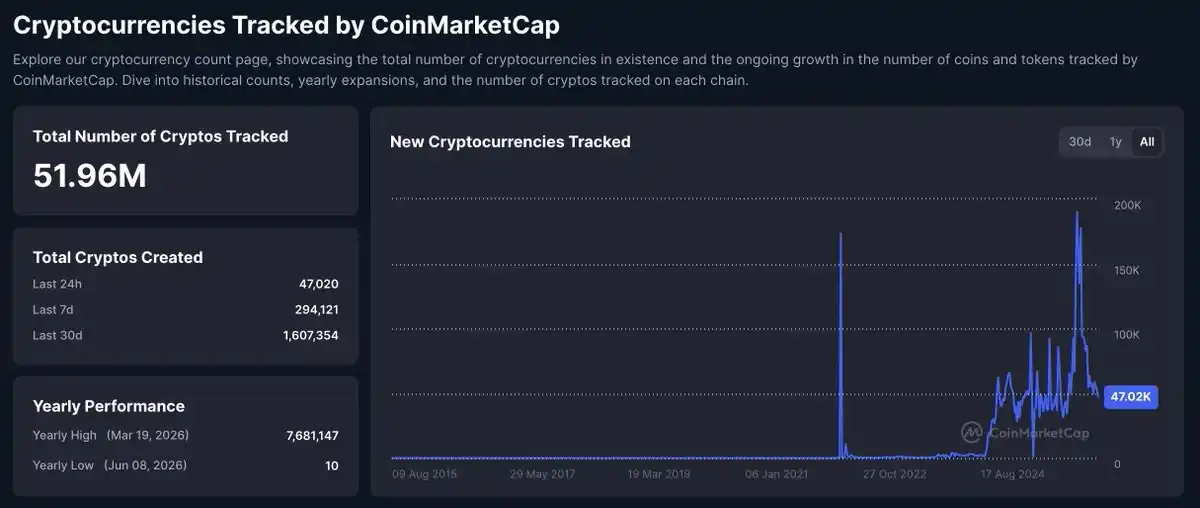
The single biggest factor destroying retail liquidity this cycle was the radical ease of creating and launching memecoins. Token launch platforms (especially on Solana) allowed anyone to launch a token in minutes for near-zero cost. By mid-2025, the number of tokens had exploded from around 10,000–20,000 at the 2021 peak to over 10 million.
Think about what this meant for a retail investor trying to navigate this market. In 2021, you had maybe 200 tokens worth serious consideration—real projects with users, revenue, or at least a credible team and product roadmap. The path from "I want to invest in crypto" to "I bought ETH and SOL" was short and obvious. That's where retail money concentrated, and why ETH went to $4,800 and SOL to $260.
But in 2025, you had 10 million options. The vast majority of these tokens were created for one purpose only: to extract money from retail buyers as fast as possible and transfer it to insiders. The mechanics were not complex: create a token, artificially generate hype, dump as retail buys in, cash out. This play repeated thousands of times a day across the ecosystem.
The 2021 retail investor had a manageable number of options, mostly legitimate projects. The 2025 retail investor had millions of options, the vast majority structured to drain their funds. The result was predictable: retail money entered crypto in 2025, but most of it never made it to Bitcoin or quality altcoins; it got sucked dry by the memecoin apparatus first.
The involvement of influential public figures amplified this problem. Numerous high-profile individuals from politics, entertainment, and social media launched their own memecoins this cycle. The pattern was the same every time: a token with a celebrity's name launched amid massive hype, retail bought expecting a fame-fueled pump, insiders and early holders dumped on the spike. The token collapsed 80% to 95% within days or weeks. Retail was left with worthless tokens worth a fraction of their buy-in.
This happened over and over again throughout 2024 and 2025. Each time, a chunk of retail liquidity in the ecosystem was permanently erased. People who lost money in these projects didn't turn their remaining funds to Bitcoin; they either left the market entirely or had no capital left to deploy.
High-FDV, Low-Float VC Tokens
The second major factor destroying retail money was the launch structure of new tokens this cycle. This is talked about less, but was equally destructive.
In 2021, new crypto projects typically launched with a Fully Diluted Valuation (FDV) of $100 million to $1 billion. This left real upside for public market buyers. A project launching at a $200 million FDV growing to $2 billion gave a 10x return for retail investors. This is the memory of 2021—stories of "I bought this token early and turned $5k into $50k".
In this cycle, the structure changed completely. Venture capital firms raised tens of billions in 2021–2022 to invest in crypto infrastructure. By 2024–2025, their portfolio companies were ready to launch tokens, and the VCs needed to show returns to their Limited Partners (LPs). So, projects began launching with $5 billion, $10 billion, even $20 billion FDVs, with only 5% to 15% of the supply actually circulating on day one.
What this meant in practice: Retail sees a token trading at what looks like a $500 million market cap, thinking there's room to run. The real FDV at that price is $10 billion, with 85% of the tokens sitting in VC wallets, unlocking over the next two to four years. Every month, more tokens unlock and are sold. Price faces a structural ceiling because supply pressure never stops. Retail buyers are effectively buying into a continuous sell-off they aren't aware of.
An independent study tracking 118 tokens launched in 2025 found that 84.7% traded below their launch valuation, with a median price decline of 71%. These weren't obscure projects; many were listed on major exchanges with large marketing budgets and media coverage. They still lost most of their value because their tokenomics were designed to benefit insiders at the expense of the public buyer.
The combined effect of memecoins and high-FDV VC launches: retail crypto money was destroyed at scale before Bitcoin ever got close to its cycle top. By October 2025, most retail participants who entered the market in 2024 were either significantly down or completely out. There was no remaining liquidity to rotate into Bitcoin. There was no FOMO wave. The fuel that pushes the final blow-off top was gone.
Where Was Retail Money Supposed to Go?
The 2021 cycle worked because retail money had a clear path: buy Bitcoin → Bitcoin pumps → rotate into large-cap alts → large-caps pump → rotate into mid-caps → mid-caps pump → rotate into small-caps. Money cascaded down a predictable market-cap ladder, generating returns at each level.
But in 2025, that cascade never started. The mass retail buying of Bitcoin never happened; their capital was already spent. Bitcoin dominance stayed above 60% for almost the entire bull run. The Altcoin Season Index peaked at about 78% for roughly three weeks in September 2025, then immediately crashed. There was only a brief window where alts outperformed Bitcoin, before dominance quickly recovered above 60%.
The anticipated altseason never arrived not because the market got it wrong, but because the mechanism that generates altseason—retail money rotating down the market-cap ladder—failed. The money was already drained.
How Institutions Changed the Structure of the Entire Cycle
While retail was losing money on memecoins and VC launches, something entirely new was happening with Bitcoin. For the first time in the asset's history, there was a regulated institutional product funneling tens of billions of dollars into Bitcoin on a structured, ongoing schedule.
The approval of spot Bitcoin ETFs in January 2024 wasn't just a headline. It fundamentally changed Bitcoin's marginal buyer profile, and that change set off a chain reaction that made everything about this cycle different.
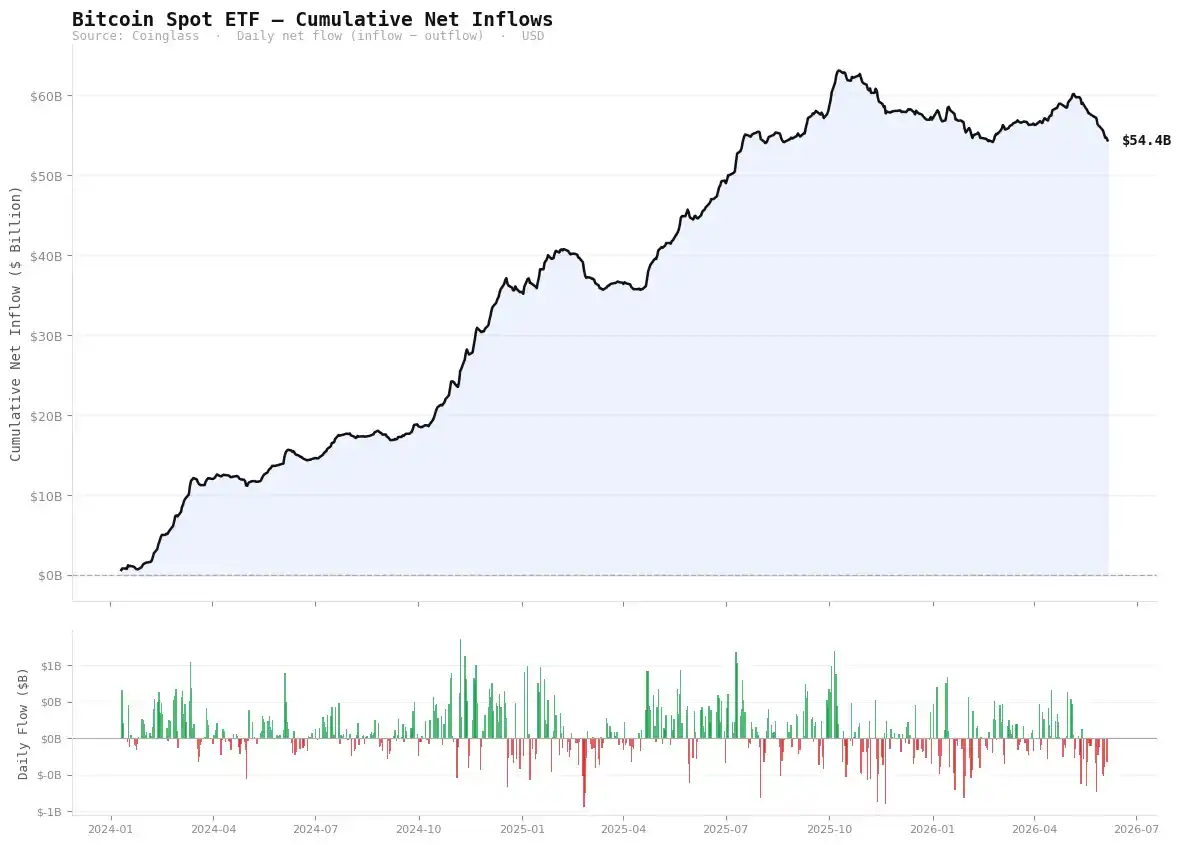
Spot Bitcoin ETF cumulative net inflows peaked at $63.1 billion in October 2025 and currently sit at $54.4 billion (Source: Coinglass).
From January 2024 to October 2025, spot Bitcoin ETFs accumulated $63 billion in net inflows. At peak, daily inflows exceeded $350 million—8 to 9 times the daily value of newly mined Bitcoin. On the biggest inflow days, over $1 billion entered in a single trading session.
These weren't retail investors. They were pension funds, registered investment advisors, family offices, endowments, and hedge funds making asset allocation decisions on a quarterly rhythm. They don't check Bitcoin prices at 2 AM. They don't FOMO over a green candle on X (Twitter). They get an allocation mandate and execute systematically over weeks to months.
When this type of buyer dominates the market, price action looks nothing like a retail-driven market. You don't see long consolidations followed by explosive vertical pumps; you see a slow, grinding ascent. You don't get parabolic weekly candles; you get a steady uptrend that looks unexciting but builds massive gains over time.
Bitcoin went from $40,000 in January 2024 to $126,000 in October 2025—a 215% gain. In any prior cycle, a move of that magnitude would have included weeks of 30% or 40% gains. But in this cycle, weekly gains were modest by historical standards. The total gain was huge, but it arrived in a way that felt orderly, even boring, not explosive.
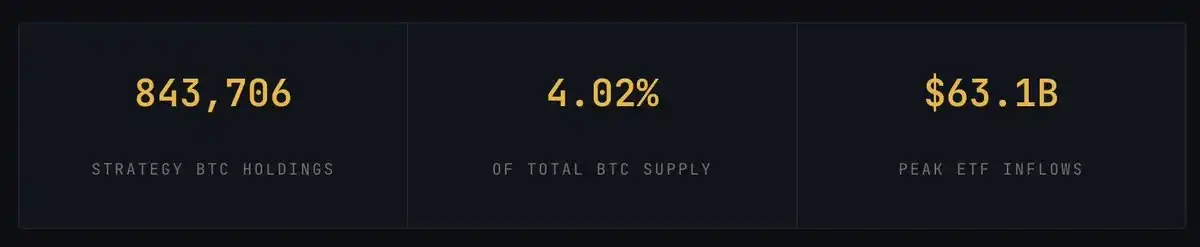
MicroStrategy holds 845,256 BTC, 4.02% of the total Bitcoin supply, accumulated through continuous corporate treasury purchases.
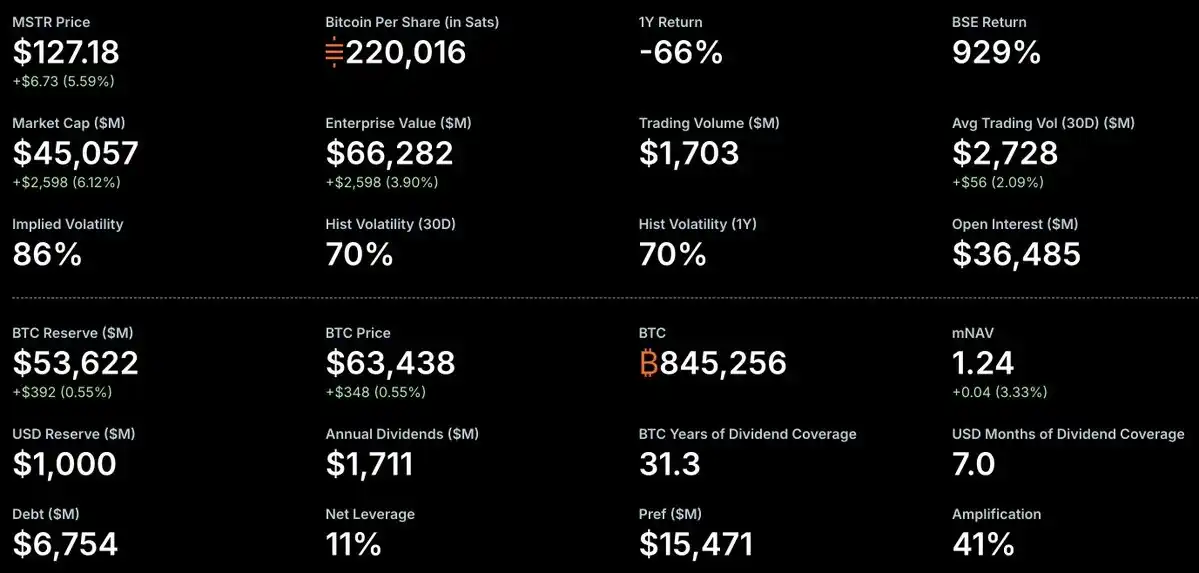
Then there's MicroStrategy. Their model is the most extreme version of institutional buying that defined this cycle. They turned an entire corporate treasury strategy into a Bitcoin-hoarding machine, raising capital through equity and preferred offerings, then deploying it directly into Bitcoin purchases. As of June 2026, they hold 843,706 Bitcoin, 4.02% of the eventual total supply.
In 2025 alone, they raised $25.3 billion through capital markets to buy Bitcoin. They don't sell, they don't hedge. They accumulate constantly, week after week, regardless of price. This is structural buying that simply didn't exist in prior cycles.
The key thing to understand about this institutional structure is what it did to on-chain data. When BlackRock buys Bitcoin for its IBIT ETF, those coins move to Coinbase Prime for custody, becoming nearly invisible to on-chain analysis, not trackable like retail activity. ETF purchases don't show up on-chain as coins changing hands the way retail trades do. MicroStrategy's Bitcoin accumulation via equity issuance shows up in SEC filings, not on-chain. For every dollar of demand, there was less on-chain activity than in any prior cycle.
This is the core technical reason every top indicator failed. These metrics measure on-chain activity, coin movement, and realized profit behavior—they work under the premise that retail is the dominant buyer. When the dominant buyer operates through off-chain custodians and registered financial products, these metrics stay eerily calm even as tens of billions flow into the asset. The math of the indicators isn't wrong; they're just measuring the wrong thing.
Why All Eight Top Indicators Failed
These indicators had a near-perfect track record. In 2013, 2017, and 2021, they all signaled a top within days or weeks of the actual peak. Analysts obsessed over them throughout 2025, waiting for the signal. Bitcoin broke $126,000, then started falling. Yet all these indicators remained calmly in neutral or accumulation zones.
It wasn't that the indicators broke. It's that the market formation they were designed to measure no longer existed. Understanding why each one failed gives more insight into current market structure than any price chart.
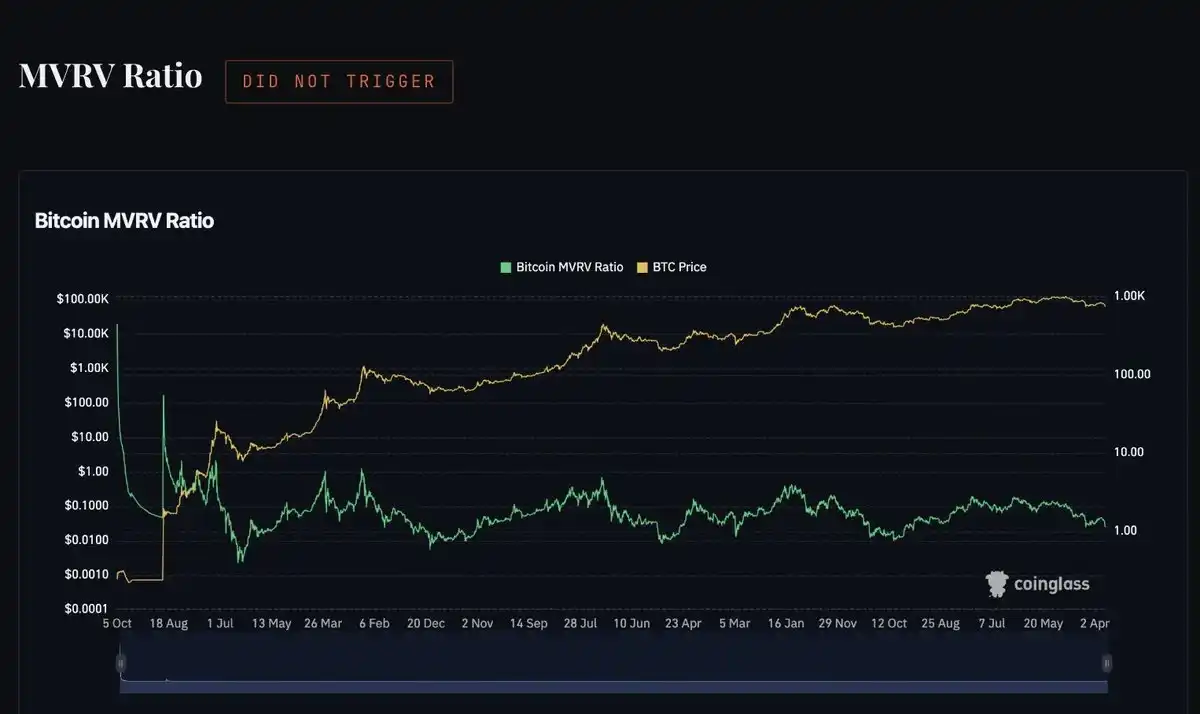
Bitcoin's MVRV Ratio: Peaked around 3.8 at the 2025 top, whereas prior cycle peaks were between 7 and 10 (Source: Coinglass).
The MVRV Ratio divides Bitcoin's market cap by its realized cap (the sum of all coins at the price they last moved on-chain). When this ratio is very high, it means the average holder is sitting on massive unrealized profits, which historically aligns with peak speculation. At the 2013 top, the ratio exceeded 10; in 2017, it neared 8; in 2021, it reached 7. The recognized danger threshold is above 7.
At the October 2025 peak, MVRV only reached about 3.8 to 4.2. At the moment of making a new all-time high, the indicator was less than half its historical warning level. The reason is market structure: ETF buyers and MicroStrategy accumulation registered as demand in Bitcoin's price but didn't move coins on-chain in the way MVRV requires for calculation. Billions in Bitcoin sat in Coinbase Prime's custody wallets on behalf of institutional clients and had never "moved" on-chain since purchase. The realized cap was artificially suppressed because the biggest buyers of the cycle operated through custodians largely invisible to on-chain measurement. So, at peak prices, MVRV showed a market that looked like it was in the middle of a cycle.
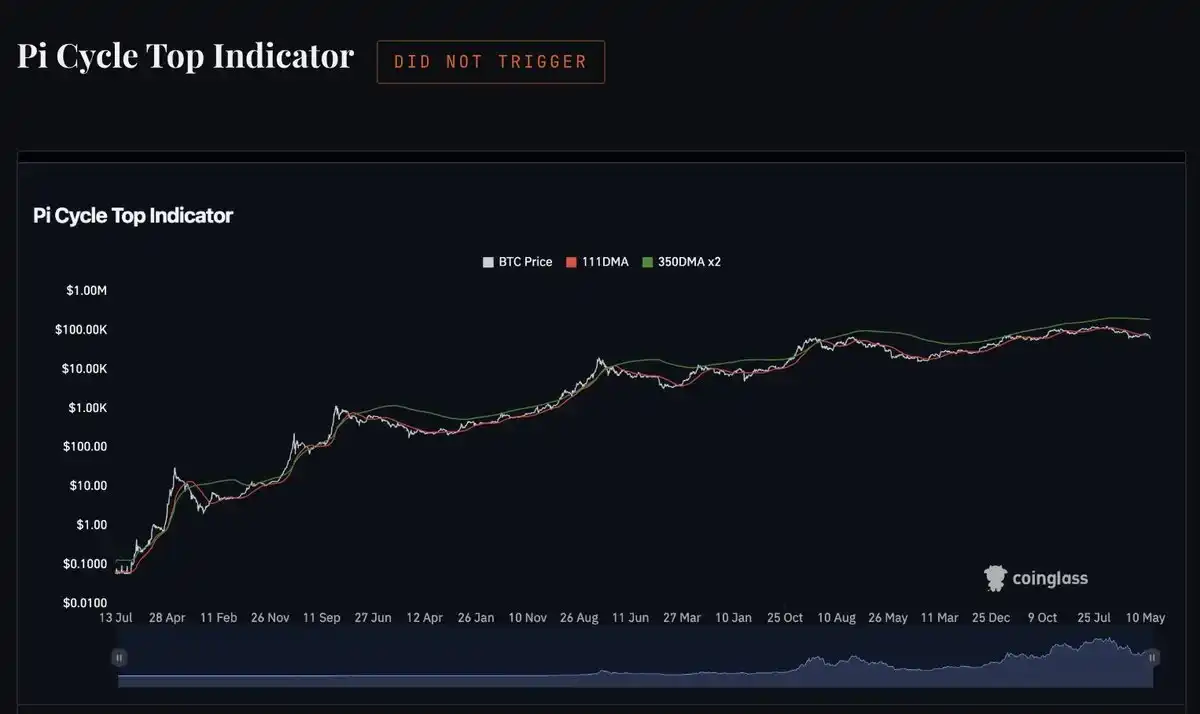
Pi Cycle Top Indicator: The 111-day moving average (DMA) never crossed above twice the 350-day moving average (350-DMA×2). At previous tops, the cross often occurred within days of the actual peak (Source: Coinglass).
The Pi Cycle indicator triggers when the 111-day moving average crosses up through twice the 350-day moving average. It was one of Bitcoin's most precise top signals in history, hitting windows within days of the actual peak in 2013, 2017, and 2021. Many analysts predicted a cross in September 2025.
It didn't happen. The lines converged and diverged again without crossing. The reason ties directly to the institutional demand logic: Pi Cycle's cross requires sharp, accelerating price gains that push the short-term average above the long-term one. Institutional buyers on quarterly allocation schedules don't produce that acceleration. They produce steady, sustained gains. Going from $40k to $126k in 20 months may match the total gain of a retail-driven parabola, but the angle of ascent is different, and that angle is what Pi Cycle measures. Because the angle to the top didn't meet the trigger condition, the indicator stayed silent even as new highs were made.
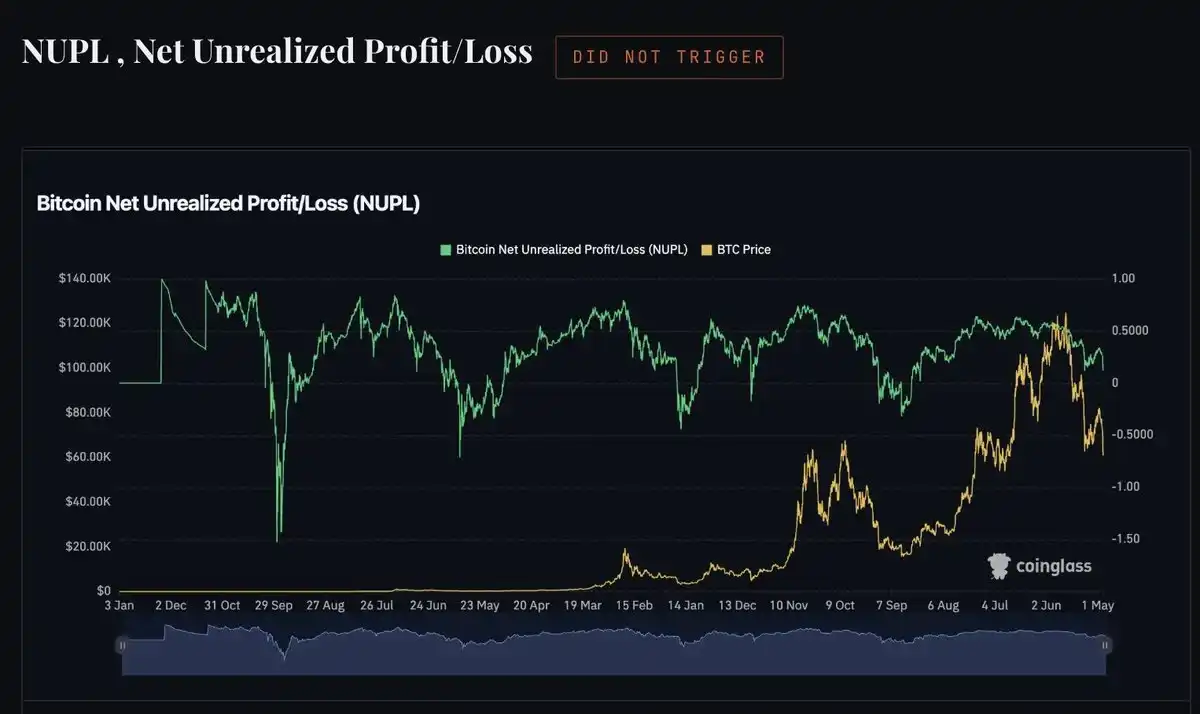
Bitcoin's NUPL: Never broke above 0.75 (Euphoria zone) at the 2025 top. Prior cycle peaks were far above this threshold (Source: Coinglass).
NUPL measures the ratio of unrealized profit to unrealized loss across the entire Bitcoin network. When the value exceeds 0.75, the market is classified as Euphoric. In this state, the vast majority of holders are sitting on massive profits, and the probability of large-scale selling is high. At previous cycle tops, NUPL was deep in the Euphoria zone, in some cases nearing 1.0.
At the October 2025 top, NUPL peaked only around 0.60 to 0.65. The indicator showed a market in the Belief phase, confident but not euphoric, and for the holders it could measure, this reading was accurate. Long-term Bitcoin holders who accumulated in 2022–2023 were highly disciplined. They weren't the panic-profit-taking cohort needed for euphoric readings. And the retail participants who should have pushed NUPL into danger weren't in Bitcoin; they were in memecoins. NUPL accurately described the state of the on-chain holders it could measure; it just couldn't see the $63 billion sitting in ETF custody.
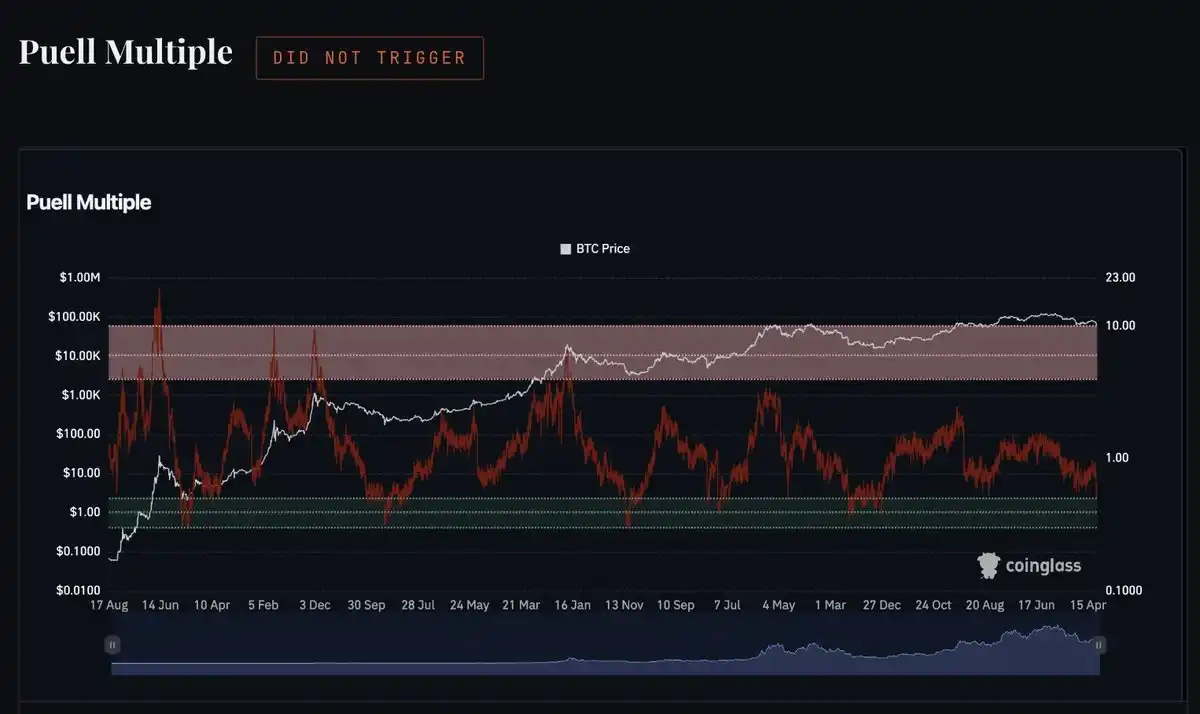
Puell Multiple: Stayed near 1.0 throughout the 2025 bull market. Historical peak readings were 3.4, 6.6, and 10.48 (Source: Coinglass).
The Bitcoin Puell Multiple compares miners' daily revenue to its 365-day average. When miners earn far more than their yearly average (usually due to a price spike), they sell aggressively to lock in profits, creating supply pressure that historically marks cycle tops. Readings at previous tops: 10.48 in 2013, 6.6 in 2017, 3.4 in 2021. This trend itself had been declining each cycle.
In 2025, due to the April 2024 halving cutting block rewards from 6.25 BTC to 3.125 BTC, miner revenue per block was already structurally lower than prior cycles. While Bitcoin's price doubled, the halving cut the number of coins miners received. Thus, the Puell Multiple barely exceeded 1.0. Beyond the halving math, the nature of modern mining is different from 2013 or 2017. Large public miners hedge, have institutional-grade treasury management, and don't need to dump coins at price peaks like early miners did. This indicator was tailor-made for a mining industry that no longer exists in the same form, and its utility diminishes with each halving.
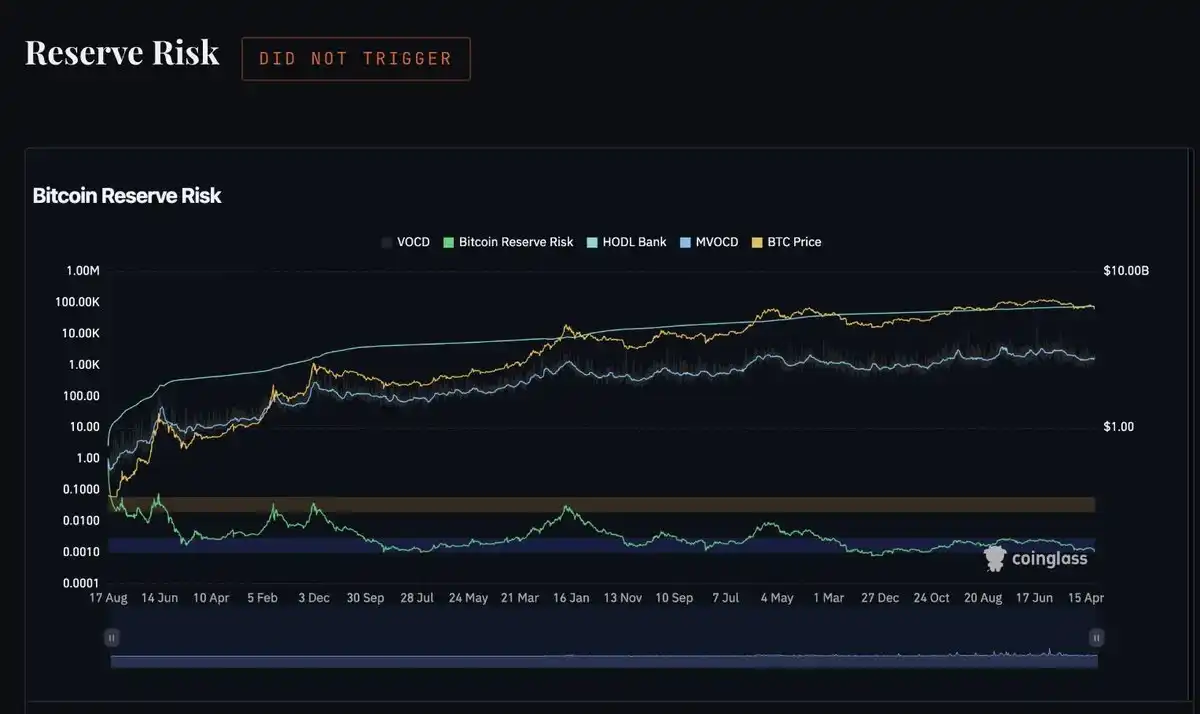
Bitcoin's Reserve Risk: Remained deep in the Accumulation zone throughout the 2025 bull market. Never approached orange or red zones (Source: Coinglass).
Reserve Risk measures the conviction of long-term holders relative to the current price. When a long-term holder decides to sell after holding for a period, the opportunity cost of holding (the HODL bank) is released. When many long-term holders capitulate at high prices, Reserve Risk spikes into danger zones. At previous cycle tops, this indicator entered orange and red zones as long-term holders finally yielded to profit-taking.
In 2025, Reserve Risk stayed deep in Accumulation throughout the bull market. Long-term holders simply didn't sell at a scale sufficient to move the indicator. This is the most direct fingerprint of the institutional era: the largest holders—from ETF custody, MicroStrategy, and disciplined retail survivors of the 2022 bear—held steadfast through the entire run-up. They aren't impulsive sellers, so they didn't push Reserve Risk into the red. The indicator measured their behavior accurately. It's just that their behavior was incredibly rational and disciplined at price levels where history suggested massive capitulation should occur.
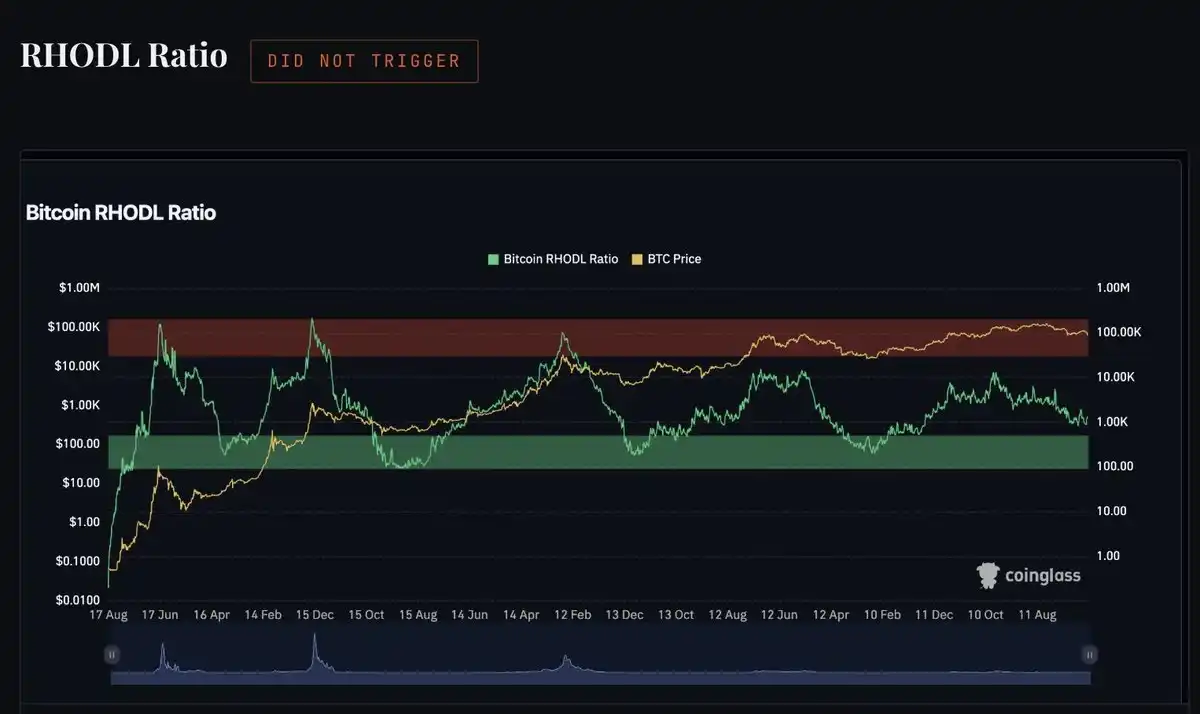
Bitcoin's RHODL Ratio: Rose from lows but never entered the historical red bands typically associated with cycle tops (Source: Coinglass).
The RHODL Ratio compares the realized wealth of coins that moved in the past week to coins that haven't moved in 1–2 years. A high ratio means the market is dominated by fresh capital—new buyers who entered at high prices. This is the signature of a blow-off top: late-stage retail money flooding in at the peak. At every previous cycle top, this indicator entered the red zone as new entrants poured into the market in the final weeks.
In 2025, RHODL rose from bear market lows but never entered the red band. The fresh capital that would have pushed this indicator to extremes wasn't in Bitcoin; it was in memecoins. The retail FOMO that RHODL measures was displaced to an entirely different part of the crypto market and evaporated there, not in Bitcoin. RHODL accurately described the situation: at the top, new retail money was not dominating the Bitcoin market. The indicator just didn't know that because no equivalent tool existed to measure where that retail money actually went.
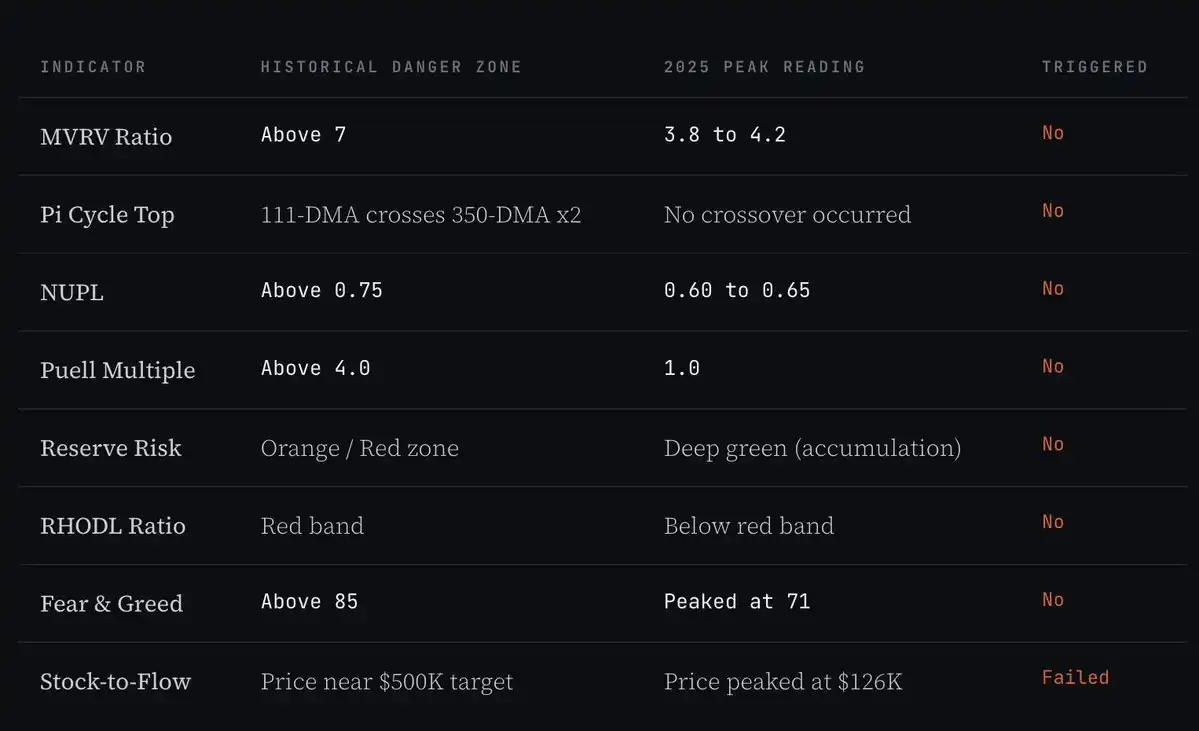
Looking at the performance of these eight indicators at a cycle top, the conclusion isn't that the indicators malfunctioned. It's that they correctly measured a market that no longer has the retail-dominated structure they were built for. All these tools were designed in an era when Bitcoin's price was driven almost entirely by retail speculation. They were calibrated to detect retail euphoria. This cycle, retail euphoria didn't happen in Bitcoin. The tools accurately reported that fact. The only mistake was assuming that the typical retail blow-off was the only way a cycle could top.
The cycle topped anyway. It just did so institutionally—slowly, without fireworks, and without setting off any alarms.
Nothing Worked Except the Cycle Itself
Surveying all the available indicators for this cycle leads to an honest conclusion: almost none of them gave a reliable top signal.
On-chain indicators collectively failed: MVRV, Pi Cycle, NUPL, Puell, Reserve Risk, and RHODL all failed to enter danger zones at the high. Key macro indicators many analysts watched—global M2 money supply and the Dollar Index (DXY)—broke down in ways that felt untrustworthy. Global M2 kept rising after Bitcoin topped in October 2025, meaning the correlation failed precisely when it should have worked. The DXY correlation? Despite DXY having one of its worst annual performances in decades in 2025 (down ~11–12%), which should have been a tailwind, not a headwind, Bitcoin still finished 2025 with negative returns. The correlation broke in both directions.
What did trigger? The 4-year cycle timing itself. If you simply circled October 2025 on a calendar—one year post-halving, aligning with the 2013, 2017, and 2021 peak timing patterns—you were right. This wasn't based on any sophisticated analysis of on-chain data or macro correlations; it was because the cycle's clock struck on time.
This is the uncomfortable conclusion this cycle forces upon us. None of the tools we built to identify tops, the macro correlations we trusted, the sentiment indicators we obsessively monitored were triggered. The only thing that worked was the simplest thing: the 4-year halving cycle timing that has held in every cycle since 2012.
What will drive the next cycle? No one can be sure. In 2020, people expected institutional buying or the halving itself to drive the rally. What actually happened was a global pandemic, trillions in money printing, and a risk-asset frenzy no one predicted. The specific catalyst for the 2028–2029 cycle could be anything: an AI bubble bursting sending liquidity back into crypto, new US crypto regulation unlocking institutional capital, a Fed pivot due to recession, or something no one is thinking about yet. Trying to predict the specific cause may be futile. What history tells us is that the cycle will persist. Its mechanics will just surprise everyone.
Currently in a Mid-Bear Market, No Bottom Yet
Bitcoin currently trades between $62,000 and $63,000. This is about 50% lower than the $126,296 all-time high from October 2025. The current market structure fits the profile of a mid-bear market—not at a bottom, but not in free fall either.
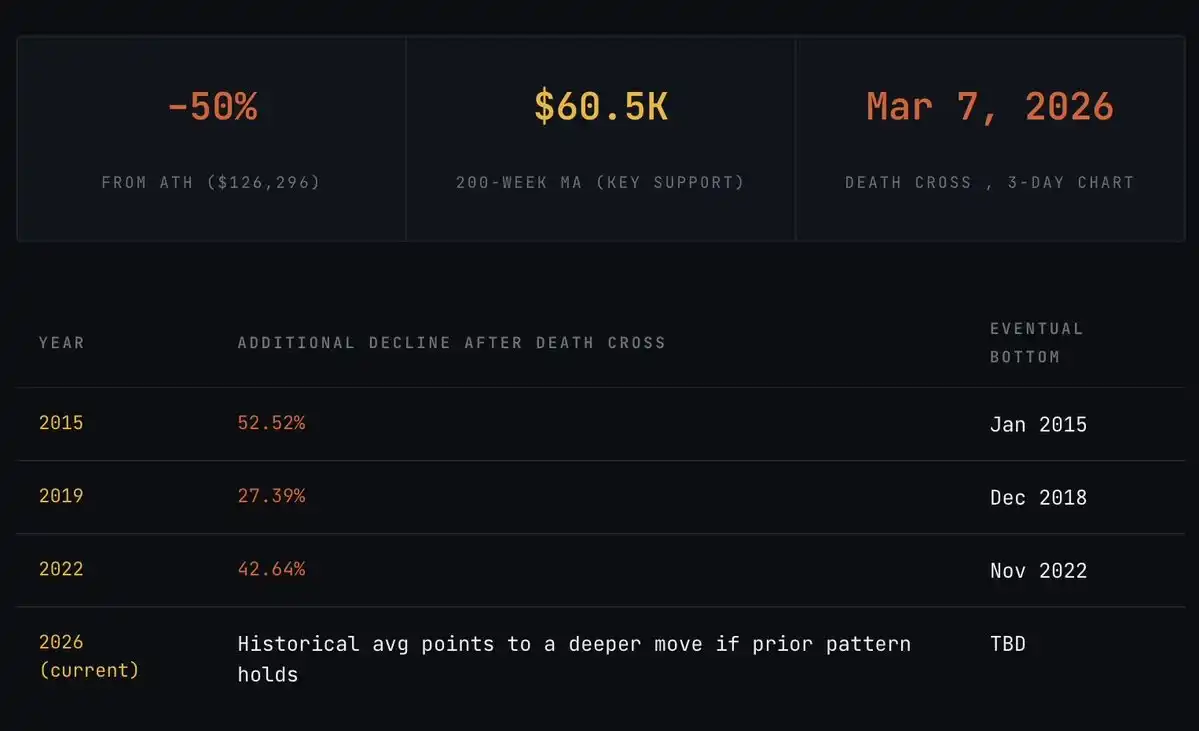
The structurally most important level right now is the 200-week exponential moving average (EMA 200), around $68,832 on the weekly chart. In every previous bear market, Bitcoin found its bottom support at or near this level. The 2015 and 2022 bears saw Bitcoin consolidate around the weekly 200 EMA before starting the next bull run. The 200-week MA isn't a precise bottom signal; it's a zone. Historically, Bitcoin has dipped slightly below it before reversing, testing market resolve before the next accumulation phase begins.
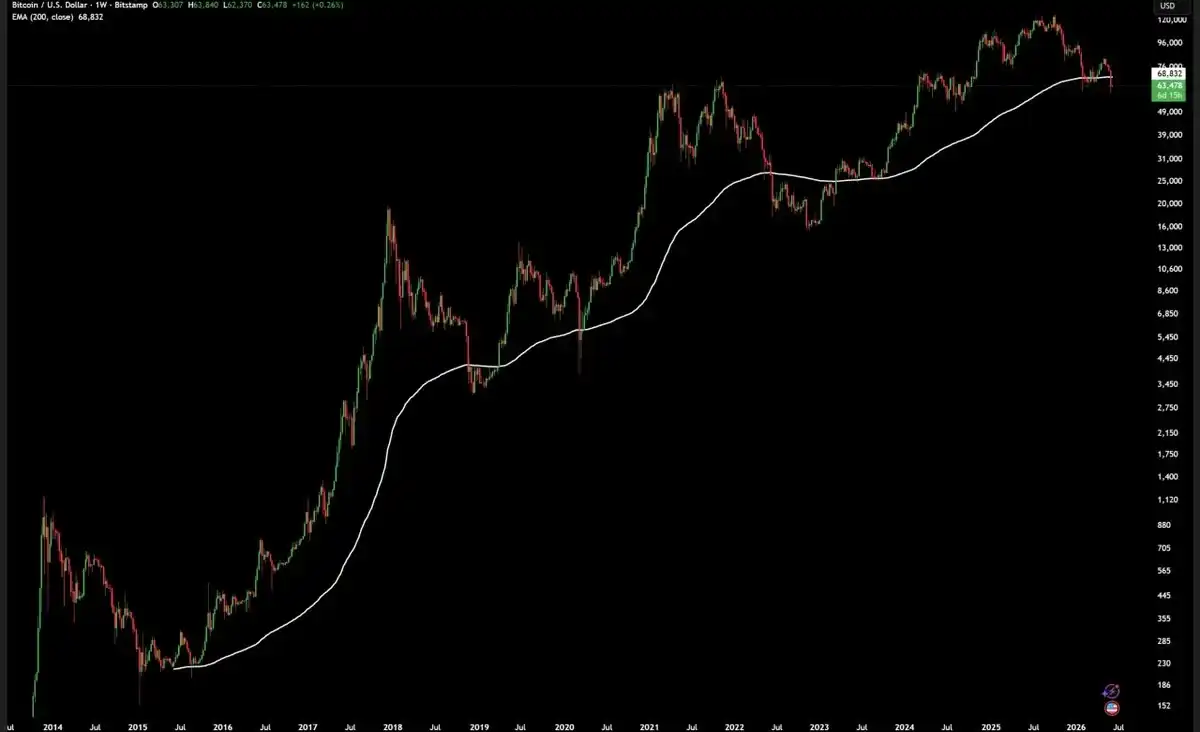
Bitcoin weekly chart with 200 EMA: Every bear market cycle found support at or near this level before launching the next bull run (Source: Bitstamp).
On March 7, 2026, Bitcoin's 3-day chart printed a death cross. This is the same signal that preceded major declines in 2014, 2018, and 2022. Looking at Bitcoin's decline after each previous 3-day death cross:
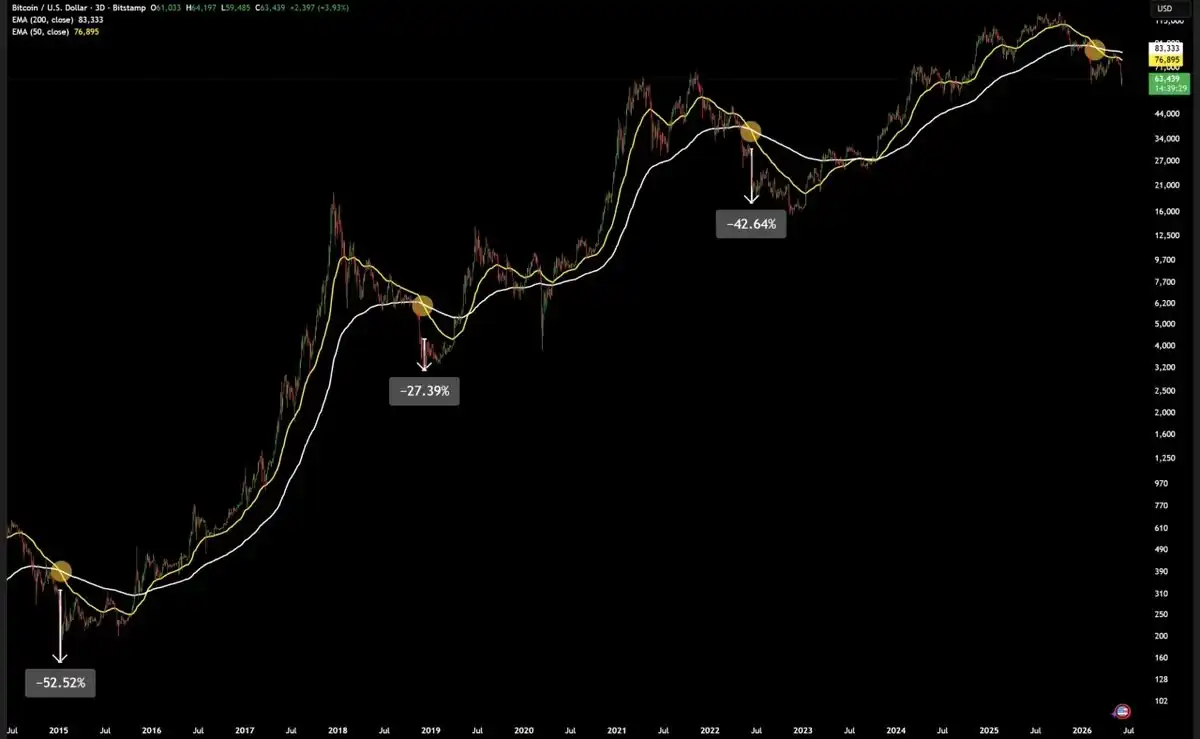
Bitcoin 3-day chart: On March 7, 2026, EMA 50 crossed below EMA 200 (death cross). Previous death crosses led to declines of 27%, 43%, and 53% from the cross point (Source: Bitstamp).
The pessimistic forecast is, if the 200-week MA fails to hold and the historical average death cross decline applies, price could target $33,000–$35,000. This is the number to keep in mind for a downside scenario.
The baseline scenario is, given the trend of shallower drawdowns across cycles and the existence of institutional buying support not present in past bears, the bottom may be in the $45,000–$55,000 range. Timing-wise, applying the historical top-to-bottom rhythm, the bottom points to Q3–Q4 2026, specifically October–November 2026, roughly one year from the peak.
What a confirmed bottom looks like: Bitcoin holds the 200-week MA for three or more consecutive weekly closes. ETF outflows stabilize after a period of sustained withdrawals. The Fear & Greed Index recovers from below 15 and holds above 25 for at least two weeks. When these conditions are met together—not just a single price level—it marks that the accumulation phase has begun.
Bottoming in 2026, Topping in 2029?
Once the current bear phase concludes, the cycle framework points to the following sequence:
Q3–Q4 2026: Bitcoin bottom. The 200-week MA and the realized price around $54,000 form a support band. Historically, this is the best accumulation zone of any cycle—a period of extreme pessimism before the next expansion begins. This is also when most retail investors who entered near the top give up and sell, transferring coins at a discount to long-term holders.
2026–2027: Accumulation phase. Price action is sideways, boring, and choppy. No major headlines, no momentum. This stage feels like nothing is happening, which is why most people miss it. Every prior cycle had an identical phase between the bear market bottom and the launch of the next bull run.
April 2028: Next halving. Block rewards drop from 3.125 BTC to 1.5625 BTC. Miner selling pressure halves again. Institutional demand from the ETF complex (now much larger than today) begins digesting the supply shock. Bitcoin builds momentum.
2028–2029: Post-halving expansion. If the 4-year cycle still holds, this is the next major bull market. Based on consistent timing patterns, a 2029 peak is most likely in Q3 or Q4 of that year.
An important point: The 2025 cycle showed that the type of blow-off top that drove prior cycle peaks may not happen the same way again. As Bitcoin's share owned by institutions grows and retail participation becomes a smaller fraction of total demand, tops may still arrive without extreme indicator readings, without parabolic price action, and without the clear, easily identifiable-in-hindsight cycle top signals of the past. Cashing out at the next top will require relying on different tools than those that worked in 2021.
Conclusion
Bitcoin's 4-year cycle is not broken. The top arrived on schedule, at the right point in the halving cycle timeline, with price exceeding the prior high and making a new all-time high. The cycle operated exactly as expected.
What broke were the tools people used to identify the top. Every classic on-chain indicator failed because every classic on-chain indicator measures retail behavior, and retail wasn't in Bitcoin. Retail capital was systematically drained via memecoins, celebrity launches, and high-FDV VC token structures before it could reach Bitcoin. By October 2025, the retail fuel that drives blow-off tops and triggers euphoric indicators was gone.
The institutional buyers that replaced retail—ETFs, MicroStrategy, professional asset allocators—produced a 215% rally from the 2024 low to the peak, but they did it without parabolic candles and without triggering any alarms. Indicators showed calm, yet the market still topped.
The only thing that truly worked was the cycle's timing itself. October 2025, roughly 535 days after the April 2024 halving, roughly a year before the pattern suggests a cycle bottom, fit the historical timing pattern almost perfectly. Not because of complex indicator analysis, but because the same four-year structure that has held since 2012 validated itself once again.
Bitcoin is now in the bear market phase consistent with all prior cycle peaks. The 200-week EMA is the structural reference level that has supported every previous bear market bottom. What comes next will follow the cycle's schedule. The specific catalysts, the exact character of the move, whether old indicators will finally trigger—these are unpredictable. The timing pattern is the only signal that has never been wrong.