

Mr. rai crypto
02/10 16:35
Solana’s make-or-break moments Why $190, $199
Solana’s make-or-break moments
Why $190, $199 Matters for SOL
Solana [SOL] is no stranger to volatility, and keeping an eye on open interest can provide a roadmap for navigating these wild price swings.
The open interest heat map for the last 3 days reveals two key levels: $190 and $199. These levels are emerging as key levels, with $190 acting as strong support and $199 evolving into a potential pivot area.
A closer look at how these areas affect SOL's short-term price action can help traders spot the next big move.
Solana: Key levels revealed
Solana’s open interest heat map for the past three days highlights two key levels that traders should pay close attention to. The $190 level has emerged as a strong support area, characterized by a high concentration of open interest activity.
This level has been attracting buyers, preventing prices from falling further.
On the bright side, $199 initially acted as a strong resistance level, with the OI cluster indicating increasing sell orders. The data shows repeated rejections near this level, indicating an ongoing battle between bulls and bears.
However, with SOL’s recent break above $199, this level may now transform into a support area, depending on the strength of the breakout and subsequent trading volume.
OI strength between $190 and $199 suggests that any breakout could lead to significant price moves.
During the $199 test, OI trading volume peaked at nearly $40 million, and market watchers should be on the lookout for potential liquidity changes that could signal Solana's next directional move.
potential market reaction
The $190 level is emerging as a strong support area, supported by massive OI accumulation. This clustering of OI indicates increased buying activity, which traders view as a key entry point.
Historically, Solana has shown strong rebounds from similar levels, suggesting a rebound is possible if buyer momentum remains stable.
However, if this support fails to hold, it could trigger a retest of lower levels, which could trigger a sell-off in leveraged positions.
On the other hand, the $199 level is now evolving into a pivot zone, marking a critical point for traders. Initially acting as resistance, a break above this level indicates that bullish momentum may be taking hold.
If $199 holds support, it could serve as a launching pad towards $205 or levels.
Conversely, failure to sustain this level could signal a false breakout, raising the possibility of a consolidation or pullback towards the $190 support.
Leverage OI and price data for better trading
At press time, Solana was trading at $201, breaking above previously established resistance at $199. This breakout signals underlying bullish momentum, but traders should proceed with caution.
If the breakout persists, the $199 level, which was previously a resistance zone, may now turn into support.
Using OI data, traders can monitor OI spikes at higher levels (e.g. $205) to predict further resistance zones or profit-taking zones.
Conversely, if SOL falls below $199, it could signal a false breakout, raising the possibility of a revisit of the $190 support.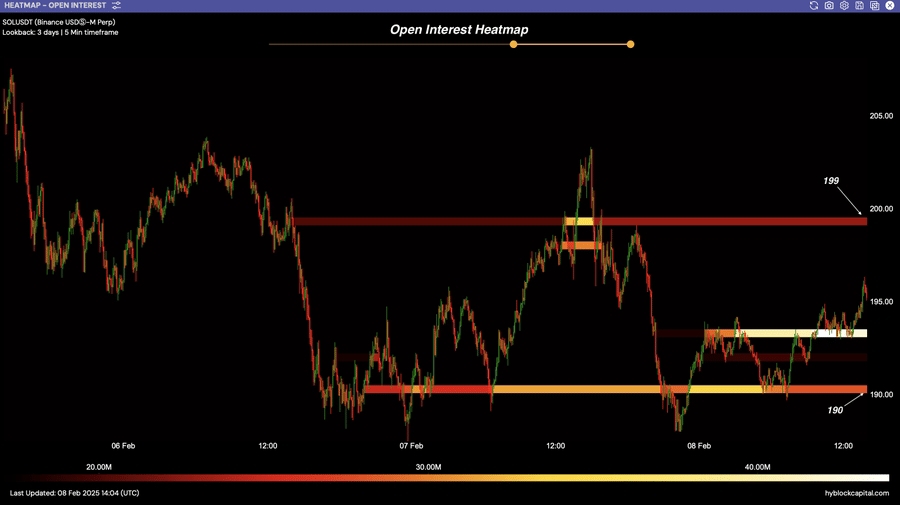
#Grab $100,000 Surprise Gifts#Share Your Thoughts on Popular Assets in March#Hit March's Interaction Leaderboard
3Поділитися
Усі коментарі0НовіПопулярно
Немає записів