Unit is %; daily gains/losses are relative to the previous trading day's close; the card for the day does not provide index point levels, so this article only mentions percentage changes, not points. Among the four major indices on September 4th, only the Russell 2000 rose 0.25%. The Dow Jones Industrial Average fell 0.51%, the largest decline among them, the S&P 500 fell 0.38%, and the Nasdaq Composite fell 0.29%, the smallest decline.
The reason for the decline is written in the same day's employment data: August non-farm payrolls increased by 162,000, while market expectations were only 55,000, and the unemployment rate remained flat at 4.1%. Strong employment is good news in itself, but at this stage it implies that money will become more expensive—the 2-year Treasury yield rose to 4.374% that day, a one-year high, and market pricing for a September rate hike once rose to about fifty percent. When the discount rate gets pushed up, the assets most immediately compressed are those with cash flows further in the future. This is also why the three indices weighted by large-cap tech stocks closed lower, while small-cap stocks, which already had low valuations and shorter duration, actually turned positive.
One thing worth remembering first: on this day, what fell in the U.S. stock market was not earnings, but the discount rate. Corporate profits did not worsen in a single day; what changed was the rate at which the market discounts future cash flows. Understanding this point is crucial to seeing why the stock that rose the most below follows a completely different logic from the broader market.
2. Star of the Day KLA Corporation (KLAC): Perfect Peer Ranking, Trend Position Only 44
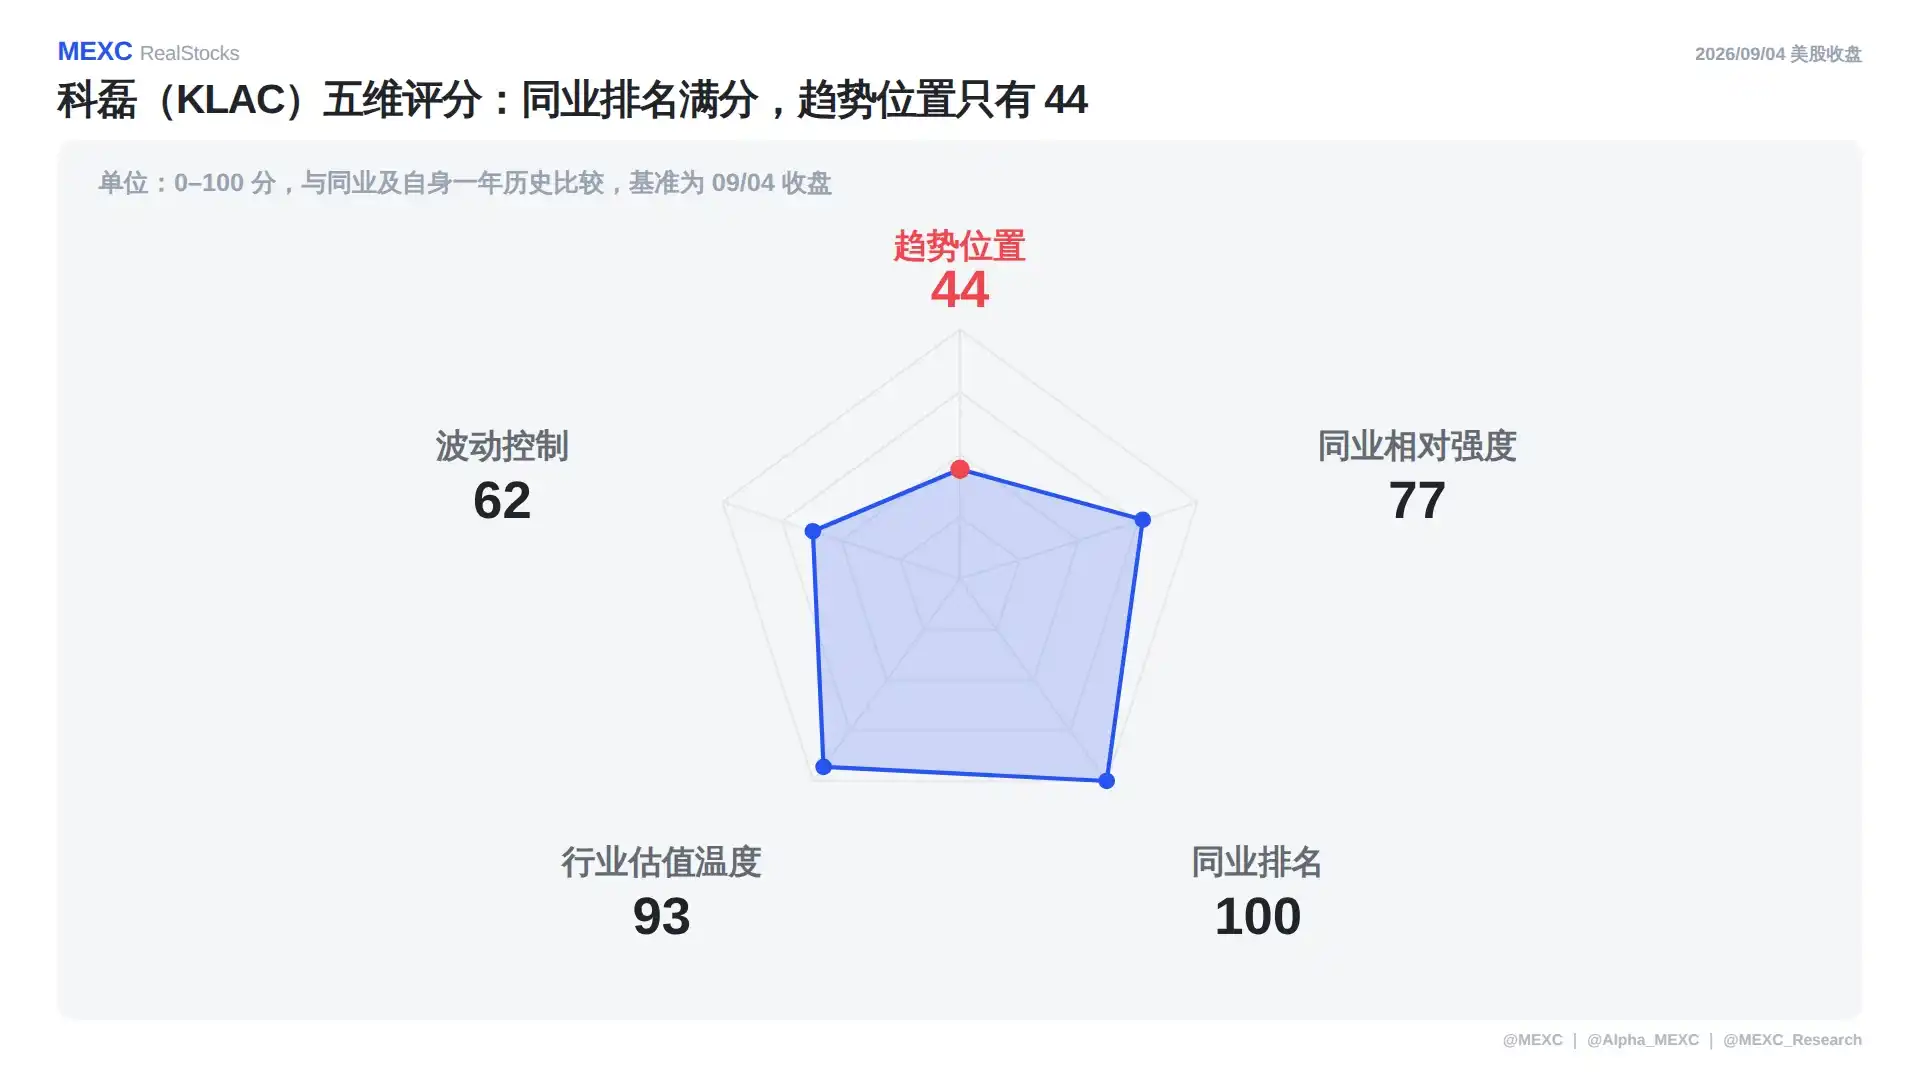
Unit is a score of 0–100, compared with peers and its own one-year history, benchmarked to the September 4th close. KLA Corporation (KLAC) closed at $185.60 that day, up 7.32%, with its market cap increasing by $16.5 billion in a day to reach $242.4 billion; trading volume was on par with its 30-day average volume, with no significant surge in volume. Among the five dimensions, it scored a perfect 100 in Peer Ranking, 93 in Industry Valuation Temperature, 77 in Peer Relative Strength, 62 in Volatility Control, while its Trend Position was only 44, the weakest point of the pentagon.
The real focus should be on this gap. A Peer Ranking of 100 means that within its peer group for that day, no one was stronger; a Trend Position of 44 means the price is still in the lower half of its own one-year range—the one-year range is $90.67 to $307.37, and $185.60 sits at the 44% position. 'Rising the most' and 'standing high' are not measuring the same thing: looking solely at +7.32% might lead one to think this is a strong stock; adding the Trend Position of 44 reveals it's a stock recovering from a lower position.
The volume column also needs to be read together. Trading volume equal to the 30-day average indicates that the price movement wasn't driven by a sudden influx of new capital, but rather the same pool of money shifting positions—it's a repricing, not a volume breakout.
Same Supply Chain, Money Flows Upstream, Downstream Gets Sold
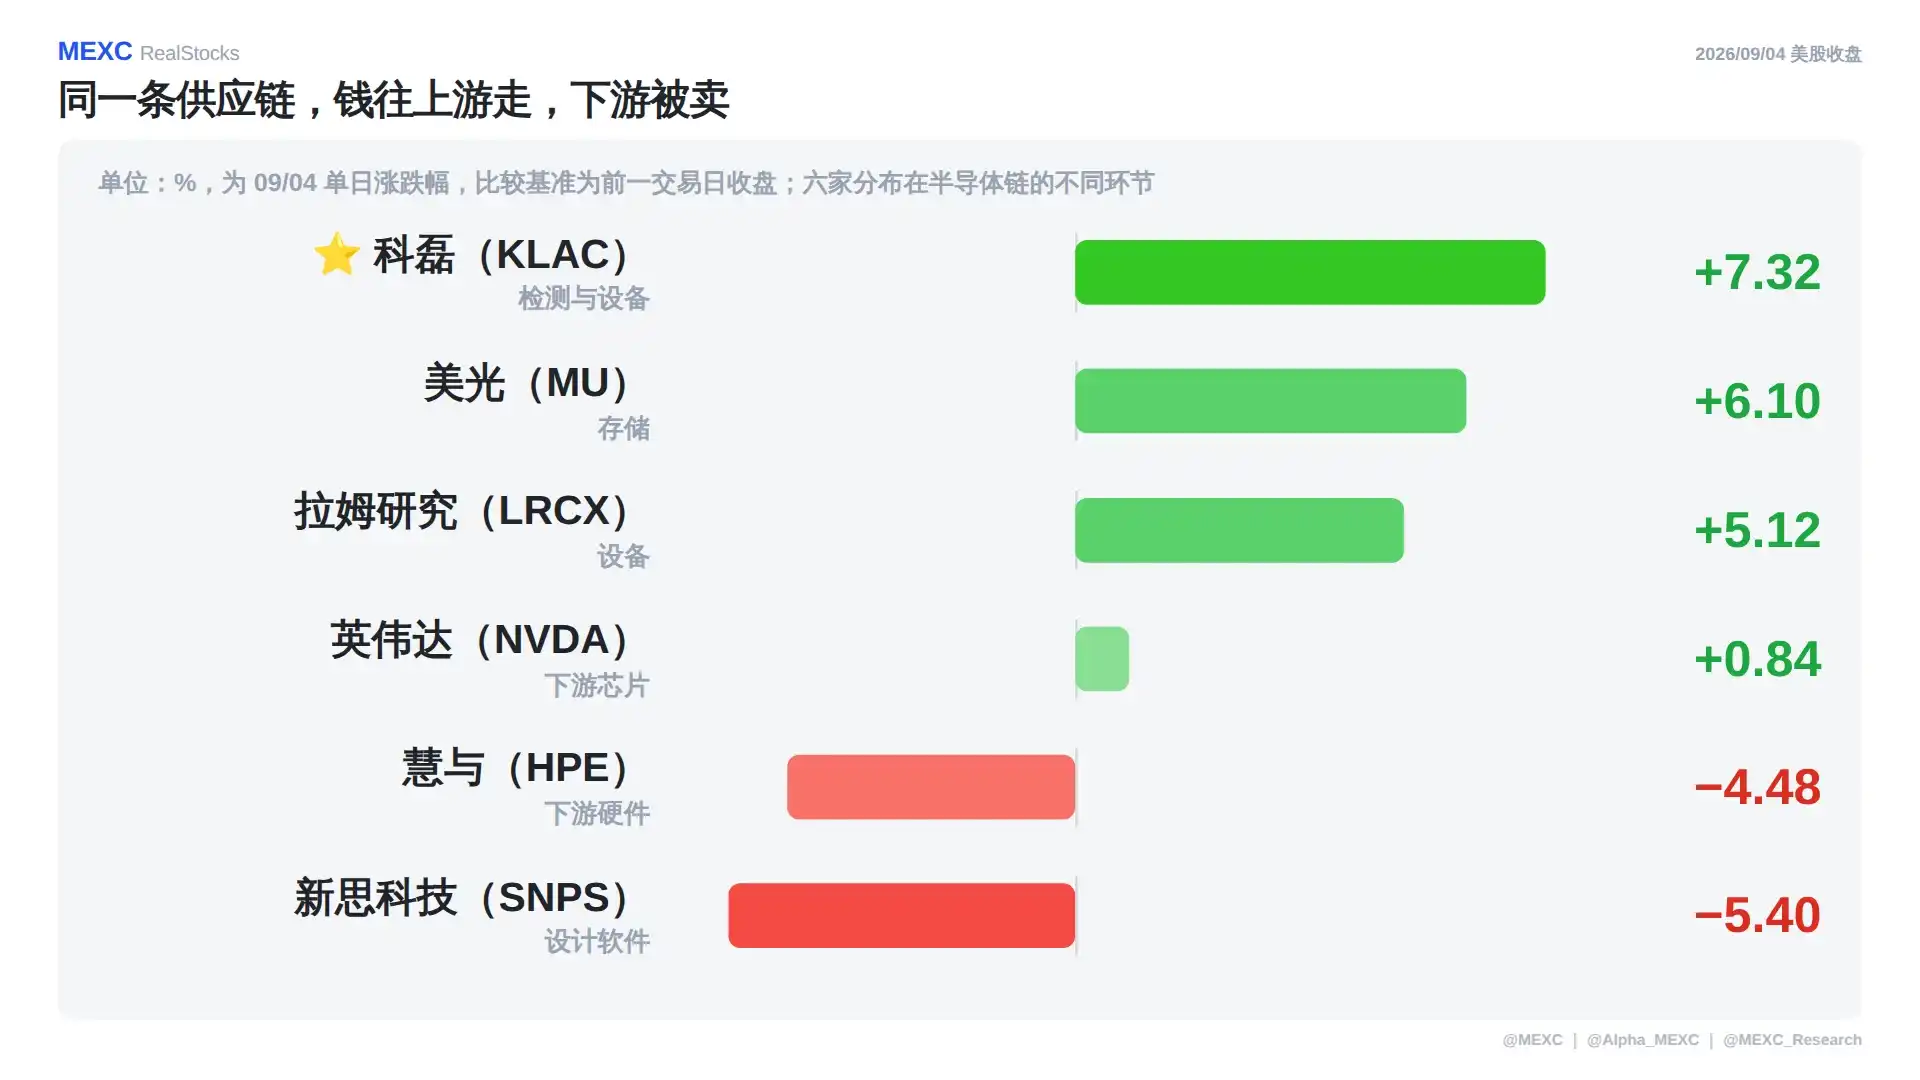
Unit is %, representing the single-day percentage change on September 4th, with the comparison benchmark being the previous trading day's close. The six companies are distributed across different segments of the semiconductor chain, ranked that day as follows: KLA Corporation (KLAC) up 7.32%, Micron (MU) up 6.10%, Lam Research (LRCX) up 5.12%, Nvidia (NVDA) up 0.84%, Hewlett Packard Enterprise (HPE) down 4.48%, Synopsys (SNPS) down 5.40%.
The most important thing this day was not who rose the most, but where the dividing line between gains and losses was drawn. The three gainers were all upstream equipment and memory companies; the two decliners were one downstream hardware company and one design software company. Opposing movements within the same chain indicate this wasn't a broad-based buy-in, but rather funds shifting positions within the chain: money was pulled out from downstream and placed upstream.
Nvidia's (NVDA) column is worth a separate look. It rose only 0.84% that day, the smallest gain among the advancing stocks. Its stock price was already near its one-year high; a high position naturally compresses upward room. KLA Corporation's (KLAC) position was in the lower half of its range, so the same amount of capital inflow produced a much larger gain. This is a difference in elasticity due to position, unrelated to which company is better.
3. Rising the Most Doesn't Equal Standing the Highest
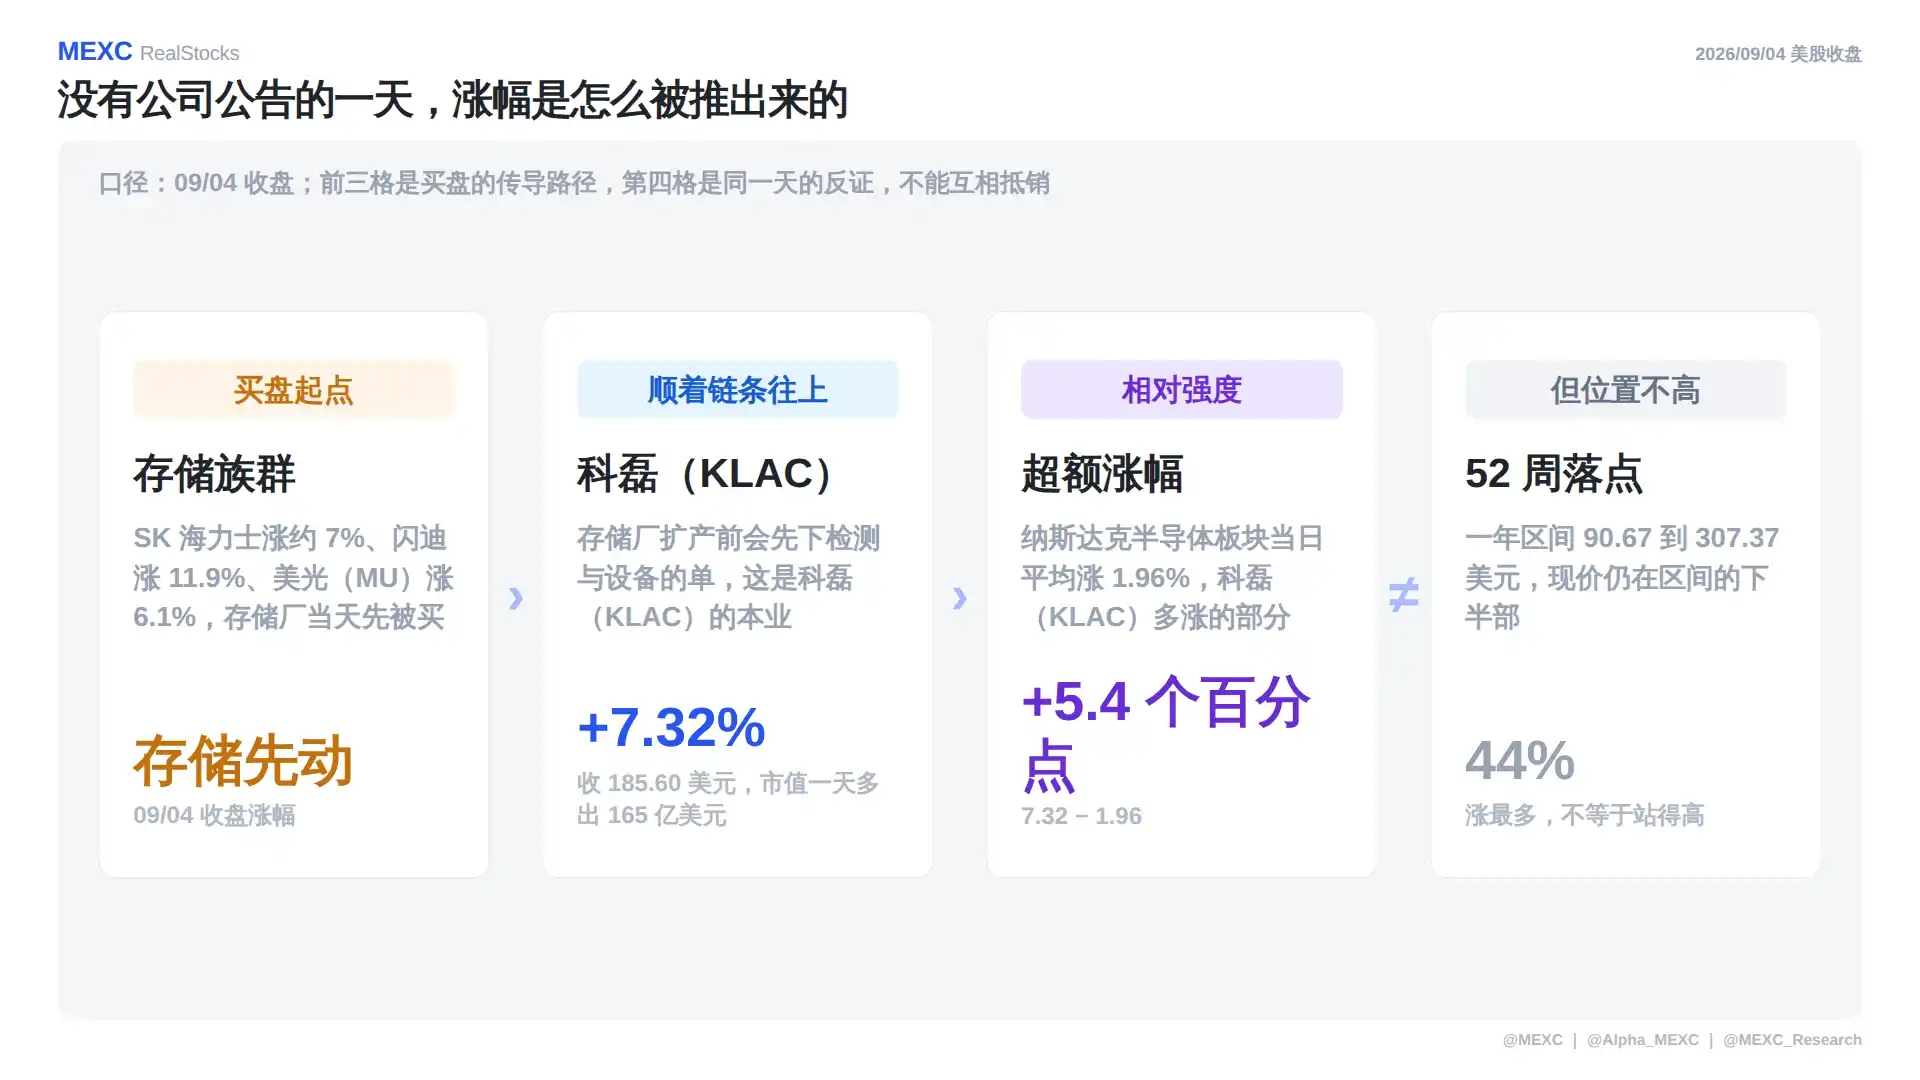
The scope is the September 4th close. Breaking down the gains of that day, they were pushed out in steps: Step one, buying started in the memory group—SK Hynix up about 7%, SanDisk up 11.9%, Micron (MU) up 6.1%, memory makers were bought first. Step two, money moved up the chain because memory makers place orders for inspection and equipment before expanding capacity, and inspection is precisely KLA Corporation's (KLAC) business. Step three, comparing it to the sector, the Nasdaq Semiconductor Index averaged a 1.96% gain that day, while KLAC rose 7.32%, outperforming by 5.4 percentage points—this portion is its own relative strength.
The fourth box is counter-evidence from the same day and cannot offset the first three boxes: the 52-week landing point is only 44%. The first three boxes explain 'why it rose today,' while the fourth box says 'where it stands after the rise.' The answers to these two questions can be completely different.
One thing must be clarified here: KLA Corporation (KLAC) did not release any company announcements on this day. The gains came from a collective shift of funds towards the equipment and memory groups, not from new company-specific news. This leads to a practical difference in judgment—gains driven by company announcements provide a reason you can read on the same day; gains driven by group fund shifts, however, will only see the reason materialize with order numbers in the next earnings report. Until then, it remains an expectation not yet verified by performance.
A supporting actor was Constellation Energy (CEG), up 4.88% to close at $298.96, while the Nasdaq Independent Power Producers Index averaged a 5.09% gain that day. Its commonality with KLA Corporation (KLAC) lies in a similar business model: nuclear power plants sell their future electricity output to data centers via long-term contracts, effectively locking future shipments into contracts today; similarly, memory makers placing equipment orders before expansion also turn future capacity into today's orders. The market is buying the same thing—a pre-locked future.
4. U.S. Stock Lesson: Same Day, Same Sector, Guidance Revised Down and Up
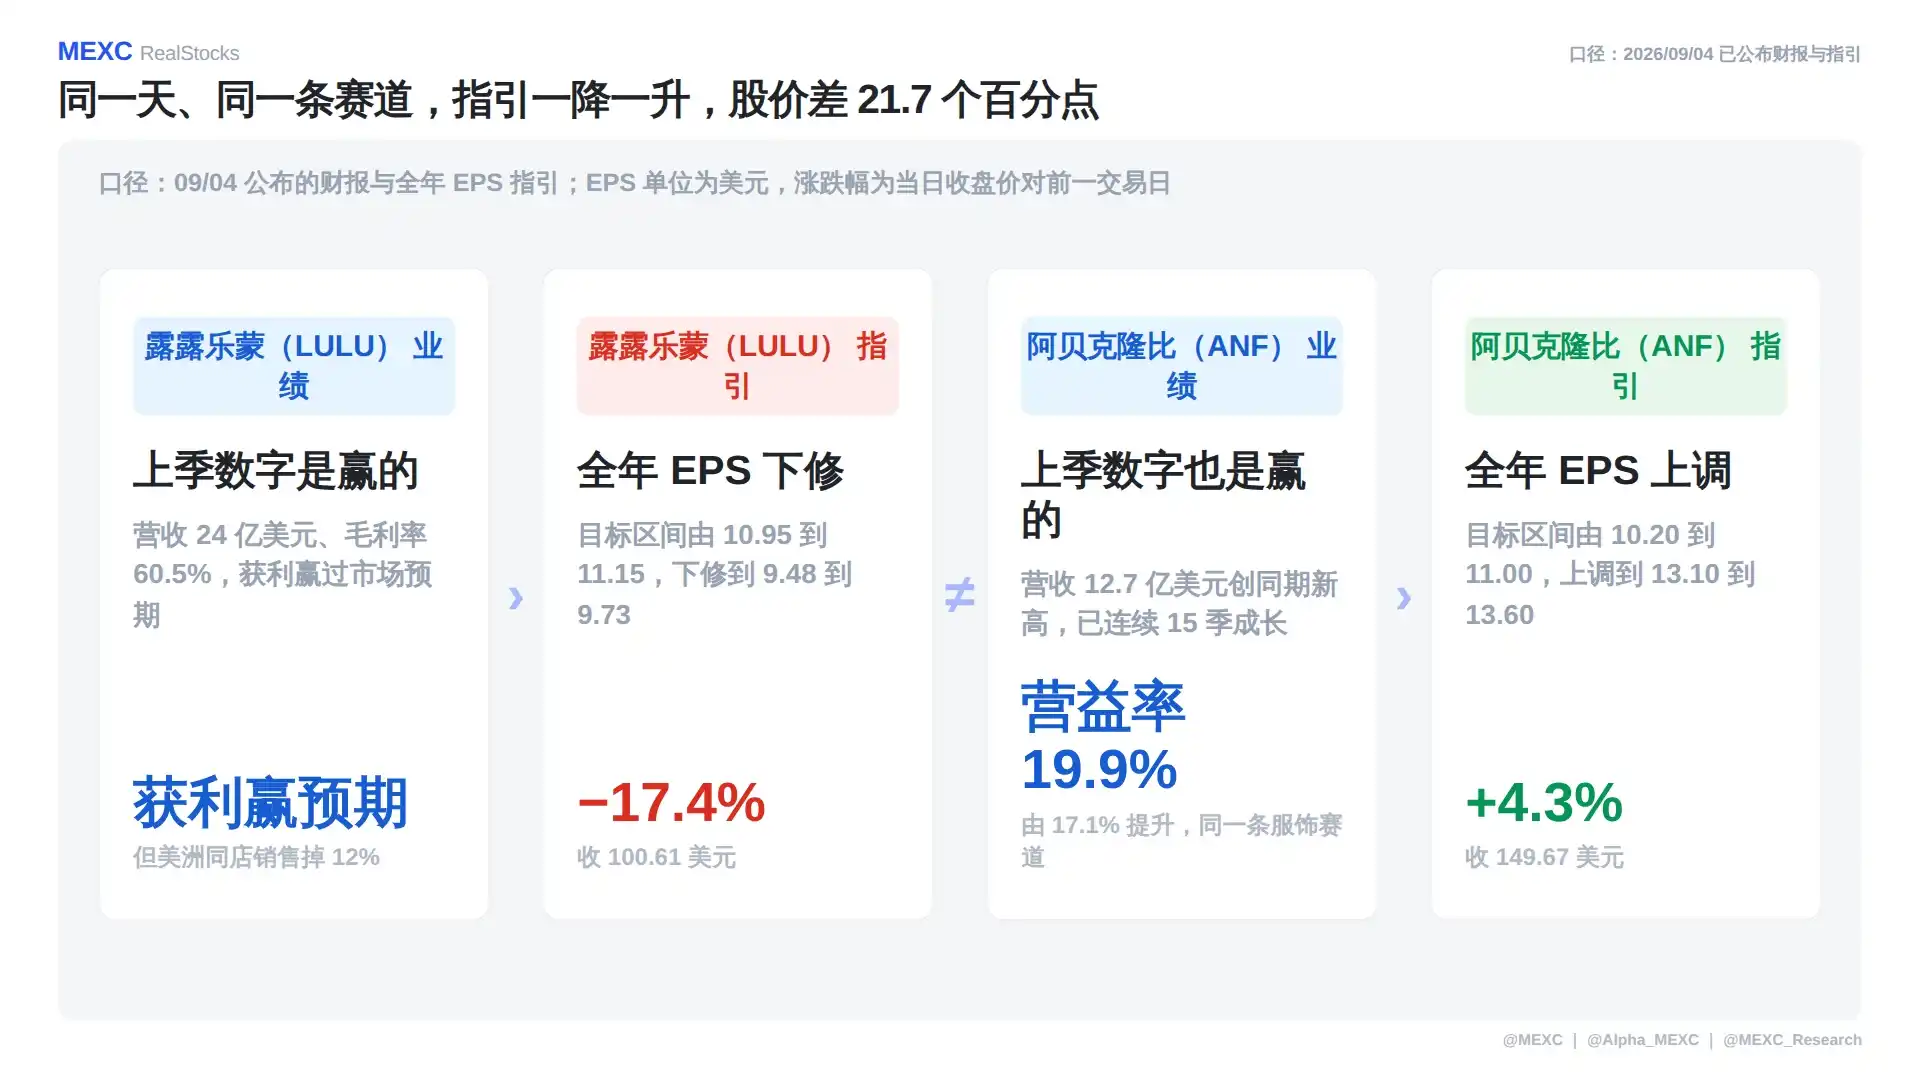
The scope is the earnings report and full-year EPS guidance announced on September 4th; percentage changes are for the day's closing price versus the previous trading day. Lululemon (LULU) reported last quarter revenue of $2.4 billion, gross margin of 60.5%, earnings beat market expectations, but Americas same-store sales dropped 12%. Simultaneously, it lowered its full-year EPS target from $10.95–$11.15 to $9.48–$9.73; its stock price fell 17.4%, closing at $100.61. Abercrombie & Fitch (ANF) reported last quarter revenue of $1.27 billion, a record for the period, marking 15 consecutive quarters of growth, with operating margin improving from 17.1% to 19.9%, and raised its full-year EPS target from $10.20–$11.00 to $13.10–$13.60; its stock price rose 4.3%, closing at $149.67.
Both companies beat expectations last quarter, yet their stock performances differed by 21.7 percentage points. What killed the valuation was not the revenue line, nor the gross margin line—it was the guidance line. Lululemon (LULU) lowered its profit promise for the coming year, while Abercrombie & Fitch (ANF) raised the same thing—the market was re-assessing 'how much this company can earn in the next year,' not 'how much it earned last quarter.'
Why is this the case: stock prices align with the future, not the quarter that just passed. The performance in earnings reports is something that has already happened; the market has already bought it into the price using expectations before the announcement. Guidance, however, is the company's sole public statement about the future—a number signed off by management. Thus, the same earnings report can be both a win and a loss—winning last quarter, losing for the next year, and the price follows the latter. The criterion is just one sentence: check the guidance first, then look at the performance.
Same Sector, Retracement Differ by 17 Times at the Extremes
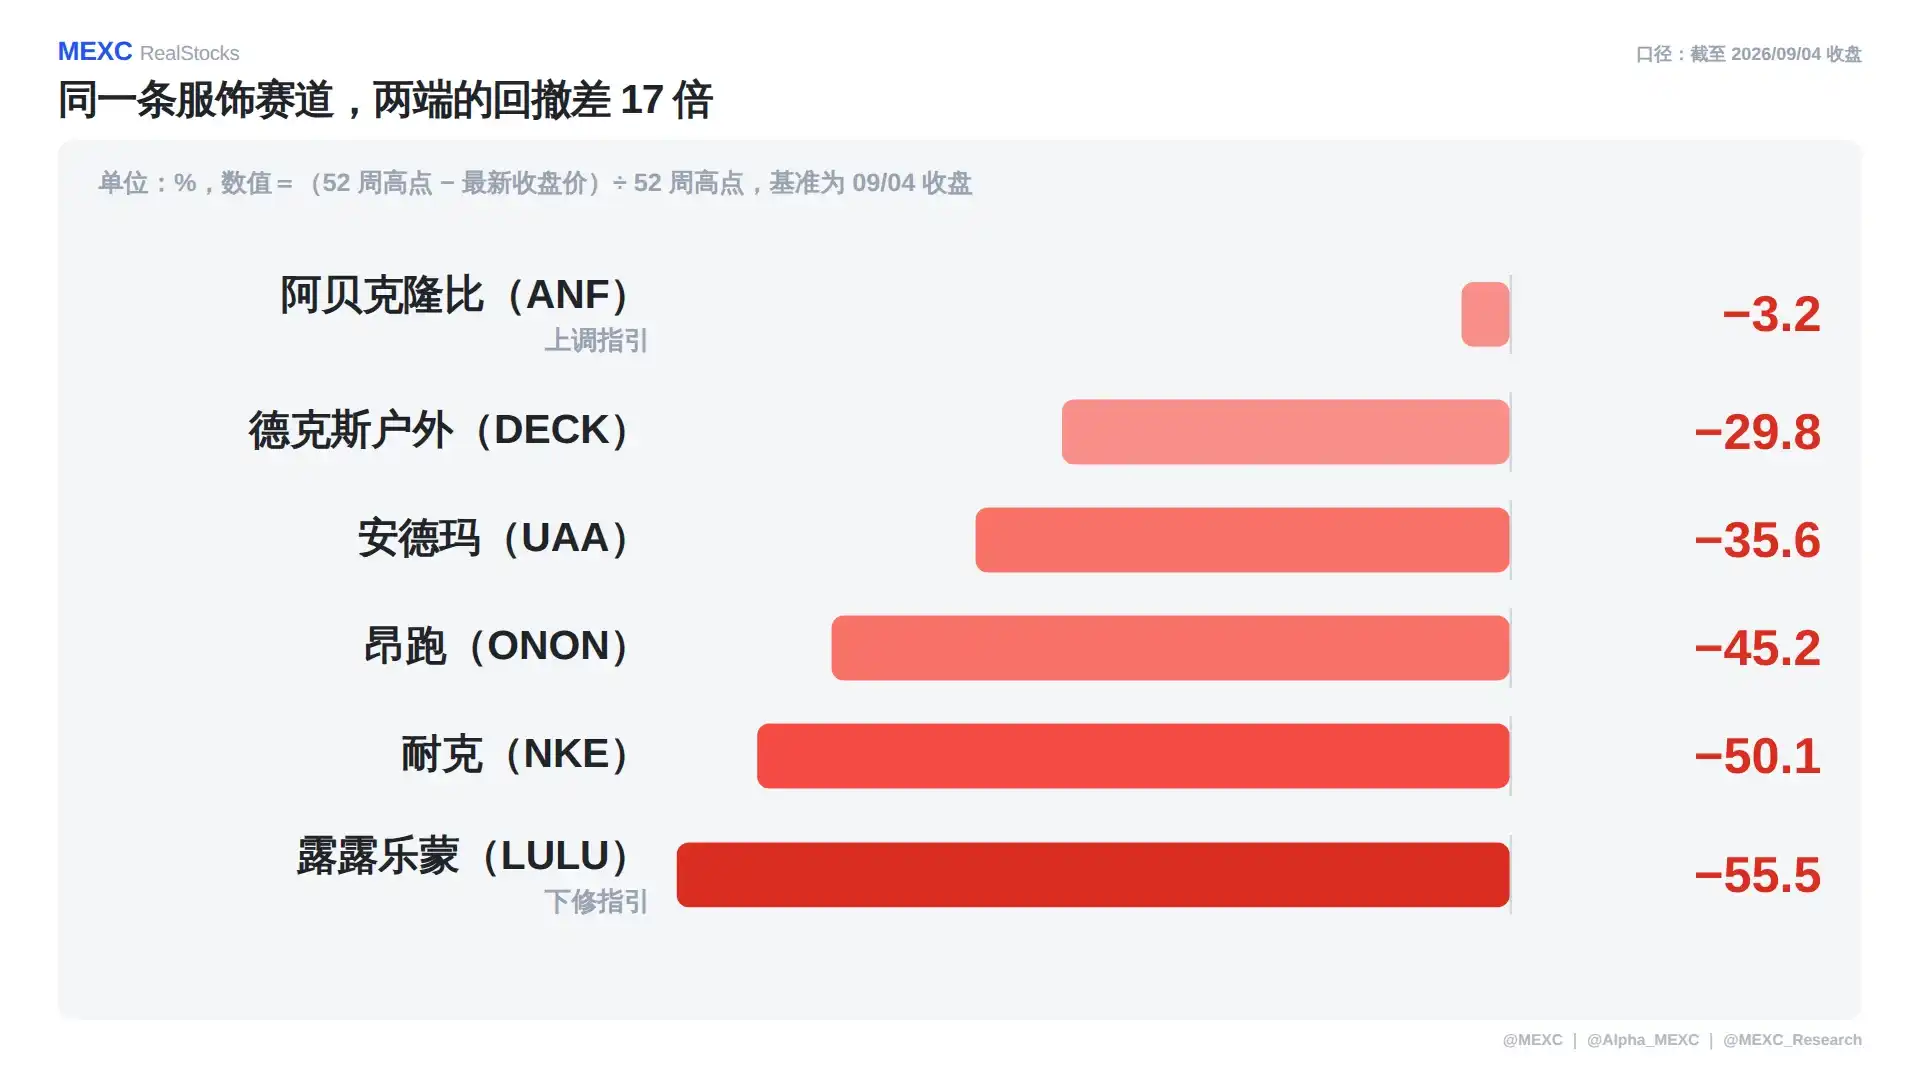
Unit is %; the value equals (52-week high minus latest closing price) divided by the 52-week high, benchmarked to the September 4th close. The ranking of six apparel companies is: Abercrombie & Fitch (ANF) retraced 3.2% from its high, Deckers Outdoor (DECK) retraced 29.8%, Under Armour (UAA) retraced 35.6%, On Holding (ONON) retraced 45.2%, Nike (NKE) retraced 50.1%, Lululemon (LULU) retraced 55.5%. The difference between the extremes is about 17 times.
Same sector, same consumer environment, same tariffs and inventory cycles, yet retracements can differ to this extent. The cycle affects everyone equally; the difference lies in whether the market still believes in the next chapter of each company: the one that raised guidance is almost at its high, while the one that lowered guidance has already fallen by more than half.
Meet a company—Abercrombie & Fitch (ANF): An American apparel group founded in 1892, its Abercrombie brand targets the adult demographic and Hollister targets teens, with both brands sharing the same supply chain and store network, making money through speed of style updates. Its operating margin improvement from 17.1% to 19.9% this quarter came not from selling things at higher prices, but from having fewer unsold items.
5. What to Watch This Week: Friday's August CPI at 12:30 UTC
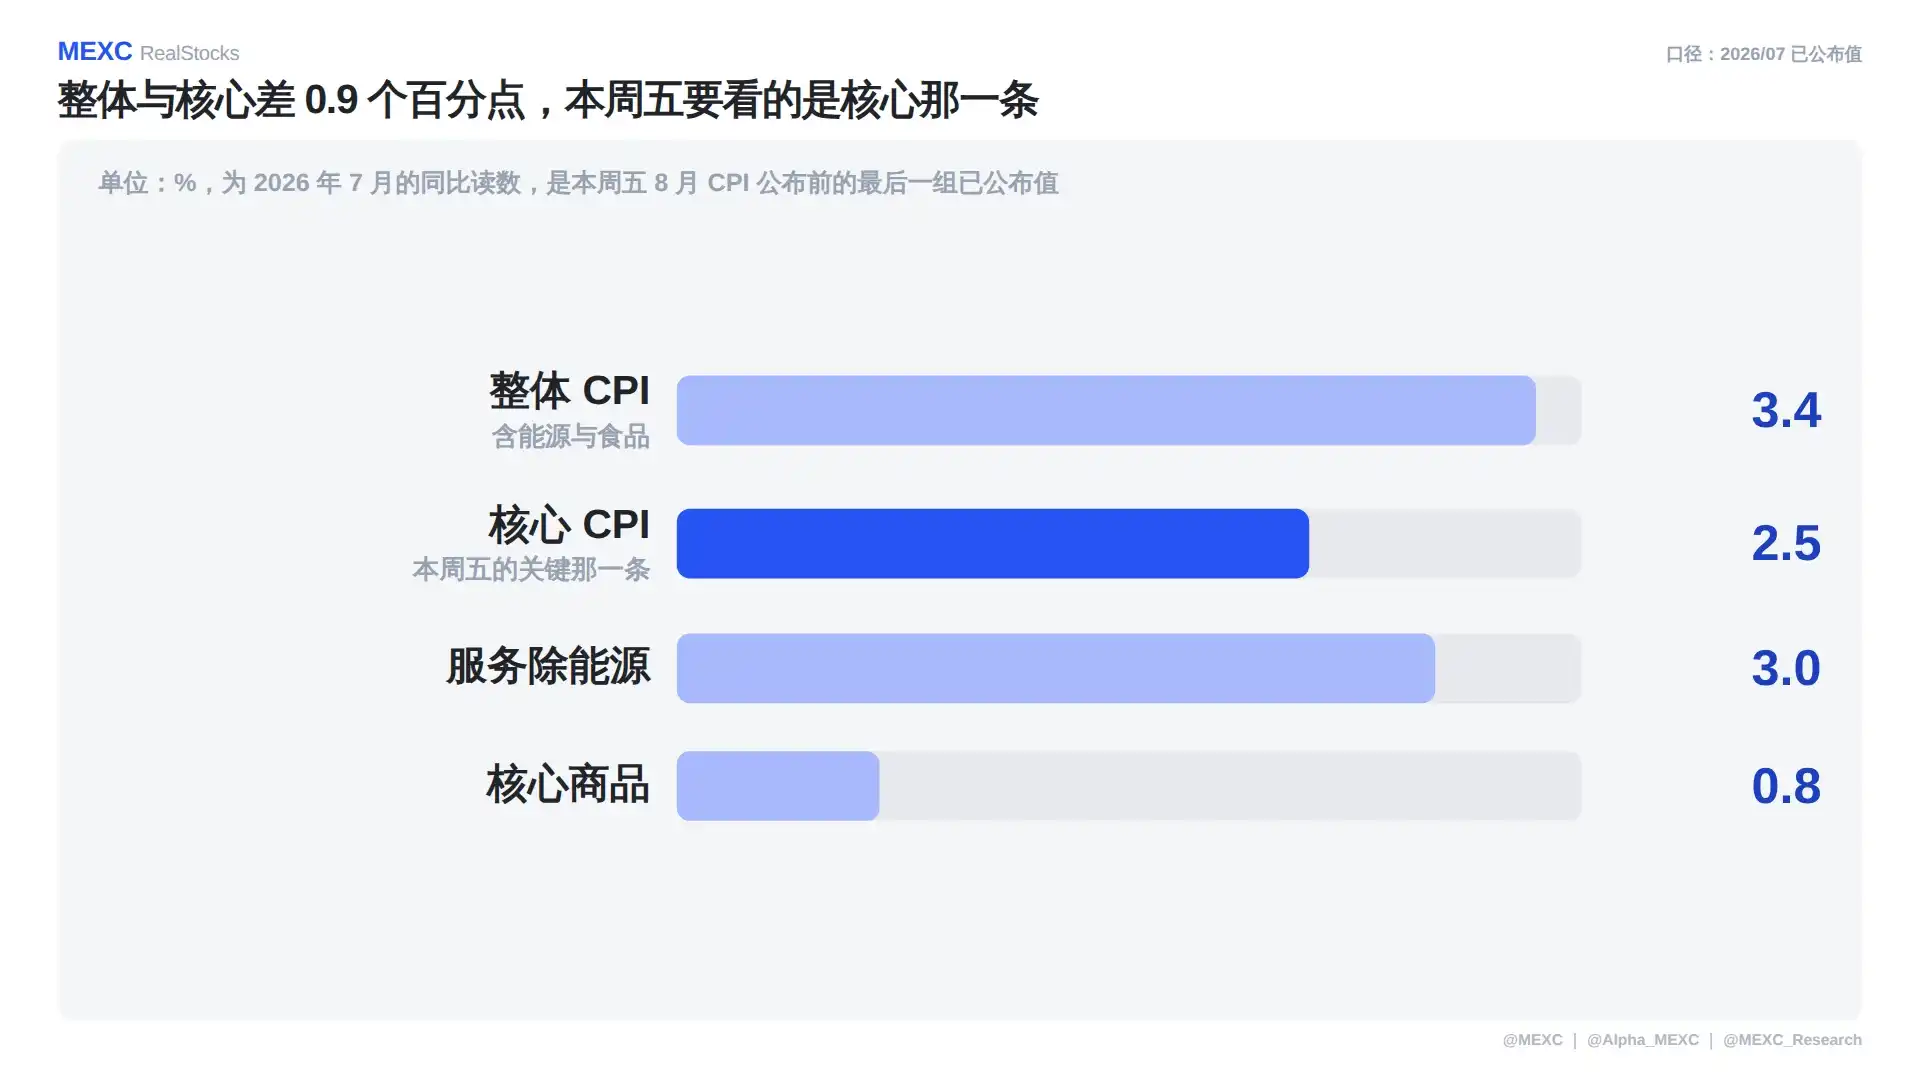
Unit is %, representing the year-over-year reading for July 2026, the last set of published values before this Friday's August CPI release. The four readings for July are: Headline CPI up 3.4%, Core CPI up 2.5%, Services less Energy up 3.0%, and Core Goods up 0.8%.
This week's schedule is as follows: Monday closed (Labor Day); Tuesday has the NFIB Small Business Optimism Index and Consumer Credit; Wednesday has MBA Mortgage Applications; Thursday at 12:30 UTC sees PPI released, with Oracle (ORCL) and Adobe (ADBE) reporting after the close; Friday at 12:30 UTC releases August CPI, with Kroger (KR) reporting before the open. (U.S. market open time is 13:30 UTC, close 20:00 UTC; add one hour for each during winter time.)
Why Friday's report is the most important: it is the final inflation data before the September 16th interest rate decision. The current policy rate is at 3.50%–3.75%, having remained unchanged for five consecutive meetings. Inflation determines interest rates, and interest rates then determine the prices of stocks and bonds—this is the upstream factor for all asset prices this week.
The focus should be on core rather than headline, for a specific reason: energy prices are determined by supply and geopolitics, beyond the reach of monetary policy. The gap between headline and core is 0.9 percentage points, and both the services and goods lines are not far from the core, indicating that the headline figure is significantly elevated by the energy component.
6. What's Propping Up Headline is Gasoline, What Decides Core is Shelter
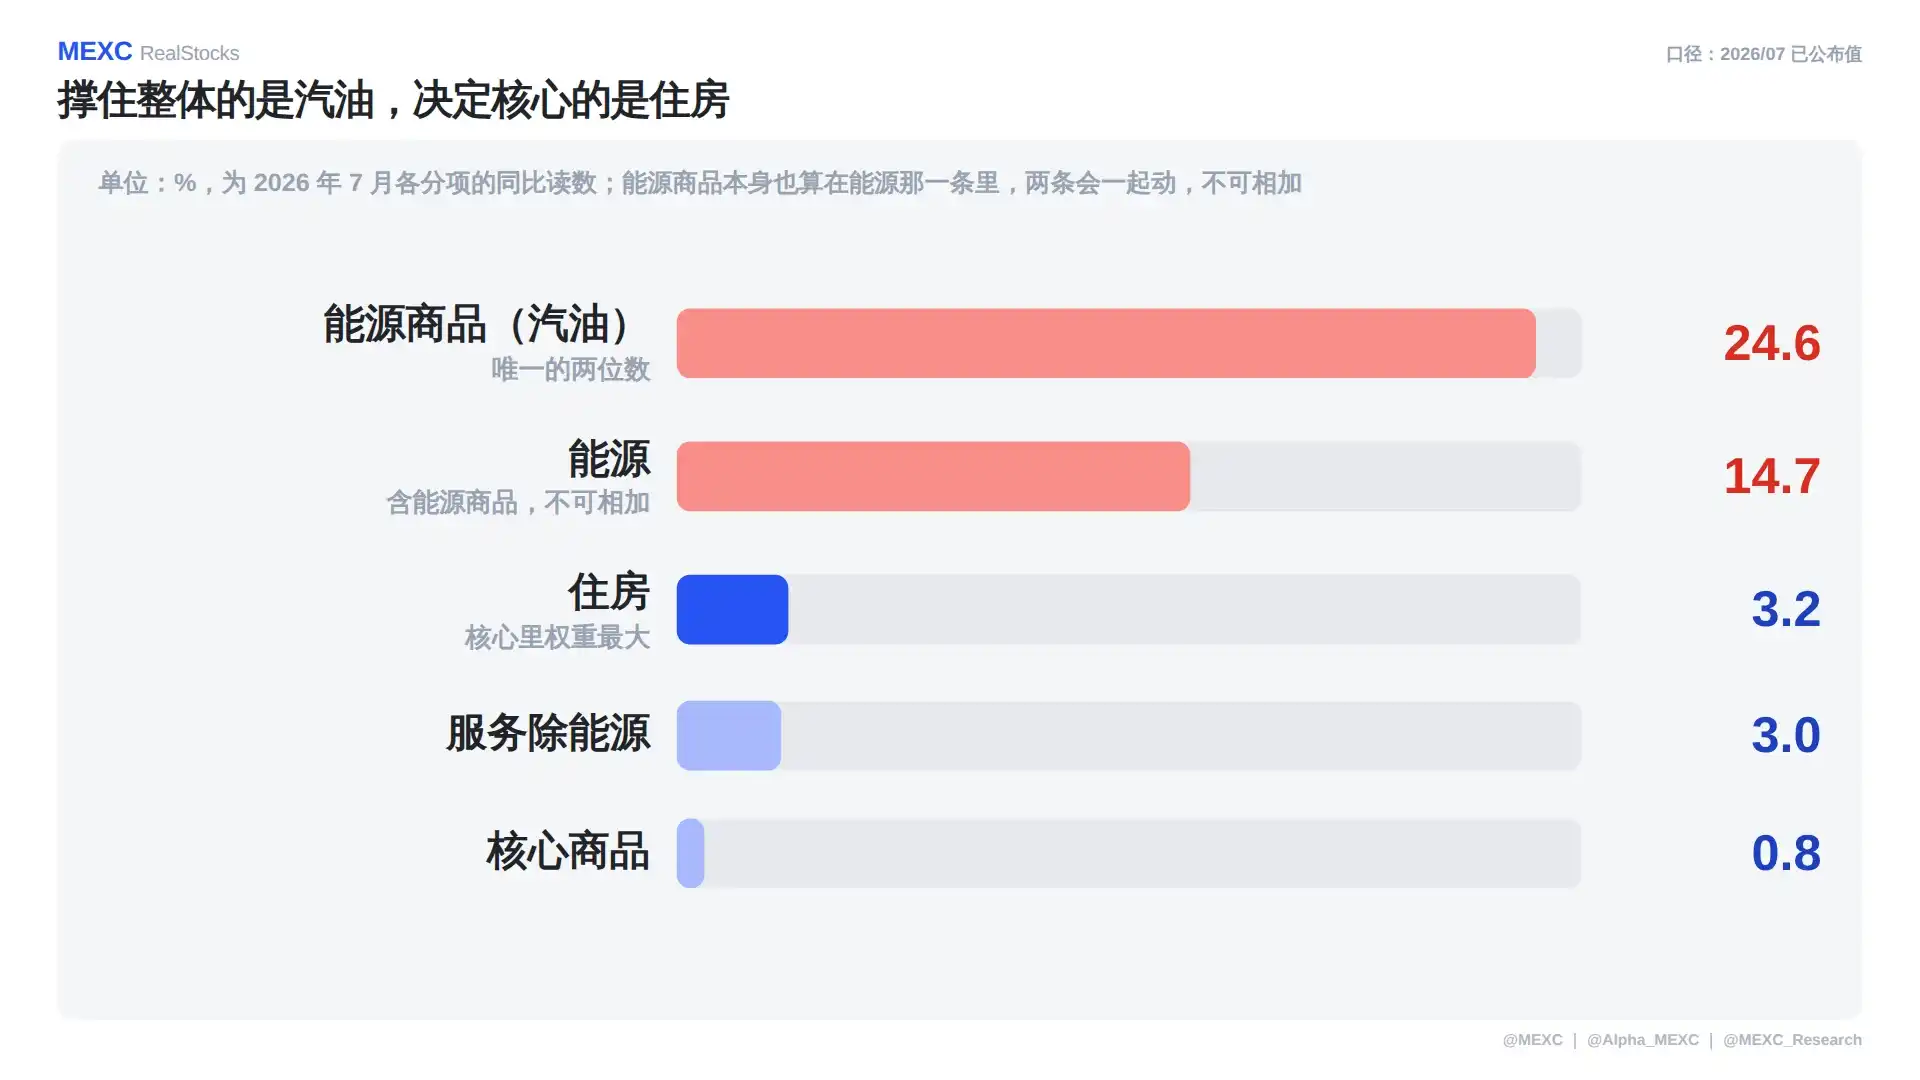
Unit is %, representing the year-over-year reading for each component in July 2026. Breaking down July: Energy commodities (mainly gasoline) rose 24.6%, the only double-digit increase; Energy overall rose 14.7%; Shelter rose 3.2%; Services less Energy rose 3.0%; Core Goods rose 0.8%.
Here is a scope issue that must be clarified first: Energy commodities themselves are included in the overall Energy line, the two move together, and they should not be added. Seeing 24.6% and 14.7% side by side, do not assume the energy contribution to inflation is the sum of the two.
The real comparison to remember is this: propping up the headline reading is the gasoline line, the only double-digit figure; Core Goods rose only 0.8%, providing almost no upward thrust. Shelter rising 3.2% may not seem high, but it carries the greatest weight within the core; whether the core can continue to move down is primarily determined by this line.
Therefore, once this Friday's data is out, the reading process has two steps: first, see if the core year-over-year can hold at 2.5%; second, check the shelter line. Relying solely on the ebbing of energy to pull down the headline won't last—because the effect of energy receding will fade as the base changes, while shelter is a slow-moving variable; once it sticks, the core won't come down.
7. Frequently Asked Questions
Q1: KLA Corporation (KLAC) rose 7.32% in a day, why is the 'Trend Position' in the five-dimensional score only 44?
Because they are not measuring the same thing. Single-day gain compares performance on that specific day; Trend Position compares where the price sits within its own 52-week range. KLA Corporation (KLAC) closed at $185.60 on September 4th, with a one-year range of $90.67 to $307.37, placing it at the 44% mark, still in the lower half of the range. The perfect 100 Peer Ranking versus the 44 Trend Position in the same score precisely illustrates this: no one was stronger than it that day, but it doesn't stand at a high position.
Q2: There were no company announcements from KLA Corporation (KLAC) on this day, where did the gains come from?
They came from a collective shift of funds within the memory group. That day, SK Hynix rose about 7%, SanDisk rose 11.9%, and Micron (MU) rose 6.1%; memory makers were bought first. Before expanding capacity, memory makers place orders for inspection and equipment, and inspection is KLA Corporation's (KLAC) business, so funds flowed up the chain accordingly. It's important to note that this type of gain lacks company-specific evidence on the day; actual order numbers will only appear in the next earnings report.
Q3: On the same supply chain, why did some rise and some fall?
Because this wasn't a broad-based buy-in, but a shift of positions within the chain. On September 4th, upstream players KLA Corporation (KLAC) rose 7.32%, Micron (MU) rose 6.10%, Lam Research (LRCX) rose 5.12%, while downstream players Hewlett Packard Enterprise (HPE) fell 4.48% and Synopsys (SNPS) fell 5.40%. Opposing movements within the same chain indicate money was pulled out from downstream and placed upstream. Looking only at the sector average (the Nasdaq Semiconductor Index averaged a 1.96% gain that day) would completely miss this internal disparity.
Q4: Lululemon (LULU) beat earnings expectations last quarter, why did its stock still fall 17.4%?
Because the market prices the future, not the past quarter. In that earnings report, revenue was $2.4 billion, gross margin was 60.5%, earnings beat expectations, but Americas same-store sales dropped 12%. More critically, the full-year EPS target was lowered from $10.95–$11.15 to $9.48–$9.73. Performance is about what already happened; guidance is the company's public statement about the future. On the same day, Abercrombie & Fitch (ANF) raised its target from $10.20–$11.00 to $13.10–$13.60, and its stock rose 4.3%—both companies beat last quarter, the difference was in the guidance.
Q5: For Friday's CPI, which line should be looked at first?
First, see if the core year-over-year can hold at 2.5%, then check the shelter line. July's readings were Headline CPI up 3.4%, Core CPI up 2.5%, a difference of 0.9 percentage points. Propping up the headline was Energy commodities (gasoline) up 24.6%, the only double-digit figure, while Core Goods rose only 0.8%. Shelter rose 3.2% and carries the greatest weight in the core; it determines whether the core can continue to move down. Another reminder regarding scope: Energy commodities are already included in the overall Energy line; the two should not be added together.