Bitcoin ETF inflows hit $3.8B in strongest three-week stretch of 2026

cointelegraph2026-09-05 tarihinde yayınlandı2026-09-05 tarihinde güncellendi

Özet

US-listed spot Bitcoin ETFs recorded their strongest three-week inflow stretch of 2026, attracting $3.8 billion as Bitcoin traded near $80,000. Total net assets reached $101.3 billion. This marks a sharp turnaround from earlier outflows, though year-to-date flows remain slightly negative. Daily inflows cooled to $174.6 million on Friday, led by BlackRock's IBIT, after a surge the previous day. Concurrently, inflows into US spot Ether and XRP ETFs fell significantly compared to the prior week. Despite this slowdown, both Ether and XRP ETFs maintain positive net inflows for the year.

US-listed spot Bitcoin exchange-traded funds (ETFs) have recorded their strongest three-week inflow stretch of 2026 as Bitcoin traded around $80,000.

The funds attracted $986.9 million in the week ending Friday, bringing net inflows over the past three weeks to $3.8 billion, according to SoSoValue data.

Total net assets across the funds stood at $101.3 billion on Friday after briefly rising to $103.3 billion a day earlier, while cumulative net inflows reached $55.6 billion.

ETF demand marks a sharp turnaround from heavy outflows earlier in 2026, though year-to-date net flows remain roughly $1 billion negative.

Bitcoin ETF inflows cool after Thursday surge

US spot Bitcoin ETFs attracted $174.6 million in net inflows on Friday, down sharply from the nearly $731 million recorded a day earlier.

BlackRock’s iShares Bitcoin Trust (IBIT), the largest spot Bitcoin ETF by assets, drew $117.4 million on Friday, accounting for about 67% of the day’s total net inflows, according to Farside Investors data.
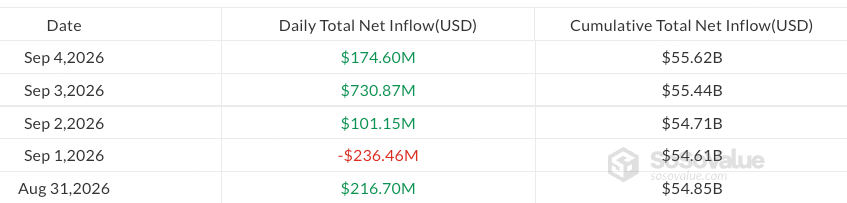
Daily spot Bitcoin ETF flows from Monday through Friday. Source: SoSoValue

Fidelity’s Wise Origin Bitcoin Fund (FBTC) was the only other fund to record net inflows, attracting $57.2 million, while all other US spot Bitcoin ETFs recorded no net flows for the day.

Related: Surprise nonfarm payrolls print sends Bitcoin back below 80K

The slowdown came as Bitcoin fell from around $81,200 to briefly below $79,000 on Friday. Bitcoin traded at $79,716 at the time of publication, still up about 2.6% over the past seven days, according to CoinGecko.

Bitcoin ETF demand strengthens as Ether, XRP flows fade

Compared with the previous week, Bitcoin ETF inflows increased about 7%, while inflows into US spot Ether and XRP ETFs fell about 74% and 83%, respectively.

Spot Ether ETF inflows dropped to $218.4 million from $824.4 million, while XRP ETF inflows declined to $19 million from $110.5 million, according to SoSoValue.

Despite weaker inflows, Ether and XRP ETFs remain in positive territory for the year. US spot Ether ETFs have recorded about $863 million in net inflows year-to-date, while XRP ETFs have attracted roughly $515 million.

Magazine: BTC will hit $1M by 2030... but Arthur Hayes is buying ETH instead

İlgili Sorular

QWhat was the total net inflow for US-listed spot Bitcoin ETFs over the strongest three-week stretch of 2026?

AThe total net inflow for US-listed spot Bitcoin ETFs over the strongest three-week stretch of 2026 was $3.8 billion.

QWhich specific Bitcoin ETF accounted for the majority of net inflows on Friday, and how much did it attract?

ABlackRock’s iShares Bitcoin Trust (IBIT) accounted for the majority of net inflows on Friday, attracting $117.4 million, which was about 67% of the day's total.

QHow did the weekly net inflows into Bitcoin ETFs compare to those of Ether and XRP ETFs in the same period?

ACompared to the previous week, Bitcoin ETF inflows increased about 7%. In contrast, inflows into US spot Ether ETFs fell about 74% and inflows into XRP ETFs fell about 83%.

QWhat were the cumulative net inflows for US spot Bitcoin ETFs as of the Friday mentioned in the article?

AAs of the Friday mentioned in the article, the cumulative net inflows for US spot Bitcoin ETFs reached $55.6 billion.

QWhat is the year-to-date net flow status for Bitcoin ETFs despite the recent strong three-week inflow stretch?

ADespite the recent strong three-week inflow stretch, the year-to-date net flows for Bitcoin ETFs remain roughly $1 billion negative.

İlgili Okumalar

Just Now, Meta's Flagship Model Crushes GPT-6 and Opus! Leaps Back into World's Top Three Overnight

Meta has launched its most powerful flagship AI models yet, Muse Wonder and Muse Wonder Full, positioning them as a historic leap toward "personal superintelligence." Benchmark results show these models are now competitive with leading counterparts from OpenAI and Anthropic. On the Artificial Analysis index, Muse Wonder Full scored 56, placing it in the global top tier alongside Claude Sonnet 5.5 and surpassing GPT-6 Astra. In long-context programming tasks like SWE-Marathon, both Wonder and Wonder Full outperformed Claude Opus 5.5 and GPT-6 Astra. Key new capabilities include "Active Memory" for retaining user information across conversations and "Active Focus" for autonomous problem-solving and plan adjustment. The models show significant gains over the previous Muse Spark 1.3, with the Full version improving by 8 points on the Artificial Analysis index in just six weeks. In professional tasks like legal and financial analysis, Wonder Full exceeded Opus 5.5 in 8 out of 14 tests. It also demonstrated improved efficiency, solving more math problems while reducing output tokens by 40%. Developed using Meta's gigawatt-scale "Prometheus" supercomputing infrastructure, the models feature a 1 million token context window and native multimodal support. Pricing starts at $4 per million tokens for input and $20 for output via API for the standard Wonder model, while Wonder Full is available through Muse Code subscriptions at $50 or $200 per month.

marsbit6 dk önce

Just Now, Meta's Flagship Model Crushes GPT-6 and Opus! Leaps Back into World's Top Three Overnight

marsbit6 dk önce

How to Understand the CFTC's Regulation of Prediction Markets?

On October 9, the U.S. Commodity Futures Trading Commission (CFTC) released two conflicting documents concerning event contracts in prediction markets. A proposal seeks to classify contracts on sports, politics, and other events as "swaps" under CFTC jurisdiction, while a separate interim rule explicitly excludes licensed sports betting and casino games from the swap definition. This creates a regulatory split where bets on the same NFL game could be regulated as state-level gambling if placed at a Las Vegas sportsbook, but as a federally regulated swap if traded on a CFTC-registered exchange like Kalshi. CFTC Chairman Michael Selig argues these event contracts are commodity derivatives for hedging, speculation, and price discovery. However, the move faces legal challenges. The NFL and 39 states oppose the CFTC's stance, arguing these contracts create new gambling risks rather than hedging existing ones. Federal appeals courts are divided: the Third Circuit ruled such contracts are swaps, while the Sixth and Ninth Circuits concluded they are not. This circuit split has prompted New Jersey to petition the Supreme Court for review. The proposed rules are not yet in effect, pending publication and a comment period. The ultimate outcome hinges on court decisions and the future composition of the CFTC commission. The core conflict remains whether event contracts on prediction markets fall under federal derivatives regulation or state gambling laws.

marsbit18 dk önce

How to Understand the CFTC's Regulation of Prediction Markets?

marsbit18 dk önce

BTC Daily Adjustment in Progress, HYPE Nears Short-term Directional Decision | Invited Analysis

This weekly analysis examines the recent price action of Bitcoin (BTC) and HYPE, focusing on key technical developments and outlining potential trading strategies. **Bitcoin (BTC) Analysis:** * **Market Trend Assessment:** The analysis applies a "52-week moving average confirmation method" to assess the broader trend. While BTC's weekly closing price has broken above this key average, the moving average itself remains in a downtrend, and a proper pullback confirmation is still lacking. The conclusion is that the rally from the July 1st low is still classified as a technical rebound, not yet confirming a new bull market. * **Daily Chart Structure:** The report argues that the five-wave rally (a-e) from the July low likely concluded at the September 21st high. The recent breakdown below the key support of $82,500, followed by a weak-volume rebound, supports this view. If the e-wave is complete, a larger corrective decline (potentially in three sub-waves) is anticipated. The first leg of this correction is underway, with an initial target around $78,000. * **Weekly Outlook & Strategy:** * **Outlook:** The focus is on the downside targets from the September 21st high. Key resistance is seen at $85,500 and the $87,500-$90,000 zone. Support levels are identified at $80,500-$82,500, $75,000-$78,000, and $69,100-$70,500. * **Strategy:** The medium-term posture is neutral/cautious, recommending watching for a potential pullback to a "channel" for confirmation. For short-term traders, two scenarios are outlined: (A) Selling into strength near the $85,500-$87,500 resistance if bearish signals appear, or (B) Selling a confirmed breakdown below the $80,500-$82,500 support zone. A 30% position size with strict stop-loss management is advised. **HYPE Analysis:** * **Daily Chart Structure:** HYPE broke below the lower boundary of its two-month ascending channel on October 8th. Price is currently in a "pullback confirmation" phase, testing this breached support-turned-resistance. A failure to reclaim this level would signal weakness and open the path towards the $75-$77 support area. The longer-term uptrend line, however, remains intact. * **Weekly Outlook & Strategy:** * **Outlook:** The critical watchpoint is the outcome of the current test of the former channel support. Resistance levels are noted at $88-$90, $94, and $102. Key support zones are $80-$82 and $75-$77. * **Strategy:** Two bullish scenarios are proposed for short-term trades: (1) A light long position if price convincingly reclaims and holds above the former channel support, or (2) A light long position if price falls to the $75-$77 support area and shows signs of stabilization. A 30% position size with strict stop-loss discipline is emphasized. **Risk Management Reminder:** The article includes a standard trailing stop-loss protocol (moving stop to breakeven at +1% profit, then locking in profits progressively). It strongly cautions that all analysis is for informational purposes only, not investment advice, and strategies must be adapted to changing market conditions.

marsbit1 saat önce

BTC Daily Adjustment in Progress, HYPE Nears Short-term Directional Decision | Invited Analysis

marsbit1 saat önce

U.S. Defense Procurement Seeks to Exclude Chinese PCBs, Stirring Domestic Disputes Among American Companies

A U.S. defense procurement rule set to take effect in January 2027, which aims to exclude printed circuit boards (PCBs) from China, Russia, Iran, and North Korea, has sparked debate within the American industry. While the policy, stemming from the 2021 National Defense Authorization Act, is intended to bolster U.S. domestic manufacturing and supply chain security, it faces conflicting pressures. The U.S. PCB industry association (PCBAA) urges swift implementation to redirect defense contracts to local manufacturers. In contrast, technology industry groups like the Information Technology Industry Council (ITI) seek a longer transition period, citing high costs and complexities for companies needing to establish new, certified supply lines and production facilities. The rule's direct impact on China's vast PCB industry is estimated to be minimal, affecting less than 1% of its total demand. However, it highlights a broader U.S. strategy to revive advanced electronics manufacturing through defense contracts, tax credits, and subsidies. Despite these efforts, rebuilding a competitive domestic PCB industry faces significant hurdles, including multi-year factory construction timelines, reliance on overseas materials and equipment, and the challenge of achieving commercial scale without sufficient non-defense orders. Notably, even U.S. defense contractors like TTM continue to expand production capacity in China to leverage its mature, cost-effective supply chain. Meanwhile, China's PCB sector is transitioning from scale to technological sophistication, making significant inroads in high-end areas like AI servers and advanced packaging. Leading Chinese firms are achieving breakthroughs in materials and complex multi-layer board production, supported by a deep industrial ecosystem of suppliers, manufacturers, and end-client collaboration. This entrenched system of scale, iterative development, and integrated supply chains represents a competitive advantage that U.S. policy alone cannot quickly replicate. The core challenge for the U.S. is not merely redirecting orders but rebuilding the comprehensive manufacturing capabilities and commercial viability that have shifted overseas.

marsbit1 saat önce

U.S. Defense Procurement Seeks to Exclude Chinese PCBs, Stirring Domestic Disputes Among American Companies

marsbit1 saat önce

İşlemler

Spot
活动图片