Ali Martinez Predicts Dogecoin Breakout of Resistance at $0.177

cryptonews.ru2026-08-16 tarihinde yayınlandı2026-08-16 tarihinde güncellendi

Özet

Crypto analyst Ali Martinez suggests Dogecoin (DOGE) might be poised for a significant rally. He highlights that a buy signal from the Tom DeMark Sequential indicator on the monthly chart indicates a potential trend reversal. The current setup, featuring an inverted hammer and a forming Doji candlestick, is very similar to the pattern seen in August 2022, which preceded a 145% monthly surge. Martinez notes a key resistance level at $0.0813, where over 30 billion DOGE were previously traded. A sustained break and close above this level could signal the start of an upward move. Wealthy investors have accumulated over 430 million DOGE in the past week, showing bullish sentiment. If the pattern repeats, the next major resistance and potential target for the rally is $0.177. Currently, DOGE is trading sideways between $0.068 and $0.08, priced around $0.069.

Recently, cryptocurrency analyst Ali Martinez wrote that Dogecoin may be preparing for a significant rise. Several indicators point to the likelihood of upward movement. Under favorable circumstances, the growth could reach the $0.177 mark, especially if an important resistance level is breached, where deals involving 30 billion $DOGE were previously executed.

Martinez highlighted key reasons that, in his opinion, could ensure parabolic growth for Dogecoin.

According to the analyst, last month the well-known Tom DeMark Sequential indicator gave a buy signal on Dogecoin's monthly chart, indicating a potential trend reversal.

Ali Martinez believes that the current situation with Dogecoin is very similar to August 2022, when the cryptocurrency formed an inverted hammer, accompanied by a buy signal from the Tom DeMark Sequential, followed by a doji candlestick. This was followed by a 145% monthly increase.

Currently, $DOGE is showing a similar picture: an inverted hammer, a buy signal from TD, and a forming candlestick. If history repeats, the next monthly candlestick could trigger a serious surge.

The current technical situation remains positive, and it appears that large holders are preparing for a rise. Over the past week, wealthy investors have accumulated over 430 million $DOGE.

Since June 25, Dogecoin has been trading sideways between $0.068 and $0.08. The current price of the meme cryptocurrency is $0.069, and a "death cross" recently appeared on the hourly chart.

If Dogecoin encounters a trend reversal, the key resistance level will be the $0.0813 mark, where deals involving more than 30 billion $DOGE were previously executed.

On June 23, Dogecoin faced a sharp rejection from this key level, and it should be monitored in anticipation of the next Dogecoin rally. A sustained close above $0.0813 could signal further growth, with the next resistance being at $0.177, according to Ali Martinez.

end-content
İlgili Sorular

QWho is the cryptocurrency analyst mentioned in the article, and what is his prediction for Dogecoin?

AThe cryptocurrency analyst is Ali Martinez. He predicts that Dogecoin could break through the resistance level at $0.177, especially if it overcomes a key resistance level.

QWhat technical indicator gave a buy signal for Dogecoin according to Ali Martinez?

AAccording to Ali Martinez, the Tom DeMark Sequential indicator gave a buy signal on the monthly Dogecoin chart last month.

QWhat historical pattern from August 2022 does the current Dogecoin situation resemble, and what happened after that pattern?

AThe current situation resembles August 2022, when Dogecoin formed an inverted hammer, followed by a Tom DeMark Sequential buy signal and a Doji candlestick. This was followed by a monthly increase of 145%.

QWhat is the current key resistance level for Dogecoin, and why is it significant?

AThe current key resistance level is $0.0813. This level is significant because deals involving more than 30 billion $DOGE were previously made there, making it a major barrier for price movement.

QWhat recent technical pattern appeared on Dogecoin's hourly chart, and what is its typical implication?

AA 'death cross' recently appeared on Dogecoin's hourly chart. This pattern typically implies a potential bearish trend reversal or continuation of a downtrend in the short term.

İlgili Okumalar

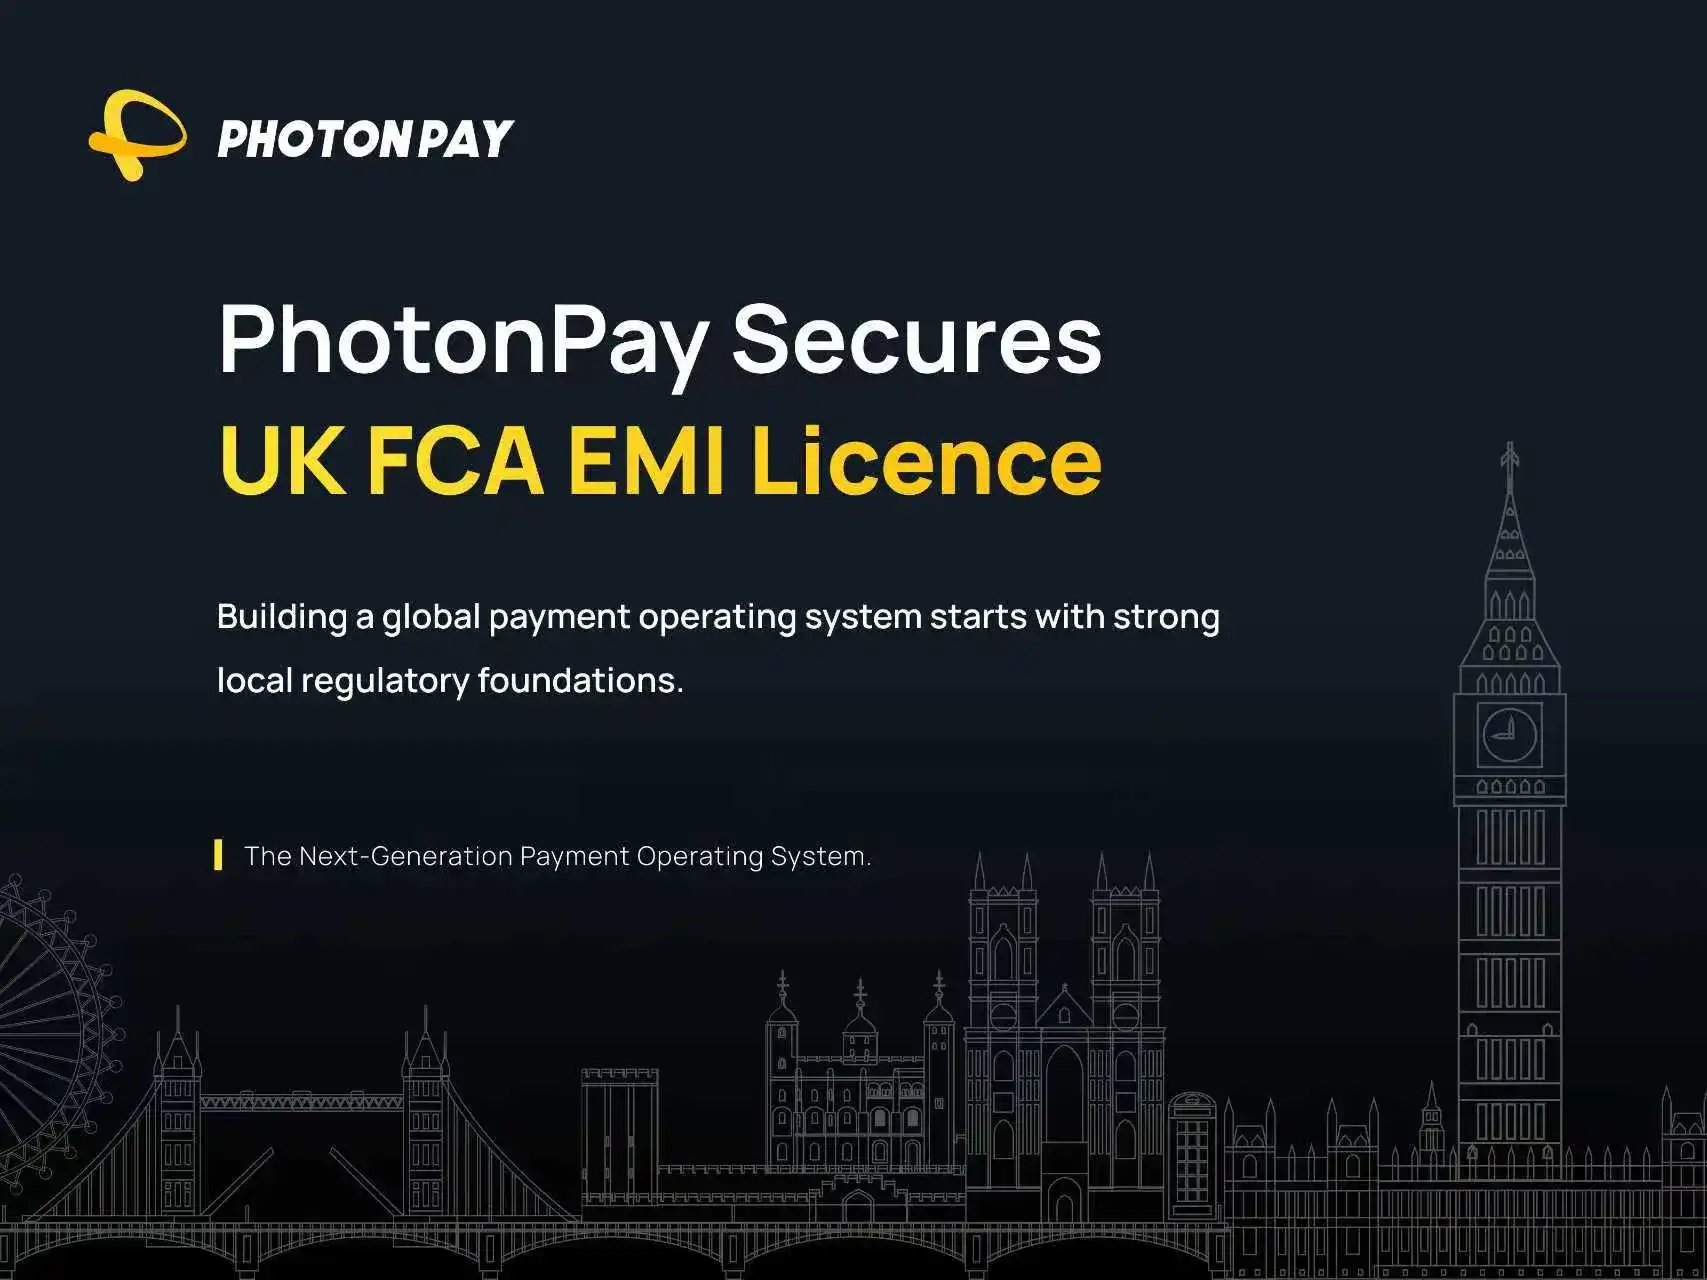
PhotonPay Obtains UK EMI License, Advancing Global Payment Operating System Layout

PhotonPay has obtained an Electronic Money Institution (EMI) license from the UK Financial Conduct Authority (FCA), marking a significant milestone in its global compliance strategy. With this license, PhotonPay can issue electronic money and provide payment services within the UK regulatory framework, strengthening its local financial capabilities and supporting global businesses with broader fund-flow solutions. The UK is a key financial hub connecting Europe and global markets, and as enterprises expand internationally, their financial needs are shifting from single cross-border transactions to integrated management of accounts, payments, foreign exchange, cards, and treasury. The EMI license reinforces PhotonPay's UK localization, enabling connections with local banks, payment networks, and financial partners. PhotonPay's Global Chief Compliance Officer JP noted that this license is a key step in building a global payment operating system backed by solid local regulatory foundations. PhotonPay is developing a next-generation payment operating system that unifies fragmented financial infrastructure across markets, allowing businesses to manage global accounts, collections, payments, FX, cards, and embedded finance more efficiently. Built on real business fund flows, PhotonPay continues to expand regulatory qualifications, banking partnerships, payment networks, and technology. To date, PhotonPay has secured nearly 30 payment licenses and regulatory qualifications worldwide, covering global accounts, payments, FX, cards, and embedded finance. The UK EMI license further strengthens its global compliance network as it continues building a next-generation global payment operating system.

marsbit6 dk önce

PhotonPay Obtains UK EMI License, Advancing Global Payment Operating System Layout

marsbit6 dk önce

US Treasury Survey Fails to Signal Debt Issuance Cuts, Treasury Yields Rise, 10-Year Back Above 5.12%

The U.S. Treasury's latest primary dealer survey did not signal an imminent reduction in long-term bond auction sizes, disappointing investors who bet the government would act to push down long-term rates. Treasury yields rose broadly, with the 10-year benchmark yield重回 above 5.12%, up 6.5 basis points intraday, while 20-year and 30-year yields also climbed. The survey was part of preparations for the quarterly refunding announcement on November 4. Markets had hoped for clues that Treasury Secretary Bessent might adjust long-term issuance, particularly the possibility of cutting or halting 20-year bond sales. Instead, Treasury only asked broadly what auction size adjustments should be considered, without clearly hinting at reduced long-term supply. Dealers were also asked about the long-term buyback program, improving buyback efficiency, timing of T-bill and floating-rate note issuance around FOMC meetings, and economic and financing outlooks. Analysts including RBC's Blake Gwinn and TD Securities' Molly Brooks said the questions were too broad and sent no substantive signal, with long-term auction changes unlikely before February 2027. Citi, however, maintained its forecast that Treasury would cut 20-year and 30-year auction sizes by $3 billion each in November. Rising oil prices also added upward pressure on yields. The market reaction was concentrated in long-dated Treasuries, which are especially sensitive to supply expectations. The November 4 refunding announcement is the next key focal point.

marsbit36 dk önce

US Treasury Survey Fails to Signal Debt Issuance Cuts, Treasury Yields Rise, 10-Year Back Above 5.12%

marsbit36 dk önce

Chainalysis Report: The $3 Trillion North American Crypto Landscape, AI and Stablecoins Reshaping Global Finance

Chainalysis’s 2026 North America report shows the region remains the world’s dominant crypto market, with $3.02 trillion in on-chain economic value over the year ending July 1, 2026. The U.S. accounts for $2.78 trillion, down 2.2% in a cyclical adjustment, while Canada grew 2.3% to over $247.7 billion. Three shifts stand out: AI agent commerce, dollar stablecoin exports, and tokenized real-world assets. The U.S. leads AI agent payments, with Base’s x402 protocol surpassing 138 million transactions and 88.1% of model-inference share. Micro-payments between machines are becoming viable, with most x402 transactions between $0.01 and $0.10. Wallet behavior shows rising stickiness: 89.3% of new wallets received a second funding within 30 days in Q2 2026, and the median time from funding to first payment fell from 73 days to 18 minutes. China-linked wallets dominate security and code analysis at 90%, while the U.S. leads inference and agent frameworks. Capital flows show the U.S. importing bitcoin and exporting digital dollars: large institutional bitcoin inflows totaled 53,200 BTC, while USDC circulation reached $73.3 billion and quarterly on-chain settlement hit $14.8 trillion. Tokenized U.S. Treasuries dominate RWA at $15.42 billion, 42.8% of the total, with overseas retail buyers prominent. Canada emerges as the G7’s top P2P market, driven by immigrants; stablecoin remittances to India, China, and the Philippines reached $2.36 billion, up 141%. Overall, the U.S. builds infrastructure while the world adopts it.

marsbit1 saat önce

Chainalysis Report: The $3 Trillion North American Crypto Landscape, AI and Stablecoins Reshaping Global Finance

marsbit1 saat önce

İşlemler

Spot
活动图片