Bitcoin ETF inflows hit $3.8B in strongest three-week stretch of 2026

cointelegraph2026-09-05 tarihinde yayınlandı2026-09-05 tarihinde güncellendi

Özet

US-listed spot Bitcoin ETFs recorded their strongest three-week inflow stretch of 2026, attracting $3.8 billion as Bitcoin traded near $80,000. Total net assets reached $101.3 billion. This marks a sharp turnaround from earlier outflows, though year-to-date flows remain slightly negative. Daily inflows cooled to $174.6 million on Friday, led by BlackRock's IBIT, after a surge the previous day. Concurrently, inflows into US spot Ether and XRP ETFs fell significantly compared to the prior week. Despite this slowdown, both Ether and XRP ETFs maintain positive net inflows for the year.

US-listed spot Bitcoin exchange-traded funds (ETFs) have recorded their strongest three-week inflow stretch of 2026 as Bitcoin traded around $80,000.

The funds attracted $986.9 million in the week ending Friday, bringing net inflows over the past three weeks to $3.8 billion, according to SoSoValue data.

Total net assets across the funds stood at $101.3 billion on Friday after briefly rising to $103.3 billion a day earlier, while cumulative net inflows reached $55.6 billion.

ETF demand marks a sharp turnaround from heavy outflows earlier in 2026, though year-to-date net flows remain roughly $1 billion negative.

Bitcoin ETF inflows cool after Thursday surge

US spot Bitcoin ETFs attracted $174.6 million in net inflows on Friday, down sharply from the nearly $731 million recorded a day earlier.

BlackRock’s iShares Bitcoin Trust (IBIT), the largest spot Bitcoin ETF by assets, drew $117.4 million on Friday, accounting for about 67% of the day’s total net inflows, according to Farside Investors data.
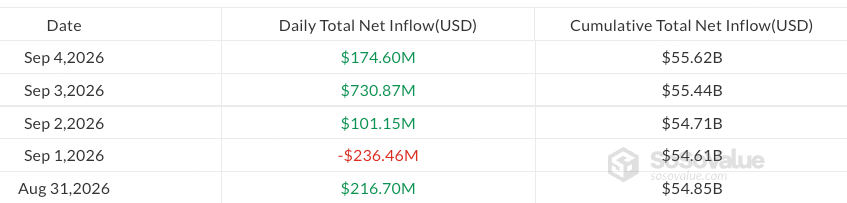
Daily spot Bitcoin ETF flows from Monday through Friday. Source: SoSoValue

Fidelity’s Wise Origin Bitcoin Fund (FBTC) was the only other fund to record net inflows, attracting $57.2 million, while all other US spot Bitcoin ETFs recorded no net flows for the day.

Related: Surprise nonfarm payrolls print sends Bitcoin back below 80K

The slowdown came as Bitcoin fell from around $81,200 to briefly below $79,000 on Friday. Bitcoin traded at $79,716 at the time of publication, still up about 2.6% over the past seven days, according to CoinGecko.

Bitcoin ETF demand strengthens as Ether, XRP flows fade

Compared with the previous week, Bitcoin ETF inflows increased about 7%, while inflows into US spot Ether and XRP ETFs fell about 74% and 83%, respectively.

Spot Ether ETF inflows dropped to $218.4 million from $824.4 million, while XRP ETF inflows declined to $19 million from $110.5 million, according to SoSoValue.

Despite weaker inflows, Ether and XRP ETFs remain in positive territory for the year. US spot Ether ETFs have recorded about $863 million in net inflows year-to-date, while XRP ETFs have attracted roughly $515 million.

Magazine: BTC will hit $1M by 2030... but Arthur Hayes is buying ETH instead

İlgili Sorular

QWhat was the total net inflow for US-listed spot Bitcoin ETFs over the strongest three-week stretch of 2026?

AThe total net inflow for US-listed spot Bitcoin ETFs over the strongest three-week stretch of 2026 was $3.8 billion.

QWhich specific Bitcoin ETF accounted for the majority of net inflows on Friday, and how much did it attract?

ABlackRock’s iShares Bitcoin Trust (IBIT) accounted for the majority of net inflows on Friday, attracting $117.4 million, which was about 67% of the day's total.

QHow did the weekly net inflows into Bitcoin ETFs compare to those of Ether and XRP ETFs in the same period?

ACompared to the previous week, Bitcoin ETF inflows increased about 7%. In contrast, inflows into US spot Ether ETFs fell about 74% and inflows into XRP ETFs fell about 83%.

QWhat were the cumulative net inflows for US spot Bitcoin ETFs as of the Friday mentioned in the article?

AAs of the Friday mentioned in the article, the cumulative net inflows for US spot Bitcoin ETFs reached $55.6 billion.

QWhat is the year-to-date net flow status for Bitcoin ETFs despite the recent strong three-week inflow stretch?

ADespite the recent strong three-week inflow stretch, the year-to-date net flows for Bitcoin ETFs remain roughly $1 billion negative.

İlgili Okumalar

After a Year of Farming Points, Why Am I Still Losing Money? — The Complete Guide to Avoiding Getting Rekt in Crypto Points Programs

**Title: Why Do You Still Lose Money After Grinding Points for a Year? A Complete Guide to Avoiding "Rug Pulls" in Crypto Points Programs** This article systematically analyzes crypto points farming programs and outlines a framework to assess their true profitability and avoid losses. It argues that while points offer new yield opportunities, their growing complexity often hides significant costs and risks. The author first examines the incentives from a project's perspective: points allow projects to attract liquidity and activity while deferring actual reward payouts. Ten common points-earning models are then detailed, each with its hidden "traps": 1. **Interaction Tasks:** Low capital but high gas/time costs and disqualification risks. 2. **TVL Deposits:** Easy but overlooks high opportunity costs vs. alternative yields. 3. **Lending Points:** Looping strategies amplify points but also risk and debt costs. 4. **LP Providing:** Attractive APRs can still underperform simply holding the assets due to impermanent loss. 5. **Pendle YT:** Offers high points leverage but carries time decay; the purchase price must be justified by future rewards. 6. **Perp Trading Volume:** High volumes generate large fees/slippage, often exceeding potential rewards. 7. **Spot Trading:** Costs hide in spreads, fees, and required token holdings that may depreciate. 8. **Social/Content:** Efficient for creators but time/effort should be valued. 9. **Referral/Community:** Rewards need separation from real income; carries reputational risk. 10. **Staking/Locking:** High multipliers come with lost liquidity and inability to exit during downturns. A core section explains how to value points. The theoretical value depends on Fully Diluted Valuation (FDV), the reward pool's token allocation, the user's share of total points, and vesting/listing conditions. Models should run optimistic, baseline, pessimistic, and zero-airdrop scenarios. The true cost of farming includes direct costs (gas, fees), opportunity costs (forgone yield), strategy P&L (e.g., IL, YT decay), liquidity costs, and tail risks (hacks, depegs). The article stresses calculating both absolute net profit and relative excess return versus a comparable baseline strategy. Five case studies illustrate break-even analyses for deposit, YT, lending loop, perp trading, and LP strategies, showing how easily costs can outweigh rewards. Seven red flags indicate higher "rug pull" risk: 1) Promising high multipliers without clear reward pool size, 2) Repeatedly extending seasons inflating total points, 3) Frequently changing rules, 4) Growth solely reliant on subsidies, 5) Large incentive disparities between user groups, 6) Valuations overly dependent on hype, 7) Complex/illiquid exit mechanisms. The guide concludes with a framework for prudent participation: categorize projects by risk, set clear exit conditions before entering, manage points strategies within a broader portfolio context, and use a scoring system for quick evaluation. A final 10-question checklist helps vet any new points program. The key insight is that as capital scales, securing reliable baseline yield becomes more valuable than chasing uncertain points rewards. Mature players must learn to pass on high-cost, high-risk opportunities, focusing instead on strategies with clear costs, controllable risks, and manageable exits.

marsbit51 dk önce

After a Year of Farming Points, Why Am I Still Losing Money? — The Complete Guide to Avoiding Getting Rekt in Crypto Points Programs

marsbit51 dk önce

Breaking News: Claude Fable 5.5 Appears on Azure, Directly Challenging Google's New Model

Claude Fable 5.5, a highly anticipated AI model from Anthropic, has reportedly appeared as "Generally Available" in Microsoft Azure's model directory, signaling an imminent public release. This launch is seen as a strategic move to challenge Google's newly released Gemini 4 Argon. Leaked specifications suggest Fable 5.5 boasts a massive 1 million token context window and a 128k token output length, with API pricing at $10 per million tokens for input and $50 for output. Early tests hint at extraordinary capabilities. The model allegedly generated a playable MMORPG in 5 hours, created 3D animations to explain complex mathematical proofs, and autonomously produced a stylized animated short film, raising questions about the future of dedicated video generation models. Some evidence suggests it might be powering certain high-complexity queries currently routed through Claude Opus 5.5. A key revelation comes from an Anthropic engineering blog, which indicates the company's development pace has accelerated dramatically, with daily code merges increasing from 2,500 to over 30,000. This suggests Fable 5.5 may have been significantly developed through AI-driven, autonomous iteration—essentially, AI building AI. While enthusiasts hail it as a potential market leader, others note its premium pricing. The model's impending release intensifies the competition among major AI labs, with OpenAI also rumored to be preparing a new model. The industry awaits to see if Fable 5.5 can deliver a breakthrough significant enough to justify its cost and hype.

marsbit59 dk önce

Breaking News: Claude Fable 5.5 Appears on Azure, Directly Challenging Google's New Model

marsbit59 dk önce

İşlemler

Spot
活动图片