Renowned analyst Peter Brandt has unveiled a new set of Bitcoin price targets that have quickly sparked discussion across trading communities. His updated technical roadmap comes as BTC shows signs of cooling, prompting traders to reassess its recent price movement. With Bitcoin slipping beneath the structure that supported its multi-month climb, Brandt’s projected corrective zones have become a central focus in the market’s debate over where the asset may be headed next.
Bitcoin Price’s Structural Breakdown Raises The Stakes For Crypto Traders
In a recent post on X, Brandt outlined his latest outlook, highlighting a completed five-leg advance — a classic sequence often linked to trend exhaustion when price stretches too far without meaningful resets. In this case, the formation appears as a rising wedge, a pattern known for producing sharp shifts once its lower boundary is breached. That breach has now happened, marking what Brandt interprets as a structural turning point rather than a panic-driven drop.
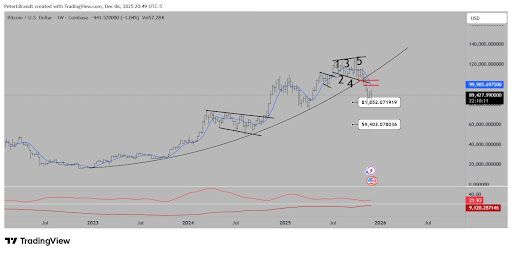
From the breakdown, two corrective regions emerge: near $81,852 and $59,403. These targets are drawn directly from the proportions of Bitcoin’s recently completed structure, giving them a grounded, technical foundation. Brandt frames the pullback as a normalization event, one that fits neatly into Bitcoin’s historical rhythm of expansions followed by methodical cooldowns. Instead of portraying the situation as a threat to long-term strength, the analysis positions the zones as potential resting points where the market could stabilize before setting its next course.
There is also a familiar pattern echoing through the charts — a reminder of late 2021, when sentiment surged ahead of structural reality and the market eventually recalibrated. While conditions today are not identical, the resemblance underscores how expectations and chart formations often move in parallel. In both scenarios, a strong run gave way to a controlled corrective period.
Brandt’s roadmap follows a clear sequence: formation completion, slope-line violation, and defined landing zones. Each step reinforces the next, forming a cohesive narrative that explains why this chart has quickly gained traction among crypto traders monitoring short-term volatility.
Brandt’s Targets Offer Strategic Guidance For Crypto Traders
Bitcoin is currently trading at $90,175, reflecting a 1.9% dip over the past 24 hours alongside a 4.4% gain across the last seven days. The price sits close to the level where the structural break first appeared, amplifying interest in Brandt’s outlined targets. Traders are now assessing whether the asset is preparing for a deeper corrective sweep or simply entering a consolidation phase before another directional move.
Ultimately, Brandt’s targets are intended to guide traders rather than alarm them. They highlight likely equilibrium zones during routine market resets, offering reference points where Bitcoin could stabilize after extended rallies. By framing the analysis this way, traders are encouraged to approach the market with a measured strategy and sharper precision, rather than reacting impulsively to short-term fluctuations.