The "Number Game" Behind Trillion-Dollar Valuations: OpenAI and Anthropic's Revenue Can't Be Compared Directly

marsbitPublished on 2026-10-11Last updated on 2026-10-11

Abstract

"Valuation Game in Trillions: The 'Digital Metrics Play' Behind OpenAI and Anthropic's Incomparable Revenues" Investors face significant uncertainty as core financial metrics from the two AI giants, OpenAI and Anthropic, cannot be compared directly due to differing accounting methods. OpenAI projects its annualized revenue run rate (ARR) to reach or exceed $70 billion by year-end, while Anthropic announced in July that its ARR had hit $65 billion. However, a key discrepancy renders these figures incomparable: Anthropic records the total sales value generated through cloud partners like Amazon as revenue, whereas OpenAI only counts its net share from partners like Microsoft. This reporting difference has tangible market impact. A recent tech stock downturn was partly attributed to investor attempts to adjust OpenAI's numbers for a direct comparison, leading to lower estimates and concerns about its growth pace. Currently, OpenAI's ARR is reportedly around $50 billion, with expectations to approach $70 billion by December. The issue highlights broader concerns about ARR as a non-standardized, often manipulated metric used to showcase growth and justify high private valuations. It is calculated by extrapolating short-term performance or summing contract values, offering companies considerable discretion. A significant gap exists between ARR and actual recognized annual revenue: OpenAI expects 2026 revenue of roughly $35 billion (half its year-end ARR projection), and internal...

Author: Wall Street Insights

When the core financial metrics of two AI giants cannot be compared apples to apples, investors are facing a fog of information.

OpenAI expects its annualized revenue to reach or exceed $70 billion by year-end, while Anthropic announced in July this year that its annualized revenue had already reached $65 billion. However, according to a Bloomberg report on October 10, these two numbers cannot be compared directly—the two companies use drastically different methodologies for the same metric.

Anthropic counts the total sales generated through cloud partners like Amazon as revenue, while OpenAI only counts its net revenue share from partners like Microsoft. This means OpenAI's figures may appear significantly lower on paper than Anthropic's, but this does not indicate its actual business scale is lagging.

This methodological difference has already had a tangible impact on the market. Tech stocks fell on Thursday, partly because after investors attempted to adjust OpenAI's figures to a methodology comparable with Anthropic's, they arrived at lower estimates, sparking concerns about OpenAI's revenue growth rate.

Bloomberg previously reported that OpenAI's current annualized revenue is approximately $50 billion, lower than the $70 billion cited by some media earlier, but the company expects to approach the latter by year-end. With neither company publicly releasing standardized financial statements, annualized revenue has become a key metric for the market to judge whether the trillion-dollar AI boom can materialize—but it is also a severely flawed metric.

The Methodological Divide: Same Metric, Two Calculations

The root cause of the incomparability lies in the fundamental difference in how revenue is recognized.

Anthropic views cloud platforms like Amazon as distribution channels for its products and therefore includes the gross sales generated through these channels in its revenue. OpenAI uses the net method, only including its actual share of revenue from partners like Microsoft in its statistics.

According to reports, investors have tried to re-calculate the numbers from both companies to achieve comparability, but ultimately concluded that: existing information is insufficient to support an accurate conversion. Aswath Damodaran, a finance professor at NYU Stern School of Business, stated that as long as companies are consistent within their own methodologies, using either gross or net revenue recognition is acceptable in principle; the key is providing maximum clarity for investors.

The Limitations of ARR: A Non-Standardized "Growth Story"

Annualized Recurring Revenue (ARR) itself is a metric with significant elasticity and is easily distorted.

Annualized Recurring Revenue, also known as Annual Revenue Run Rate, is calculated by extrapolating a short period's performance (like a month or quarter) to a full year or by summing the contract value for the next 12 months. The report notes that companies have considerable discretion in determining this number, and it is prone to significant distortion if future sales do not materialize.

Damodaran compares this excessive focus on ARR to "looking at a kindergarten report card," and bluntly states: "The fact that we are focusing on ARR itself is already off track."

More notably, there is a significant gap between annualized revenue and the actual full-year revenue a company recognizes.

According to the report, informed sources revealed that OpenAI currently expects actual full-year revenue for 2026 to be around $35 billion, only half of its year-end annualized revenue projection. A similar gap exists for Anthropic: documents seen by Bloomberg show that the company's actual revenue for 2025 was about $4.6 billion, while its publicly announced annualized revenue at that time had already exceeded $9 billion.

Market Impact: The Black Box Effect Puts Pressure on Investors

In the absence of standardized financial disclosures, the revenue figures of these two companies have become a barometer for the entire AI investment narrative, and their uncertainty is transmitting to the broader market.

Janney Montgomery Scott's chief investment strategist Mark Luschini said: "When a market participant of this importance is somewhat of a black box, investing becomes very difficult." He noted that any uncertainty about the business prospects of OpenAI and Anthropic "adds another layer on top of the doubts that already exist and are churning in the market."

The report points out that as the tech stock rally drives stock indices near historic highs, any sign of a sales slowdown from these two companies could ripple across the broader market and upend expectations for companies benefiting from the AI investment wave, such as chipmakers.

OpenAI and Anthropic are not the only AI companies emphasizing ARR. In the current boom, an increasing number of star startups are using this metric to showcase growth and support their lofty private market valuations. Damodaran believes that the debate over the technical details of ARR essentially avoids a more fundamental question: what scale of real sales do these two companies need to generate to cover their massive expenditures and support valuations exceeding $1 trillion.

The report also notes that with Anthropic poised to go public on Wall Street, this situation of information asymmetry may usher in a turning point.

Once both companies complete their IPOs, investors will gain access to financial statements prepared in accordance with Generally Accepted Accounting Principles (GAAP). At that point, the reference value of the non-standardized ARR metric will significantly diminish, and the market's assessment of the two companies' true financial health will be built on a much firmer foundation.

Related Questions

QWhy can't OpenAI and Anthropic's annualized revenue numbers be directly compared?

AThey use fundamentally different accounting methods. Anthropic records the total gross sales generated through cloud partners like Amazon as revenue, while OpenAI only records the net share of revenue it receives from partners like Microsoft.

QWhat is a key limitation of the Annualized Revenue (ARR) metric highlighted in the article?

AARR is a non-standardized, forward-looking metric that companies have significant discretion in calculating. It can easily become distorted if future sales don't materialize, and there is often a substantial gap between ARR and the revenue a company will actually recognize for a full fiscal year.

QHow did the discrepancy in revenue reporting between OpenAI and Anthropic reportedly impact the market?

AIt contributed to a sell-off in tech stocks. When investors attempted to adjust OpenAI's numbers to match Anthropic's gross revenue口径, they arrived at lower estimates, which fueled concerns about OpenAI's revenue growth rate and added to market uncertainty.

QAccording to the article, what might change the current situation of information asymmetry for investors?

AIf and when these companies go public, the situation could improve. An IPO would require them to provide standardized financial statements under Generally Accepted Accounting Principles (GAAP), which would make the non-standard ARR metric less critical and give investors a firmer basis for analysis.

QWhat fundamental question does the debate over ARR technicalities avoid, according to finance professor Aswath Damodaran?

AThe debate avoids the more fundamental question of how large the real sales need to be for these companies to cover their massive expenditures and justify valuations exceeding one trillion dollars.

Related Reads

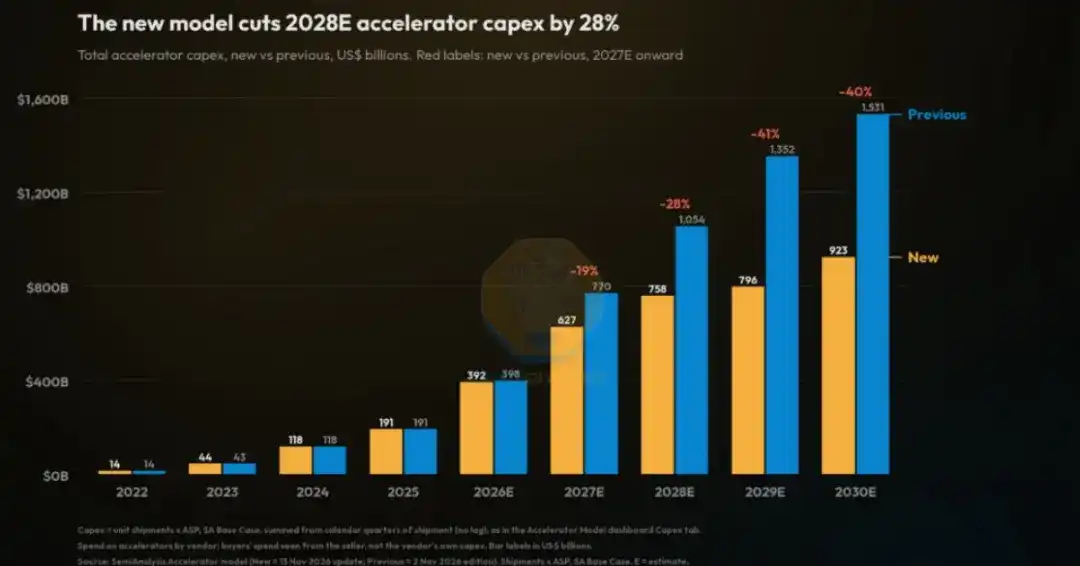
SemiAnalysis Slashes AI Compute Capex Forecast Again: 2029 Cut by 41%, 2030 Down to Only $923 Billion

Semiconductor research firm SemiAnalysis has sharply cut its forecasts for global AI accelerator capital expenditure, shipments, HBM demand, and power demand in its latest model update. The most significant revisions affect 2028–2030: capex forecasts are lowered by 28% for 2028 and by 41% and 40% for 2029 and 2030, respectively. Under the new model, global AI accelerator capex in 2030 falls to $923 billion from the previously projected $1.531 trillion—a reduction of $608 billion. Cumulative accelerator logic silicon wafer shipment area for 2026–2030 is cut by 17%, with Nvidia accounting for 66% of the reduction. The revisions stem from three factors: slowing AI revenue growth, as frontier AI labs saw declining growth in new annual recurring revenue in Q3, prompting reassessment of whether token revenue can cover high computing costs; tighter financing conditions, with debt and equity investors more cautious about projects lacking long-term procurement commitments from cloud providers; and intensifying U.S. regulatory and grid-connection constraints, with 5.8 GW of data centers expected to come online between H2 2027 and H1 2028 facing delays. The impact is uneven across the supply chain. Nvidia is hit hardest, with shipment forecasts cut substantially and average selling price assumptions for its next-generation Feynman series significantly lowered—Feynman from about $110,000 to $78,000, and Feynman Ultra from about $175,000 to $98,000—indicating competition is shifting from capacity to cost-effectiveness, with TPU, Trainium, and AMD GPUs eroding Nvidia's pricing power. Global HBM shipments for 2028 are cut 30%, and AI accelerator power demand for 2030 is cut 34%. This does not mean storage and power lose value; rather, the chain is shifting from grabbing capacity and power to allocating capacity based on returns. For the market, this correction looks like an early de-bubbling calibration. Previously, AI capex was seen as a one-way upward curve, but it is actually shaped by revenue validation, financing constraints, grid connections, chip efficiency, and competition. Key indicators to watch include cloud capex guidance, accelerator order visibility, HBM contract prices, data center grid-connection queues, and the share of inference workloads in total compute. If inference demand keeps growing, unit compute costs fall, and utilization improves, the chain will still find structural support; if long-term project returns prove hard to validate, further downward revisions remain possible. The global AI compute sector is undergoing a painful valuation correction. It is still unclear whether this phase is over—valuations may not look cheap if forecast parameters in valuation models have not been revised down in tandem. The best approach is to wait patiently for the market to clear itself. Market inertia often overshoots: if valuations are pushed to extreme lows and leveraged funds and sellers are cleared out while short positions sit at historic highs, a sharp rebound could follow. When that opportunity arrives is up to the market.

marsbit2m ago

SemiAnalysis Slashes AI Compute Capex Forecast Again: 2029 Cut by 41%, 2030 Down to Only $923 Billion

marsbit2m ago

Democrats Win Both Chambers, Trump's Business Alliance Begins to Crack

After Democrats won both chambers of Congress in the November 2026 midterms, the first shift was not in legislation but in how markets view business-government ties. Before the new Congress takes office on January 3, 2027, Democrats can prepare investigations and demand document preservation, though subpoena power comes later. Current pressure includes congressional oversight, board probes and civil suits—not criminal convictions. Trump retains veto power, and Democrats lack a two-thirds majority, so investigation becomes the key tool. Musk was asked by two Democratic senators to preserve Starlink and Starshield records, including communications with the White House and Pentagon; House Democrats also plan to examine DOGE cuts, SpaceX contracts and conflicts of interest. Nvidia announced on November 12, 2026 that Jensen Huang resigned as CEO and director, with CFO Colette Kress interim CEO and Harvey Jones as first board chair; reports of a possible return remain unconfirmed. Nvidia shares fell about 20% from October 30 to November 13. Democrats also plan to investigate the Trump family's crypto business, World Liberty Financial and related deals, while the CLARITY Act stalled in the Senate. Markets are starting to price the value of political protection that may not survive election cycles, with capital shifting toward AMD, Broadcom, custom chips and compliant financial institutions.

marsbit2m ago

Democrats Win Both Chambers, Trump's Business Alliance Begins to Crack

marsbit2m ago

Former Uniswap Engineering Director at the Helm, Metric Monthly Trading Volume Exceeds $8 Billion

Metric, a DEX led by former Uniswap Labs Engineering Director Christos Gkolias as CTO, surpassed $8 billion in trading volume in its first month, with over $600 million in daily volume, despite having only about $25 million in TVL. Metric focuses on tokenized stocks, major crypto assets, and stablecoins. Unlike traditional AMMs that derive prices from pool ratios, Metric separates pricing from liquidity provision, allowing pools to update quotes based on external references such as Chainlink and Pyth oracles or custom strategies, keeping liquidity near market prices. LP funds are placed in price ranges called Bins that automatically shift with the reference price, so capital stays active without manual redeployment, enabling small TVL to support large cumulative volume. Large trades still incur price impact as liquidity is consumed across bins. Metric also introduced Markout APR to compare execution prices against later reference prices, reminding LPs that more volume does not guarantee more profit. A points campaign launched October 15 distributes 1 million points weekly for trading, providing liquidity, managing pools, and referrals, with early users earning retroactive rewards. Users can earn points through spot trading via Metric's flagged routes or by providing liquidity in pools, though high APR must be weighed against trading losses and price changes. Referrals offer up to 10% point bonuses once bound.

marsbit5m ago

Former Uniswap Engineering Director at the Helm, Metric Monthly Trading Volume Exceeds $8 Billion

marsbit5m ago

Bridgewater's $23 Billion Portfolio Shake-Up: Embracing AI Hardware and Energy, Cutting Google and Amazon

Bridgewater Associates significantly reshaped its portfolio in the third quarter, concentrating on AI chip hardware and energy while cutting exposure to tech giants and traditional industrial stocks. According to Bloomberg's analysis of Bridgewater's 13F filing, the fund disclosed 974 positions worth $230 billion as of September 30. The firm substantially increased holdings in Qualcomm, AppLovin, and memory chip stocks Micron and SanDisk, while reducing stakes in Alphabet and Amazon and exiting industrial names such as Union Pacific. Healthcare saw the largest sector weight increase, while industrials saw the biggest decline. Among top holdings, State Street SPDR S&P 500 ETF Trust remained the largest at $2.595 billion (11% of the portfolio), followed by iShares Core S&P 500 ETF at $1.155 billion (about 5%). Nvidia ranked third at $614 million (about 2.7%), despite a reduction of about 1.178 million shares, remaining the most important single semiconductor holding. Broadcom followed at $462 million (about 2%), nearly unchanged, and Lam Research ranked fifth at $348 million (1.5%). On the buying side, Qualcomm saw the largest increase, up 716,000 shares to 878,000 shares, adding about $132 million in value. AppLovin Class A rose 536,000 shares to 683,000 shares, adding about $123 million. Micron gained 120,000 shares to 237,000 shares (about $118 million), and SanDisk added 66,000 shares to 66,800 shares (about $115 million). Qorvo was increased by over 1.037 million shares to 1.068 million shares, adding about $119 million. On the selling side, State Street SPDR S&P 500 ETF was cut by nearly 1.917 million shares (about $1.378 billion), and iShares Core S&P 500 ETF by 1.494 million shares (about $1.093 billion). Vanguard S&P 500 ETF fell 382,000 shares (about $261 million). Alphabet Class A was reduced by 862,000 shares to 460,000 shares (about $314 million), and Amazon by 1.055 million shares to 971,000 shares (about $241 million). Industrials saw the largest weight decline. Bridgewater fully exited Union Pacific, cutting 514,000 shares (about $140 million), the quarter's largest liquidation. Truck maker Paccar was also cleared, down 946,000 shares (about $114 million) amid an 8.6% price drop. Nutanix and S&P Global were fully exited as well. Healthcare received the biggest weight boost, with new positions in Medtronic and Jazz Pharmaceuticals (amounts not separately disclosed). In energy, Bridgewater opened a new 1.55 million-share position in Occidental Petroleum worth about $85.77 million and bought about 1.516 million shares of Dominion Energy worth about $91.76 million. New tech positions included Synaptics, Fortinet, and Cisco, valued at about $78.35 million, $75.41 million, and $71.2 million respectively.

marsbit5m ago

Bridgewater's $23 Billion Portfolio Shake-Up: Embracing AI Hardware and Energy, Cutting Google and Amazon

marsbit5m ago

Trading

Spot
活动图片