Authored by: GLC Research
Compiled by: Chopper, Foresight News
Hyperliquid and Lighter are two projects often compared in terms of revenue and valuation in the market. However, most comparisons lack strong reference value because each side selects data favorable to their own argument: one uses circulating supply, the other fully diluted supply; one counts fees, the other net profit; or uses one week's revenue data versus annual data.
This article adopts the same set of calculation standards for both tokens. Token supply uses the framework established by HSI and HRC (Note: HRC is the Hyperliquid Research Consortium, jointly initiated by institutions including Four Pillars and GLC Research; HSI is a digital asset treasury listed company focused on the Hyperliquid ecosystem and is one of the largest HYPE holders in the market). Profit data uniformly selects September 2026 monthly data and annualizes it. This article does not provide any long/short judgments on the tokens; its purpose is solely to show the valuation levels of the two projects when definitions and metrics are completely consistent.
Result: 43x vs 88x
Under unified metrics, Lighter's price-to-earnings (P/E) ratio is approximately twice that of Hyperliquid, at 88.1x and 43.3x respectively.
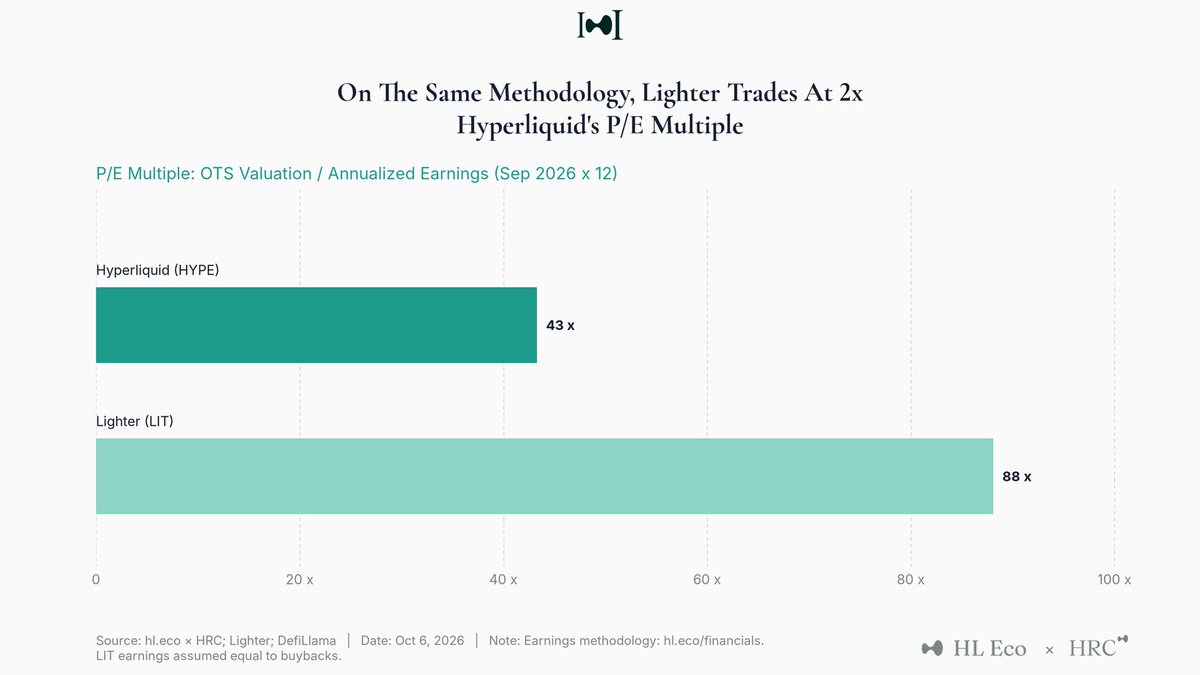
The P/E ratio here is derived by dividing the OTS valuation by the annualized earnings, where annualized earnings equal September 2026 earnings multiplied by 12.
Supply: Outstanding Token Supply (OTS)
This valuation entirely uses the OTS metric. OTS counts tokens that are already circulating or allocated to designated holders according to a public, fixed schedule. It sits between circulating supply and fully diluted supply, most closely resembling the equivalent concept of stock market capitalization.
Both tokens use exactly the same statistical rules:
- Include: Circulating tokens, plus team and investor allocation shares (even if still locked, counted in full)
- Exclude: Reserve tokens, such as future unreleased tokens, community rewards, ecosystem reserves
- Deduct: Burned tokens, tokens repurchased and retired per buyback policies
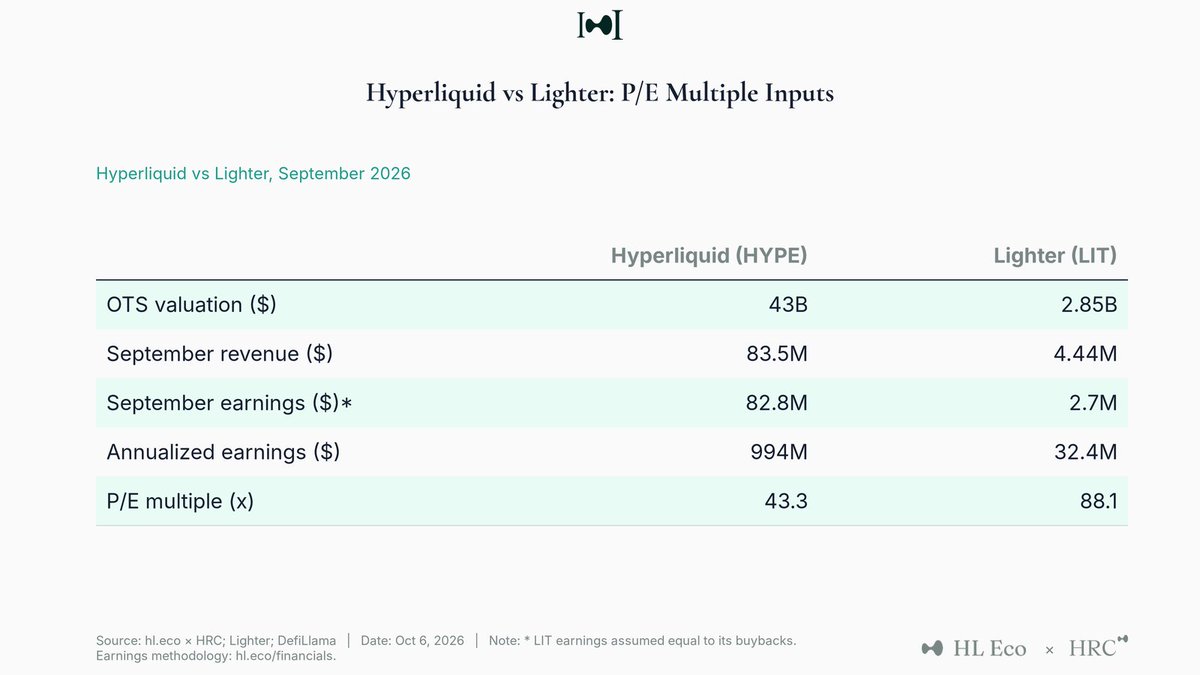
According to hl.eco data, Hyperliquid's OTS valuation is $43 billion.
Lighter's token distribution plan comes from team tweets: 50% ecosystem share (half airdropped at launch), 26% team share, 24% investor share. Team and investor tokens have a 1-year lockup, followed by a 3-year linear vesting period.
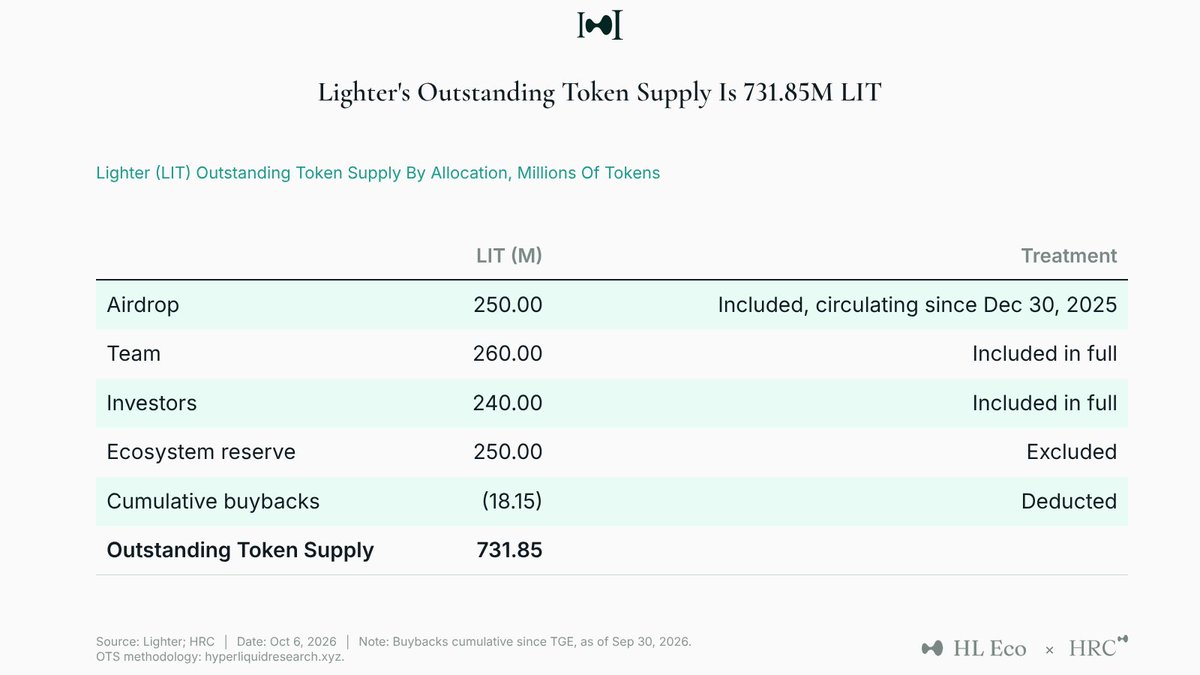
Calculated at the LIT price of $3.896 on October 6, 2026, Lighter's OTS valuation is $2.85 billion. According to team disclosure, Lighter has repurchased 18.15 million LIT since launch and burns the repurchased tokens. A portion is yet to be executed for burning, and this calculation has deducted them in full; consistent with the treatment of HYPE held by the Hyperliquid Rescue Fund, which is deducted immediately upon repurchase.
Both tokens undergo the same simplification: staking rewards and incentives already distributed from the ecosystem reserve are not counted in OTS. This portion is minimal relative to total supply, and this treatment aligns with the statistical approach for HYPE's future token releases and community rewards.
Earnings: Uniformly Using Same Month Data
Both projects' earnings data are taken from September 2026 and then annualized by multiplying by 12. A calendar month is chosen because Lighter discloses buyback data monthly.
Hyperliquid's earnings metric follows the financial framework established by hl.eco and HRC.
Revenue = Trading fees after deducting developer and deployer shares + Priority fees + HyperEVM Gas fees + Auction burn proceeds + USDC reserve interest.
Earnings = Revenue - Fee share paid to HLP.
September revenue was $83.5 million, earnings were $82.8 million, annualized earnings $994 million. No team or shareholders take a cut; earnings are returned to HYPE holders via buyback and burn.
Lighter does not directly disclose earnings data. This article uses the buyback amount as the closest proxy. According to team disclosure, Lighter's total September revenue was $4.44 million, with 597,200 LIT repurchased. The average price for the month was $4.52, corresponding to a buyback amount of $2.70 million, annualized to $32.4 million.
The September buyback size nearly equals the $2.72 million revenue generated by Lighter's core business, with the remaining $1.72 million revenue coming from Robinhood Chain operations.
Conclusion Boundaries: What It Can and Cannot Explain
This comparison only indicates that, based on current annualized earnings, the market is paying approximately twice the valuation for every $1 of Lighter's earnings compared to Hyperliquid.
But this does not mean either token is mispriced. The P/E ratio reflects market expectations for growth, profit margins, and risk, which single-month earnings data cannot fully capture. A higher P/E can be supported by higher expected growth rates; a lower P/E often corresponds to a larger, more mature earnings base. The research team itself holds views on this, but this article makes no such judgments, only presenting the valuation multiples based on September data.
Three limitations of this article should be noted:
- Lighter's earnings are an approximation; buyback amount is only a proxy. If Lighter retains part of its revenue (e.g., Robinhood Chain fees), its actual earnings would be higher, and its P/E would be lower. If using total revenue instead of buyback amount, the P/E would be approximately 54x.
- Short sample window: Both protocols use September single-month data annualized, maintaining uniform comparison metrics, but single-month performance may be above or below long-term trends.
- Reserve distributions excluded: Distributed ecosystem reserve rewards for both tokens are not included in OTS. If included, both valuations would increase slightly.