Your Backtest Is Lying: Why You Must Use Point-in-Time Data

insights.glassnodePublicado em 2026-03-13Última atualização em 2026-03-13

Resumo

This article warns against a common pitfall in backtesting trading strategies: look-ahead bias caused by using revised historical data. It illustrates this with a hypothetical Bitcoin strategy based on exchange outflows from Binance. The strategy is built on the premise that sustained outflows (when the 5-day moving average of BTC balance falls below the 14-day average) are bullish, while inflows signal a sell-off. An initial backtest using standard, revised data shows the strategy performing comparably to a simple buy-and-hold approach. However, the author argues these results are misleading because the data has been updated with information that wasn't available in real-time. This data mutation creates an unfair advantage in the backtest. To demonstrate, the test is rerun using Point-in-Time (PiT) data—an immutable, append-only record that reflects only what was known on any given day. The results are significantly worse, as the PiT-based strategy misses key profitable moves. The key takeaway is that accurate backtesting requires immutable Point-in-Time data to avoid look-ahead bias and replay history honestly.

Let's build a simple, hypothetical trading strategy. The premise is straightforward and rooted in a widely discussed narrative: when coins leave exchanges, it tends to be bullish. The reasoning is intuitive: coins moving off exchanges typically signal that holders are withdrawing to self-custody, reducing the available supply for selling. Conversely, coins flowing onto exchanges may indicate that holders are preparing to sell.

A single day of outflows, however, is just noise. To identify a genuine trend, we would apply a moving average crossover on the exchange balance. When the short-term average falls below the long-term average, it confirms that coins have been leaving exchanges consistently, as a sustained pattern, rather than isolated events.

Using Glassnode's exchange balance for Binance, we define the following:

  • Enter the market when the 5-day moving average of Binance's BTC balance falls below its 14-day moving average, signaling a sustained outflow trend.
  • Exit the market when the 5-day average rises back above the 14-day average, signaling that the outflow trend has reversed and coins are returning to the exchange.

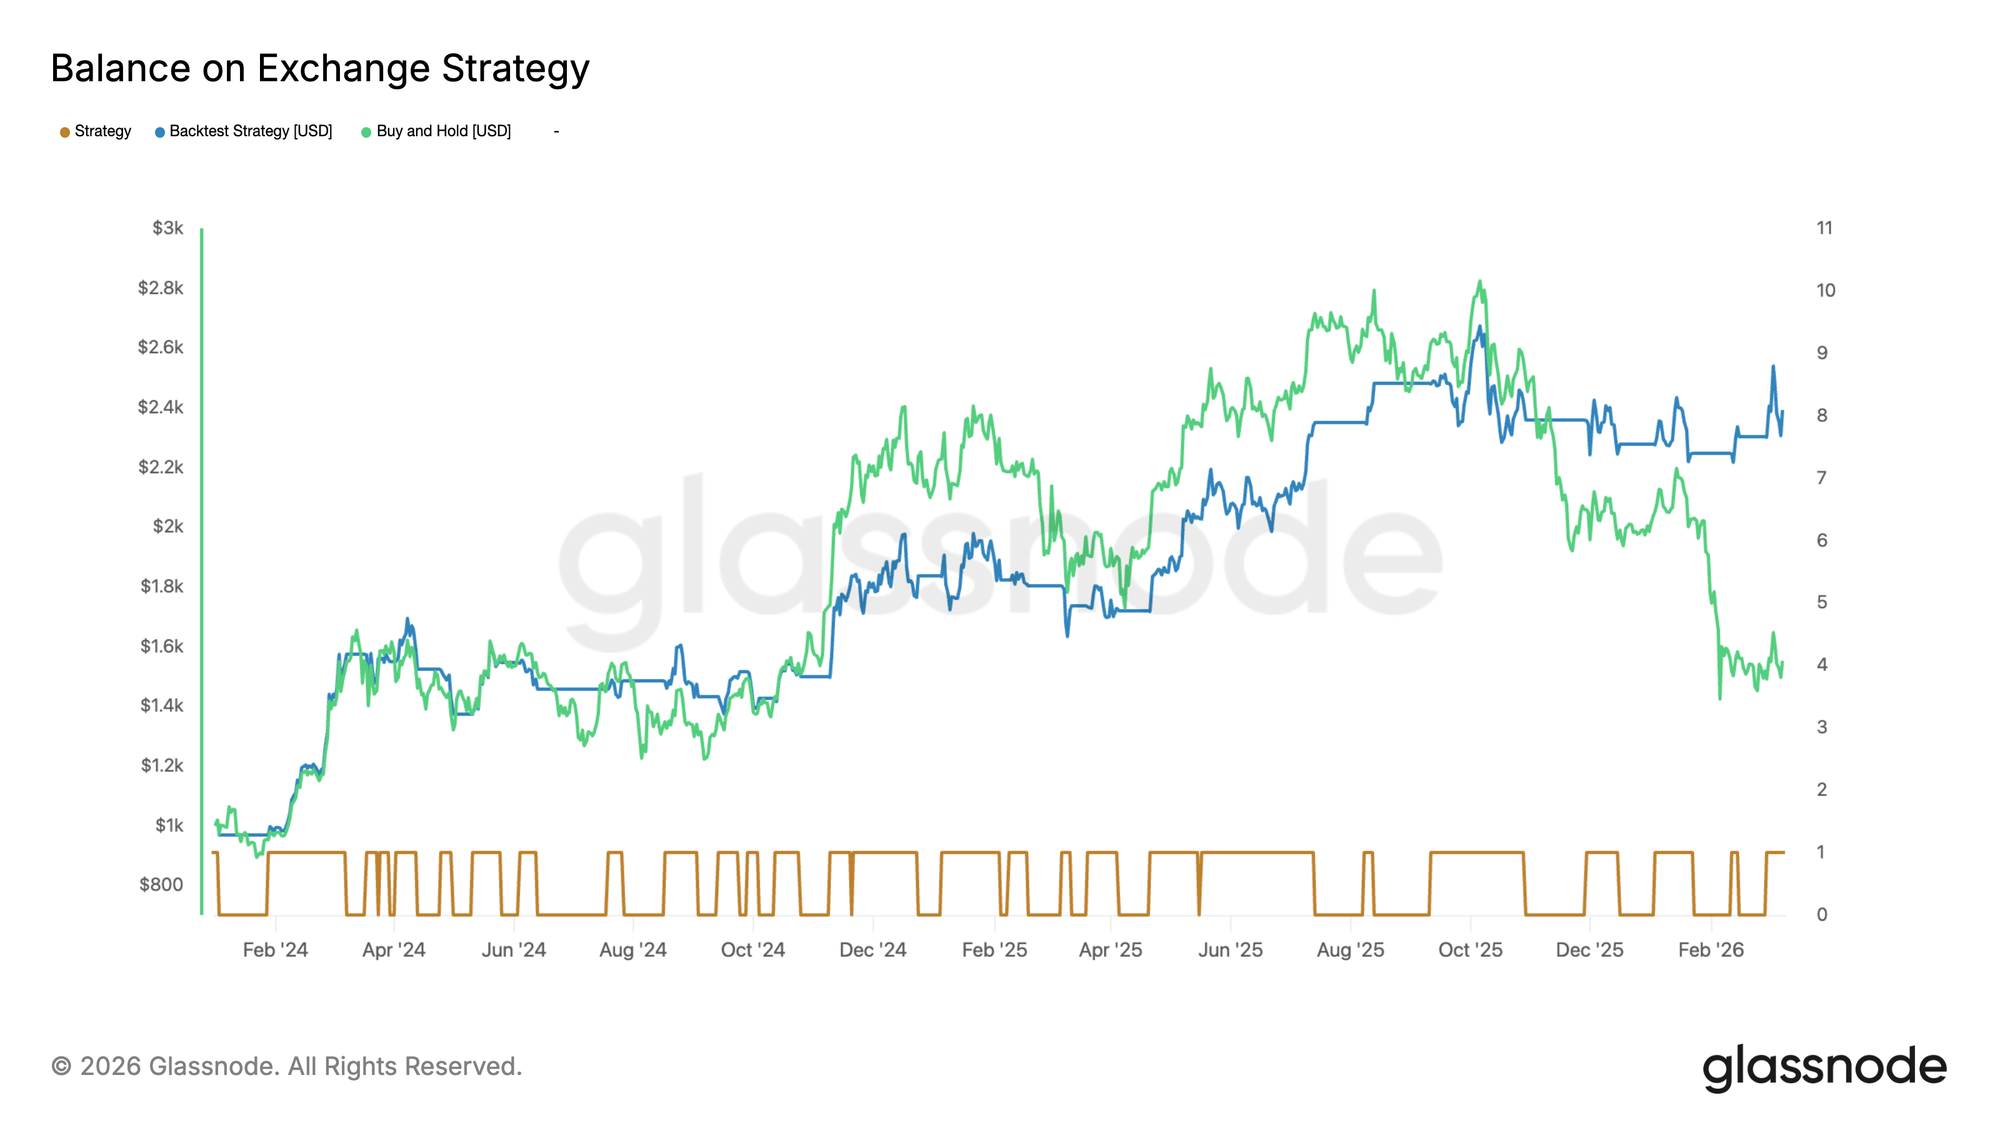
We then benchmark this strategy against simply holding BTC over the same period, starting January 1, 2024 through March 9, 2026, with an initial capital of $1,000 and 0.1% trading fees applied to each trade.
This is a simplified trading strategy, designed primarily for illustrative purposes. It is not investment advice, nor is it meant to suggest that exchange balances are a robust foundation for a trading system.
Access live chart

Here's how to read this chart:

🟫 The brown line at the bottom is the binary trading signal, toggling between in the market (1) and out of the market (0).

🟦 The blue line tracks the strategy's portfolio value over time.

🟩 The green line is the buy-and-hold portfolio benchmark.

We can observe that the exchange balance strategy performed reasonably well, although at times the buy-and-hold strategy outperformed it. In the final days of the research period, however, the exchange balance strategy caught up. While some investors may find the combination of reduced volatility and an ultimately comparable performance to buy-and-hold appealing, the final numbers are misleading – and here’s why.

The Problem: Data Mutation and Look-Ahead Bias

Metrics are not static. Many are retroactively revised as new information becomes available. This is particularly true for metrics that depend on address clustering or entity labeling, such as on-chain exchange balances. However, it is also the case for metrics such as trading volume or price, as individual exchanges can occasionally submit their data with slight delays.

This means that a value you see today for, say, January 15, 2024, may not be the same value that was published on January 15, 2024. The data has been revised with hindsight. When you backtest a strategy on this revised data, you are implicitly using information that was not available at the time the trading decisions would have been made. This introduces a look-ahead bias.

The Honest Backtest: Using Point-in-Time Data

Let's therefore repeat the exact same backtest – same signal logic, same parameters, same dates, same fees – but this time using the Point-in-Time (PiT) variant of the Exchange Balance metric, available in Glassnode Studio.

PiT metrics are strictly append-only and immutable. Each historical data point reflects only the information that was known at the time it was first computed. No retroactive revisions, no look-ahead bias.

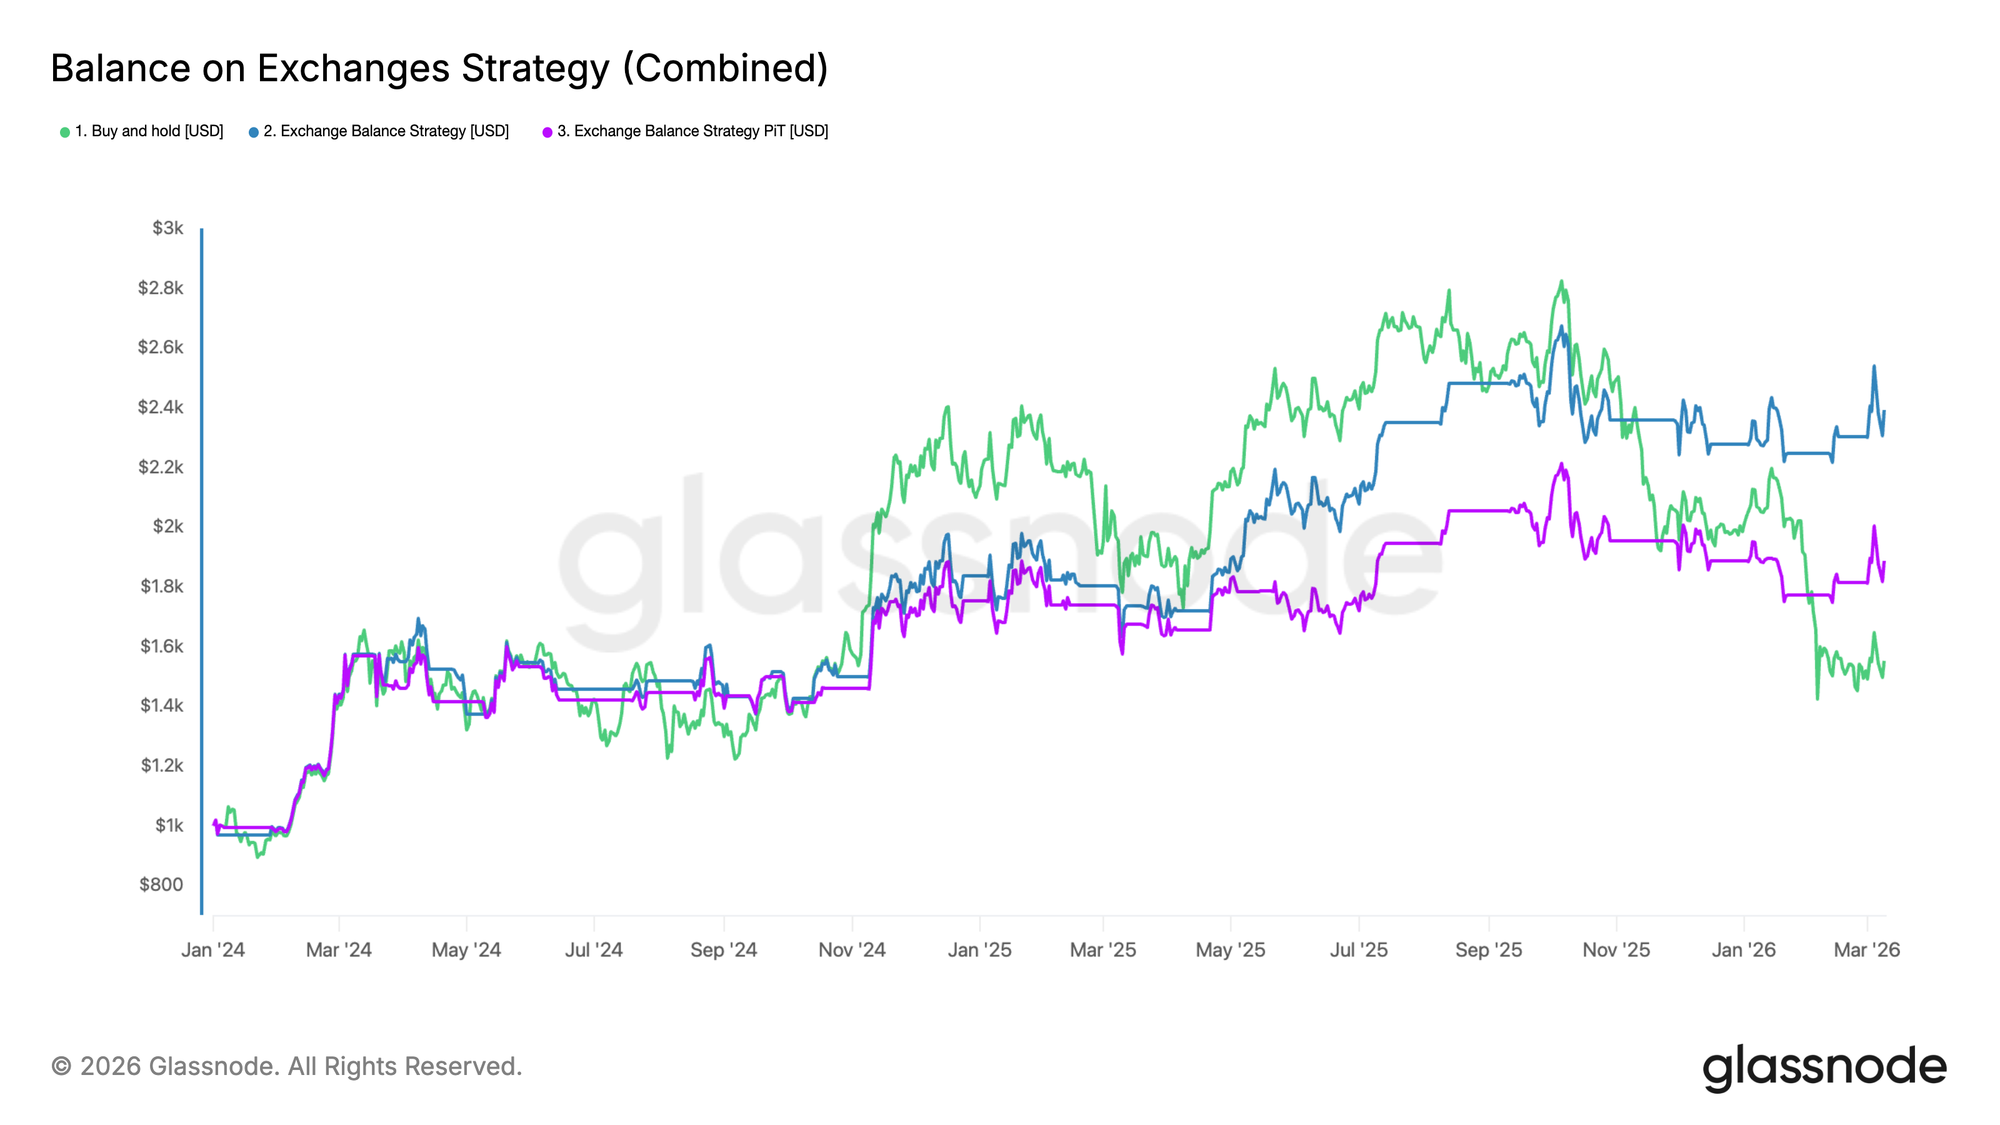
While we are using the same metric, the strategy now produces significantly different results, as illustrated by the purple line in the new chart below. The overall performance is notably worse.

Although both strategies behave similarly for much of 2024, we observe that the PiT-based version fails to capture the strong upticks in November 2024 and March 2025 as effectively. As a result, the cumulative performance diverges meaningfully and ends up considerably lower.
Access live chart

Key Takeaway

In this example, the purple strategy, which only has access to information as it was available at the time, performs noticeably worse. ► Backtests will lie if fed with wrong or revised data. Only immutable, Point-in-Time metrics ensure you’re replaying history as it actually happened.


Perguntas relacionadas

QWhat is the main problem with using revised data for backtesting a trading strategy?

AThe main problem is that it introduces look-ahead bias, as the revised data includes information that was not available at the time the trading decisions would have been made.

QHow does the Point-in-Time (PiT) data differ from the standard exchange balance metric?

APoint-in-Time data is strictly append-only and immutable, meaning each historical data point reflects only the information known at the time it was first computed, with no retroactive revisions.

QWhat was the trading signal used in the hypothetical strategy based on exchange balances?

AThe strategy entered the market when the 5-day moving average of Binance's BTC balance fell below its 14-day moving average, and exited when the 5-day average rose back above the 14-day average.

QWhy did the backtest using Point-in-Time data perform worse than the one using revised data?

AThe PiT-based strategy failed to capture strong market upticks as effectively because it only had access to information available in real-time, without the benefit of hindsight revisions.

QWhat is the key takeaway from the article regarding backtesting and data quality?

ABacktests will produce misleading results if fed with revised data; only immutable, Point-in-Time metrics ensure an accurate replay of history as it actually happened.

Leituras Relacionadas

Within Strategy's Framework, STRC's Dividend Yield Remains at 12% as Share Price Stays Below Par Value

Michael Saylor, Executive Chairman of Strategy (MSTR), confirmed that the dividend rate for its STRC perpetual preferred shares will remain at 12.00% through August 2026. The rate has increased from 9% at its July 2025 launch to the current high via a "ratchet" mechanism, which permanently raises the rate by 0.5% whenever the share price falls below $95. This mechanism is intended to push the price back toward its $100 par value and support Strategy's "at-the-market" (ATM) program for issuing new shares to fund Bitcoin purchases. However, the mechanism has not worked as intended. STRC shares closed at $89.46 on July 31, remaining about 10-11% below par value despite the record-high dividend. Competition from rival Strive's higher-yielding SATA securities has pressured demand. The persistent discount has forced Strategy to suspend new STRC issuances via its ATM program, limiting this funding channel for Bitcoin acquisitions. STRC's struggles reflect Bitcoin's own volatility, as the preferred shares historically move in tandem. Analysts have warned the ratchet structure carries long-term, one-way risk. A law firm is investigating Strategy's ability to maintain dividend payments if Bitcoin's price stays low. Retail investors own roughly 83% of outstanding STRC shares, a group seen as prone to panic selling during downturns. In response, Strategy has established financial reserves, including a liquidity cushion covering about 26 months of dividend/interest obligations, and a $2 billion share buyback program alongside a Bitcoin monetization framework, though the company emphasized it is not obligated to sell any Bitcoin.

cryptonews.ruHá 4m

Within Strategy's Framework, STRC's Dividend Yield Remains at 12% as Share Price Stays Below Par Value

cryptonews.ruHá 4m

Analyst: Bitcoin's Price Will Drop to $60k in August, Then Rebound to $70k

Financial analyst Andrey Poroshin has provided a new forecast for Bitcoin's price dynamics in August. Poroshin, an analyst at the Bitbanker exchange, expects the cryptocurrency market to experience a downturn this month, with prices retesting the $60,000 level due to a lack of supportive macroeconomic catalysts. He noted that the recent US Federal Reserve decision to hold interest rates did not significantly impact the market, while inflation remains above the 2% target. Poroshin stated that Bitcoin is ending July under pressure from moderate volatility and a lack of new macroeconomic stimuli, leading to continued market caution. According to his base scenario, Bitcoin will drop to a range of $60,000 to $62,000 before recovering to $70,000. He pointed out that even $70,000 remains below the cost of mining in the US, which has prompted some miners to shift towards AI data center operations. Poroshin cited the winding down of BitMEX's operations as a potential catalyst for a price rebound, suggesting the exit of weaker players often coincides with market reversals and reduced short-term selling pressure. He believes Bitcoin is currently less susceptible to geopolitical shocks, such as the Iran-US conflict, and does not expect significant market changes in August related to the pending CLARITY Act. Looking ahead, Poroshin forecasts that September will bring more active price fluctuations driven by potential Fed rate decisions and possible discussions or approval of the CLARITY Act.

cryptonews.ruHá 4m

Analyst: Bitcoin's Price Will Drop to $60k in August, Then Rebound to $70k

cryptonews.ruHá 4m

In Jinjiang, Fujian, a Storage Super Unicorn Lies Quiet

In Fujian's Jinjiang, a city known for sportswear, lies a quiet semiconductor giant: Fujian Jinhua Integrated Circuit Co. (JHICC). Once a promising domestic DRAM manufacturer alongside Yangtze Memory and ChangXin Memory Technologies (CXMT), its journey was derailed in 2018 when the U.S. placed it on an Entity List and filed criminal charges for alleged trade secret theft. This halted production for years. A turning point came in February 2024 when a U.S. federal court found JHICC not guilty. However, it had lost crucial time. While CXMT soared to become a top-valued A-share company in 2024, JHICC, with an estimated valuation of 80 billion RMB, was just restarting. Its current output is primarily customized DDR4 chips, not the advanced DDR5/HBM demanded for AI, but it still benefits from the broader memory chip upcycle. JHICC's story is tied to Chen Zhengkun, a veteran engineer who left Micron to lead the venture. Founded in 2016 with state-backed funding, JHICC partnered with Taiwan's UMC to develop DRAM technology. Rapid progress was cut short by the U.S. actions, which Micron initiated, partly due to its heavy reliance on the Chinese market. Post-sanctions, Chen's team worked to rebuild the production line with reduced reliance on U.S. technology. According to its records, JHICC achieved small-scale production and revenue growth under immense pressure. It now focuses on the stable "niche" DRAM market (e.g., TVs, routers) with a monthly capacity of ~40,000 wafers, aiming for 60,000 by 2026. It holds over 1,000 patents but remains on the Entity List. For Jinjiang, investing in JHICC was a bold industrial leap. The local government provided unwavering financial and logistical support during the crisis, helping the company survive. JHICC has become the anchor for a growing local semiconductor cluster. Though its scale lags behind domestic peers, JHICC's persistence symbolizes a hard-won foothold in a global market long dominated by Samsung, SK Hynix, and Micron. Having missed one boom, it seeks a place in the new AI-driven memory supercycle.

marsbitHá 2h

In Jinjiang, Fujian, a Storage Super Unicorn Lies Quiet

marsbitHá 2h

Trading

Spot
活动图片



