XRP is consolidating around $1.43. The market is restless. And beneath the surface, a volatility indicator is flashing a signal that seasoned traders have learned not to ignore.
A new Arab Chain report, drawing on data from the Binance XRP Realized Volatility (30D) indicator, shows that volatility has collapsed to its lowest reading since the start of 2026. That is not a sign of a market at rest. In crypto, that kind of compression has a name — and a history.
The numbers are specific: the 30-day Realized Volatility currently stands at 0.5266, a sharp contraction from the elevated readings that accompanied XRP’s price surges earlier this year. More telling still, the Volatility Z-Score has turned negative at -0.9048 — meaning current volatility is now running nearly a full standard deviation below its historical average. The market is not just quiet. It is historically quiet.
What that means in practice is straightforward. Volatility does not stay compressed indefinitely. It builds, and then it releases — in one direction or the other. XRP at $1.43 is not a market drift. It is a market coiling.
Compression Before the Break
The report is direct about what the data describes: XRP has entered a consolidation phase in which price movement has narrowed to the point of near-stasis. That is not a neutral observation. Volatility compression — the technical term for exactly this condition — is one of the most reliable precursors to a sharp directional move in either market.
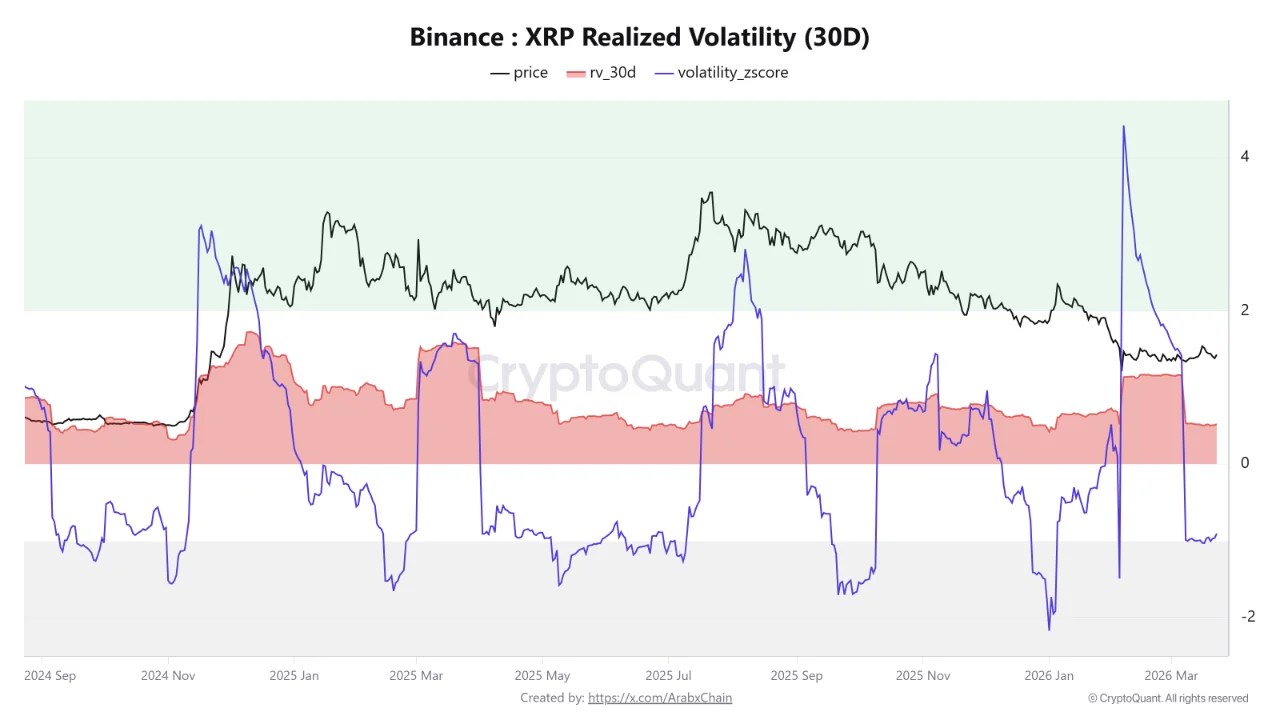
The stabilization near $1.43 is itself a data point. When price holds a level while volatility simultaneously contracts, it signals something specific: supply and demand have reached an equilibrium so tight that neither side is willing to commit. That standoff cannot last. Markets resolve equilibrium through movement, not through continued stillness.
The arithmetic reinforces the tension. With the 30-day Realized Volatility hovering at 0.52 and the Z-Score sitting at -0.9048, the market is statistically overdue for a volatility expansion. The threshold to watch is the Z-Score returning to positive territory — historically, that crossing has preceded the kind of sustained directional activity that defines a new trend rather than a temporary spike.
Compressed volatility at historic lows. Price anchored at a key level. The setup is not ambiguous. What remains unknown is the direction — and that is precisely what makes the next move consequential.