Why Does $1 Earn More in Banks? Analyzing the Structural Dilemma of DeFi Lending

marsbitPublicado em 2025-12-17Última atualização em 2025-12-17

Resumo

Silvio's analysis explores why $1 in a bank deposit generates 10x more profit than the same amount of USDC on Aave, arguing this reflects structural differences rather than inherent limitations in DeFi lending. Currently, most borrowing on Aave is driven by crypto-native strategies like staking ETH to borrow WETH for basis trades (45% of loans), yield farming with volatile collateral, or leveraging stablecoins for arbitrage. These uses are tightly coupled with crypto market cycles and yield opportunities, making DeFi lending highly correlated with "crypto GDP." In contrast, banks benefit from lower funding costs (tied to Fed rates), complex risk transformation (e.g., unsecured corporate loans), and oligopolistic advantages. For DeFi lending to mature, it must decouple from crypto volatility by incorporating new collateral types like tokenized real-world assets (RWA), off-chain credit, and crypto-native underwriting. This shift could align DeFi closer to traditional credit markets, potentially unlocking higher margins and more stable valuations by 2026.

Author: Silvio

Compiled by: Saoirse, Foresight News

A $1 deposit in a bank generates 10 times more profit for the bank than the same amount of USDC on Aave. This phenomenon may seem unfavorable for the DeFi lending sector, but in reality, it reflects the structural characteristics of the current cryptocurrency market more than the long-term potential of on-chain credit.
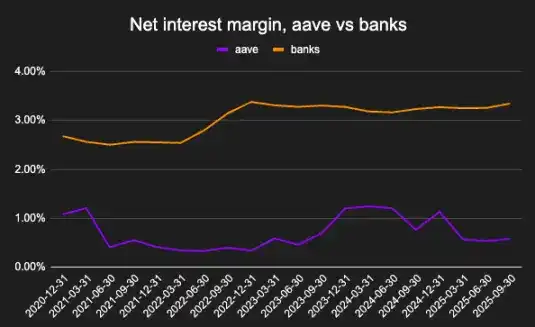
Net interest margin is an indicator of deposit profitability. Banks under FIDC, Aave under Blockworks.

This article will explore the following issues: the actual usage patterns of current lending protocols, the structural reasons for their lower profit margins compared to banks, and how this situation might change as lending activities gradually decouple from crypto-native leverage cycles.

The Role of On-Chain Credit

My first job involved analyzing bank books and assessing borrower qualifications. Banks channel credit funds to real businesses, and their profit margins are directly linked to the macroeconomy. Similarly, analyzing the borrowers of decentralized finance protocols helps in understanding the role credit plays in the on-chain economy.
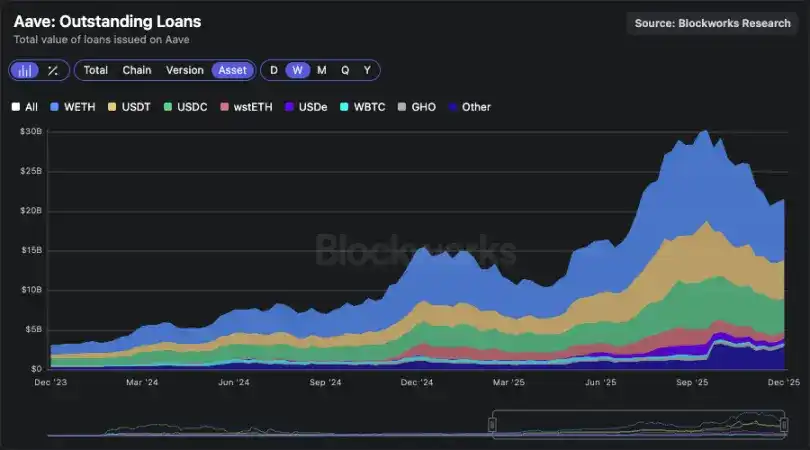
Chart of Aave's outstanding loan data

Aave's outstanding loan amount has exceeded $20 billion, an impressive achievement — but why do people borrow on-chain?

Actual Uses of Aave Borrowers

Borrower strategies can be categorized into four types:

1. Borrowing WETH using interest-bearing ETH as collateral: The yield from staking ETH is typically higher than that of WETH, creating a structural basis trade (essentially "borrowing WETH while earning yield"). Currently, this type of trade accounts for 45% of the total outstanding loans, with most of the funds coming from a few "whales." These wallet accounts are often related to staked ETH issuers (such as the EtherFi platform) and other "recursive stakers." The risk of this strategy is that the WETH borrowing cost may spike, which could quickly cause the collateral health factor to fall below the liquidation threshold.
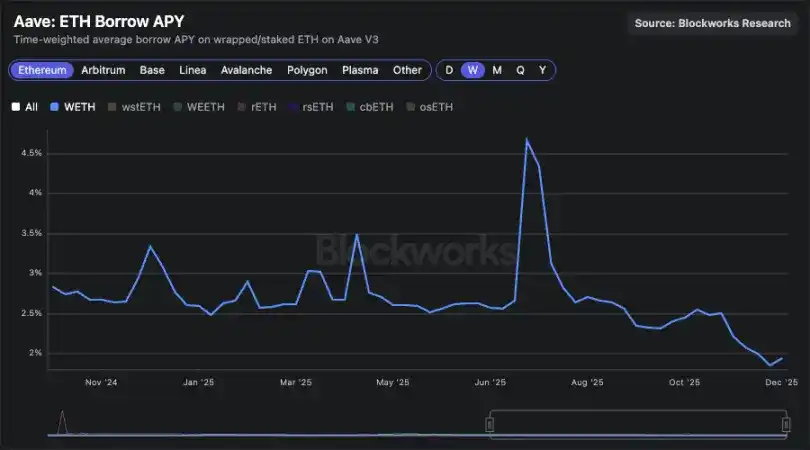
Presumed WETH borrowing rate chart: If the rate remains below 2.5%, the basis trade is profitable.

2. Stablecoin and PT recursive stakers: A similar basis trade can be formed with interest-bearing assets (such as USDe), where the yield may be higher than the borrowing cost of USDC. Before October 11, this strategy was very popular. Although structurally attractive, this strategy is highly sensitive to changes in funding rates and protocol incentive policies — which explains why the scale of such trades shrinks rapidly when market conditions change.

3. Volatile collateral + stablecoin debt: This is the most popular strategy among users, suitable for two types of demand: one is to increase exposure to cryptocurrencies through leverage, and the other is to reinvest borrowed stablecoins into high-yield "liquidity mining" for basis trading. This strategy is directly related to mining yield opportunities and is also the main source of stablecoin borrowing demand.

4. Other remaining types: Including "stable collateral + volatile debt" (for shorting assets) and "volatile collateral + volatile debt" (for currency pair trading).
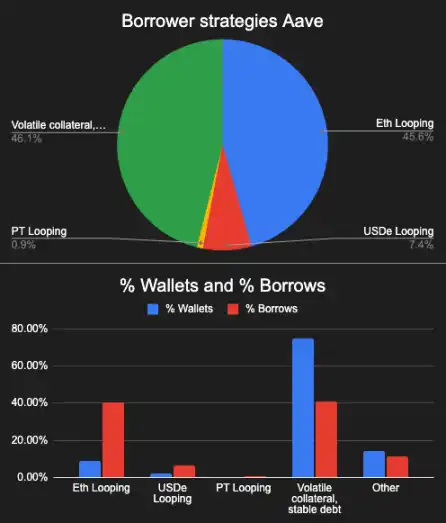
1) Weight distribution of Aave wallet borrowing strategies; 2) Distribution of wallets corresponding to each strategy
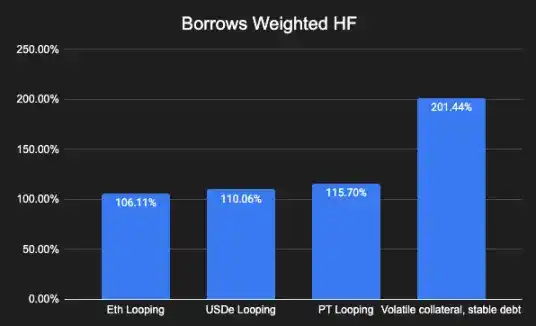
Chart of collateral health factor weighted by borrowing amount

For each of these strategies, there is a value chain composed of multiple protocols: these protocols integrate the trading process using Aave and distribute yields to retail users. Today, this integration capability is the core competitive barrier in the cryptocurrency lending market.

Among these, the "volatile collateral + stablecoin debt" strategy contributes the most to interest income (borrowing revenue from USDC and USDT accounts for over 50% of total revenue).
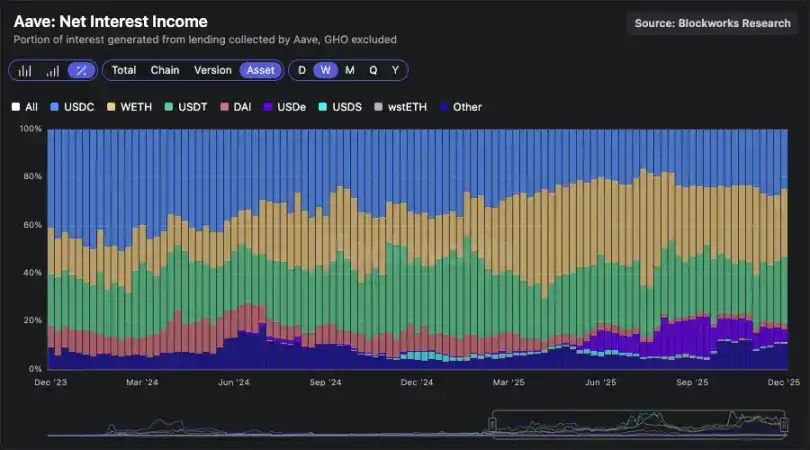
Chart of interest income share by asset type

Although some businesses or individuals do use cryptocurrency loans to finance operational activities or real-life expenses, the scale of such practical uses is very limited compared to the purpose of "leveraging on-chain leverage/yield differential arbitrage."

Three core factors driving the growth of lending protocols:

  1. On-chain yield opportunities: Such as new project launches, liquidity mining (e.g., Plasma platform mining activities);
  2. Structural basis trades with deep liquidity: Such as ETH/wstETH trading pairs and stablecoin-related trades;
  3. Partnerships with major issuers: These partnerships can help open up new markets (e.g., the combination of pyUSD stablecoin and RWA).

The lending market is mechanistically directly linked to "crypto GDP" (exhibiting Beta correlation), just as banks are essentially barometers of "real-world GDP." When cryptocurrency prices rise, yield opportunities increase, the scale of interest-bearing stablecoins expands, and issuers adopt more aggressive strategies — ultimately driving lending protocol revenue growth, increased token buybacks, and pushing up the price of Aave tokens.
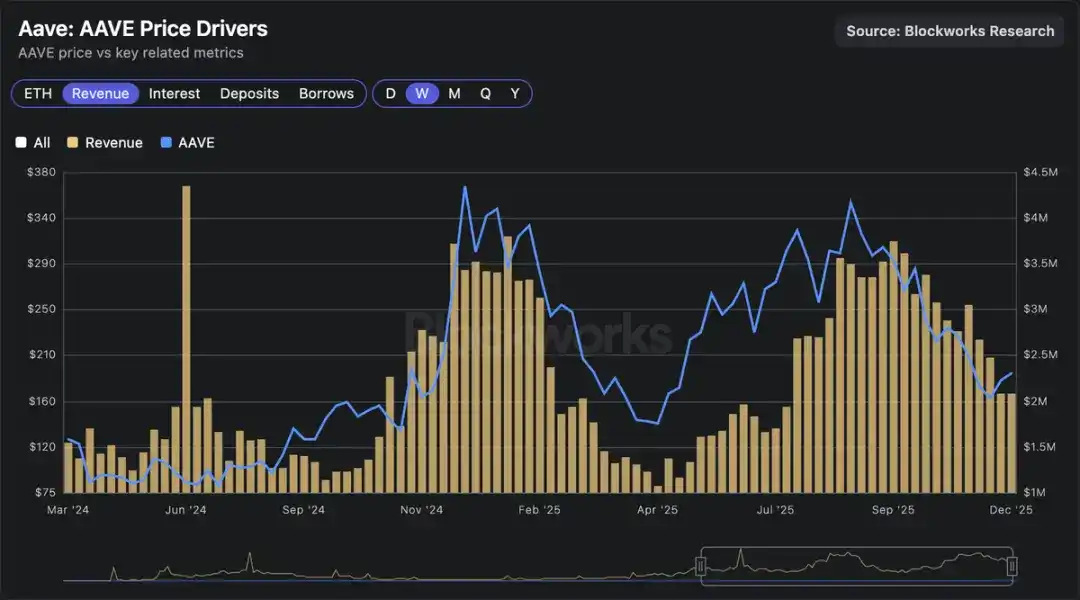
Chart of correlation between lending market valuation and revenue: Lending market valuation is directly correlated with revenue.

Comparison Between Banks and On-Chain Lending Markets

As mentioned earlier, $1 in a bank is 10 times more efficient in generating profit than $1 of USDC on Aave. Some see this as a bearish signal for on-chain lending, but in my view, this is essentially an inevitable result of market structure, for three reasons:

  1. Higher financing costs in the crypto space: Banks' financing costs are benchmarked against the Federal Reserve's base rate (lower than Treasury yields), while the deposit rate for USDC on Aave is typically slightly higher than Treasury yields;
  2. Traditional commercial banks engage in more complex risk transformation activities and deserve higher premiums: Large banks manage billions of dollars in unsecured loans to businesses (e.g., financing data center construction). This risk management is far more difficult than "managing the collateral value of ETH recursive staking" and therefore deserves higher returns;
  3. Regulatory environment and market dominance: The banking industry is an oligopoly, with high user switching costs and industry entry barriers.

Decoupling Lending from Cryptocurrency's "Cycle Binding"

Those successful cryptocurrency sectors are gradually decoupling from the boom-bust cycles of the crypto market itself. For example, the open interest of prediction markets continues to grow even amid price fluctuations; the same is true for stablecoin supply, whose volatility is much lower than other assets in the crypto market.

To move closer to the operational model of the broader credit market, lending protocols are gradually incorporating new risk types and collateral, such as:

  • Tokenized RWA and stocks;
  • On-chain credit originating from off-chain institutions;
  • Using stocks or real-world assets as collateral;
  • Structured underwriting through crypto-native credit scoring.

Asset tokenization creates the conditions for lending businesses to become the "natural endpoint" in the crypto space. When credit activities decouple from price cycles, their profit margins and valuations will also break free from cyclical constraints. I expect this transformation to begin manifesting in 2026.

Perguntas relacionadas

QWhy does $1 in a bank generate 10 times more profit than $1 in USDC on Aave?

AThis is due to structural factors in the crypto market: higher funding costs in crypto, the complexity and risk management of traditional banking activities which command higher premiums, and the oligopolistic nature of banking with high barriers to entry and switching costs.

QWhat are the four main strategies used by borrowers on Aave according to the article?

AThe four strategies are: 1) Borrowing WETH against staked ETH for a structural basis trade. 2) Stablecoin and PT restaking for similar basis trades. 3) Using volatile collateral to borrow stablecoins for leverage or yield farming. 4) Other types including stable collateral with volatile debt (for shorting) and volatile collateral with volatile debt (for pair trading).

QWhat is the growth of the lending market on Aave primarily tied to?

AIts growth is tied to three core factors: 1) On-chain yield opportunities like new project launches and liquidity mining. 2) Deeply liquid structural basis trades such as ETH/wstETH. 3) Partnerships with large issuers to access new markets, like integrating pyUSD with RWA.

QHow does the article suggest lending protocols can decouple from the crypto market's price cycles?

ABy incorporating new risk types and collateral, such as tokenized RWAs and stocks, on-chain credit from off-chain institutions, using stocks or real-world assets as collateral, and implementing crypto-native credit scoring for structured underwriting.

QWhat role does asset tokenization play in the future of DeFi lending according to the author?

AAsset tokenization creates the conditions for lending to become a 'natural endpoint' in crypto by allowing the business to decouple from price cycles. This is expected to allow its profit margins and valuations to break free from cyclical constraints, a shift anticipated to begin in 2026.

Leituras Relacionadas

After Aave's Exit and TVL's Sharp Fluctuation, Where Does MegaETH's Valuation Anchor Lie?

Following the withdrawal of Aave and a sharp drop in its Total Value Locked (TVL), the valuation of the high-performance DeFi blockchain MegaETH faces scrutiny. Once a highly anticipated project with a fully diluted valuation (FDV) reaching around $2 billion, MegaETH saw its TVL plummet from a May peak of $245 million to just over $30 million in July, a roughly 70% decline. Its native token, MEGA, currently trades around $0.048 with a market cap of approximately $54 million and an FDV of about $480 million. The report identifies a core vulnerability: MegaETH's TVL was heavily dependent on a single protocol, Aave V3, which at its peak contributed around 90% of the chain's TVL. A significant portion of this capital is attributed to leveraged yield-farming strategies involving stablecoins like USDe. When the profitability of these strategies diminished, capital rapidly exited, exposing the lack of diversified, sustainable activity. Three key mismatches between MegaETH's valuation and its fundamentals are highlighted: 1. **Valuation vs. Real Usage:** With an FDV of ~$4.8B but only ~$1M in annualized protocol revenue and ~2,600 daily active addresses, the valuation appears disconnected from current economic activity. 2. **Token Narrative vs. Ecosystem Reality:** Despite its DeFi narrative, nearly 80% of the chain's recent protocol revenue comes from a trading card game, Monster, not from core DeFi applications like Aave. The chain's native stablecoin, USDM, also shows low trading volume and a declining market cap. 3. **Short-Term Hype vs. Long-Term Delivery:** Initial hype from token generation, blue-chip integrations, and influencer support has faded. Major protocols like Uniswap now hold minimal TVL on the chain, indicating that early capital was largely transient and driven by incentives rather than organic demand. The situation reflects a broader market trend where investors are becoming less tolerant of valuations based on inflated TVL and narrative, demanding clearer evidence of sustainable transactions, revenue, and ecosystem development. While MEGA's price may experience short-term rebounds from market sentiment, a fundamental re-rating likely depends on the team's ability to convert its remaining resources into tangible, user-retaining applications and genuine ecosystem growth.

链捕手Há 1h

After Aave's Exit and TVL's Sharp Fluctuation, Where Does MegaETH's Valuation Anchor Lie?

链捕手Há 1h

Goldman Sachs In-Depth Report: Who Will Be the Long-Term Winners in China's AI Large Model Industry?

Goldman Sachs Report: China's AI Models at an Inflection Point China's open-source/open-weight large language models (LLMs) have reached performance parity with top global proprietary models, according to a Goldman Sachs report. This is driven by architectural innovations and higher parameter efficiency, allowing Chinese models to achieve comparable capabilities at 2%-10% the parameter size and significantly lower cost. The market is evolving into a two-tiered structure: a high-end segment (e.g., GLM5.2, Qwen3.7 Max) with premium pricing and a low-end, price-sensitive segment for global SMEs and individual users. Key points: * **Cost & Performance:** Innovations like Mixture of Experts (MoE) enable high performance with smaller models. Projects like Meituan's LongCat 2.0, trained on domestic hardware, highlight progress in tech self-sufficiency. * **Open-Source Strategy:** Most Chinese players use open-source/open-weight models for flexibility and ecosystem growth. However, Goldman notes this may underreport actual deployment and revenue. A shift toward "open-weight + community license" models with revenue sharing (e.g., MiniMax) could improve monetization. * **Market Shift & Global Expansion:** Enterprise AI adoption is shifting from "token maximization" to "ROI-first." International expansion, especially in non-US markets, is a major growth driver. Chinese models are increasingly available on global platforms like AWS Bedrock and Microsoft Copilot. * **Competitive Landscape:** Using a framework based on pricing power, cost advantage, and financial strength, Goldman identifies **Zhipu AI and DeepSeek** as the strongest in foundational text models, and **ByteDance** as the leader in multimodal/video generation. The report maintains Buy ratings on MiniMax and Kuaishou. * **Market Growth:** China's AI model API and subscription revenue is projected to grow from an estimated ¥35 billion in 2026 to ¥879 billion by 2030.

marsbitHá 1h

Goldman Sachs In-Depth Report: Who Will Be the Long-Term Winners in China's AI Large Model Industry?

marsbitHá 1h

Goldman Sachs Deep Dive Report: Who Will Become the Long-Term Winners in China's AI Large Model Industry?

Goldman Sachs Report: Who Will Be the Long-Term Winners in China's AI Large Model Industry? China's AI large model sector is at a historic inflection point. Goldman Sachs argues that the intelligence of Chinese open-source/open-weight models is approaching top global proprietary models. Rapid adoption by domestic enterprises and global SMEs is creating a data flywheel effect that will further drive model iteration. The evolution is summarized as moving from "DeepSeek's cost-efficiency moment last year to GLM's model-intelligence moment this year." Chinese models achieve near-state-of-the-art performance at significantly lower cost, primarily due to architectural innovations like Mixture of Experts (MoE) and higher parameter efficiency. Models like DeepSeek V4 Pro (1.6T params), GLM5.2 (0.7T), and MiniMax M3 (0.4T) are much smaller than global leaders. Recent advancements in coding capability are attributed to better data curation and RLHF. Landmarks like Meituan's LongCat 2.0, trained fully on domestic AI chips, demonstrate progress in hardware stack independence. The market is forming a "two-tiered structure." The high-end tier (e.g., GLM5.2, Alibaba's Qwen3.7 Max) prices around $1 per million tokens, about 10-25% of US top models, with estimated inference gross margins of 10-20%. The low-end tier (priced as low as $0.06-$0.2 per million tokens) targets price-sensitive global SMEs and individuals. MiniMax derives 60-70% of revenue overseas. Goldman forecasts China's AI model API/subscription revenue to grow from an estimated RMB 35bn in 2026 to RMB 879bn by 2030. Most Chinese players adopt open-source/open-weight strategies for deployment flexibility and community feedback, though this limits monetization as deployments on third-party platforms (e.g., Alibaba Cloud) may not generate direct revenue. A shift towards "open-weight + community license" models with revenue-sharing agreements (like MiniMax's approach) could improve unit economics. International expansion, particularly in non-US markets, is the key growth driver. The global enterprise AI paradigm is shifting from "token maximization" to "ROI prioritization." Chinese models are already hosted on major global platforms like AWS Bedrock and are under consideration for integration into Microsoft Copilot. Using a competitive framework based on pricing power, cost advantage, and financial strength, Goldman identifies the strongest players: In foundational text models, Zhipu AI (initiated coverage) and DeepSeek lead. In multimodal/video generation, ByteDance's Seed is the frontrunner, with Kuaishou's Kling and MiniMax's Hailuo also well-positioned. Goldman maintains a Buy rating on MiniMax, citing its attractive valuation.

链捕手Há 1h

Goldman Sachs Deep Dive Report: Who Will Become the Long-Term Winners in China's AI Large Model Industry?

链捕手Há 1h

Trading

Spot
活动图片