When Will Solana Price Surge To $360? Analyst Shares Possible Timeline

bitcoinistPublicado em 2026-04-01Última atualização em 2026-04-01

Resumo

Crypto analyst Celal Kucuker has presented a technical analysis suggesting Solana (SOL) could eventually surge to $360, a 333% increase from its current price of around $83. His forecast, however, anticipates significant short-term volatility, including a potential sharp crash to new lows near $50.42 to complete a bearish Double Bottom pattern. Kucuker's chart analysis indicates SOL may first rally to approximately $111.32 before plunging to the $50 support level. From that low, a breakout from a long-term descending channel could propel the price toward the $360 target, potentially by late 2026 or 2027. Key resistance levels on the path are identified at $130 and $260. When questioned on the fundamental thesis, the analyst pointed to broader crypto market dynamics, suggesting that momentum from meme coin rallies often catalyzes upward movement across the market, which could drive Solana to new all-time highs.

A crypto analyst has issued a new Solana price forecast, outlining several potential target levels for the current cycle. In the short term, the analyst expects significant volatility and the possibility of a sharp price crash to new lows. Despite this, his ultimate projection suggests that SOL could surge toward $360, representing a roughly 333% increase from its price of about $83 at the time of writing.

When The Solana Price Could Hit $360

A detailed technical analysis shared by market expert Celal Kucuker on X has sparked renewed optimism around Solana’s price outlook. The analyst shared a chart showing the SOL price around $88 at the time. He also outlined a clear roadmap that points to a potential final surge near $360 for the cryptocurrency.

The chart reveals a dominant bearish channel defined by several parallel red descending trendlines that shaped Solana’s price action from late 2025 through early 2026. These lines have repeatedly capped rallies and guided SOL’s downtrend, while also respecting the critical resistance point around $147.15.

Following the cryptocurrency’s rally to $147, it recorded a massive price crash to $66.92, marking the first floor of its Double Bottom pattern, as shown on the chart. Based on the trajectory of black lines within the descending parallel channel, Kucuker expects Solana to rally again to $111.32 in the near term, representing a roughly 66% increase from the previous bottom.
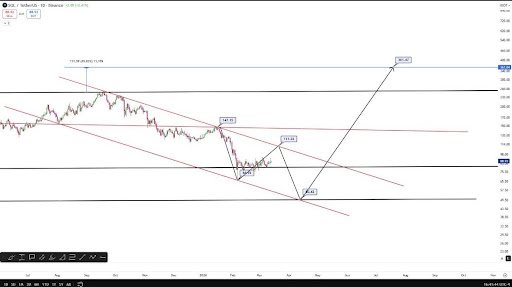
Source: Chart from Celal Kucuker on X

Once this happens, SOL is projected to plunge even deeper toward $50.42, officially completing its bearish Double Bottom pattern. Kucuker has highlighted this area as a solid support zone. From this pivotal low, the analyst drew a black, upward-sloping line that cleanly slices through the entire bearish descending channel.

This line points directly to the $361.47 bullish target. Kucuker’s timing for this projection suggests that Solana could skyrocket to this level by 2027. However, the chart shows somewhere around the third quarter of 2026. Notably, such a move would deliver a staggering 616% gain from the projected $50.42 support level.

Additional targets in the chart analysis further reinforce Kucuker’s bullish outlook. The analyst drew multiple horizontal lines on the chart to mark key resistance zones that may influence price movement. The first red line points to $130 as an immediate resistance level, which comes into play once the price surpasses the initial target of $111.32. Beyond this, the next black line identifies $260 as the next major resistance level that, if broken, could confirm Solana’s projected price rally above $360.

The Thesis Behind The Bull Rally

A crypto community member has challenged Kucuker’s bullish forecast for Solana, questioning why he posted price targets and charts without explaining the underlying thesis. They asked the analyst to explain which macroeconomic factors could push the SOL price above $360 and which could drive it down to the $50 support level.

In response, Kucuker pointed to broader market dynamics, noting that price rallies often start with meme coins, which typically generate momentum across the market. He noted that Solana will likely benefit from this upward movement, potentially propelling it to new all-time highs.

SOL trading at $82 on the 1D chart | Source: SOLUSDT on Tradingview.com

Perguntas relacionadas

QWhat is the analyst's ultimate price target for Solana in this cycle, and what percentage increase does that represent from the current price?

AThe analyst's ultimate price target for Solana is $360, which represents a roughly 333% increase from its price of about $83 at the time of writing.

QAccording to the technical analysis, what is the projected low point that would form the Double Bottom pattern before the surge?

AThe analysis projects that Solana will plunge to a low of $50.42 to officially complete its bearish Double Bottom pattern.

QWhat are the two key resistance levels identified in the chart that Solana must break through on its way to the $360 target?

AThe two key resistance levels identified are $130 as an immediate resistance and $260 as the next major resistance level.

QWhat broader market dynamic did the analyst cite as a potential catalyst for Solana's price rally?

AThe analyst cited that price rallies often start with meme coins, which generate momentum across the market, and Solana will likely benefit from this upward movement.

QBy what timeframe does the analyst suggest Solana could potentially reach the $360 price target?

AThe analyst's timing suggests Solana could reach the $360 target by 2027, with the chart indicating it could happen around the third quarter of 2026.

Leituras Relacionadas

Stocks Fell Even More Violently Than Crypto, Where Did the Money Go?

From June to late July 2026, global stock markets, particularly technology and semiconductor stocks, experienced severe declines, with South Korea's KOSPI index facing historic circuit breakers and shedding 40% from its June peak. Key catalysts included SK Hynix's earnings miss despite record profits and competitive pressures from China's CXMT IPO. A global forced deleveraging event unfolded, devastating highly leveraged instruments like the 2x leveraged SK Hynix ETF, which lost over 80% of its value. Surprisingly, Bitcoin showed relative stability during this period, rising roughly 15% from its July low. The article clarifies this wasn't due to an inflow of equity flight capital but because Bitcoin had already undergone a significant correction in May and June, with U.S. spot Bitcoin ETFs seeing record outflows. True safe-haven flows went to gold, severing Bitcoin's short-term "digital gold" narrative. The sell-off is characterized not as an AI story collapse but a liquidity-driven清算 of crowded leveraged positions, potentially halfway through according to some analysts. For substantial capital to return to Bitcoin, the article cites necessary conditions: eased global liquidity pressure, a soft-landing Fed rate cut, and regulatory clarity from the stalled U.S. CLARITY Act. The conclusion is that Bitcoin is not a current safe haven but a pre-cleared asset. Its decoupling from tech stocks highlights its potential future role as a non-correlated asset for institutional portfolios, positioning it favorably for when global capital reallocates post-crisis.

marsbitHá 1h

Stocks Fell Even More Violently Than Crypto, Where Did the Money Go?

marsbitHá 1h

"The Final Phase Before the New Cycle". What Will Happen to Bitcoin in August

"Bitcoin Faces Crucial Test in August: Experts Predict Consolidation or Further Decline" The price of Bitcoin (BTC) is expected to remain under pressure in August, with experts anticipating either consolidation within a narrow range or a potential drop below $60,000. Despite a double-digit recovery from its July low near $58,000, BTC ended the month trading around $63,500, still roughly 50% below its October 2025 peak of $126,200. Analysts cite several headwinds: a challenging macroeconomic environment with high US interest rates and persistent inflation, which makes fixed-income assets more attractive than speculative ones like crypto. Furthermore, competition for capital is intense, with many investors favoring AI-related stocks. This is reflected in significant outflows from US spot Bitcoin ETFs, with a record $4.5 billion leaving in June and a net outflow of $5.4 billion for the first half of the year. Historically, August is a weak month for crypto, with a median return of -7.49% from 2013 to 2025. Experts also note regulatory uncertainty in the US, particularly the stalled CLARITY Act, as a dampening factor. Despite the bearish near-term outlook, several experts view the current phase as the "last phase before a new Bitcoin cycle" begins, potentially in Q4 2024. This makes it a favorable time for accumulating Bitcoin for the long term. Key price levels to watch are support at $60,000-$61,000, with a break below $58,000 potentially leading to $53,000-$55,000. A move above $67,000 could target $70,000-$75,000, though this is considered a lower probability scenario.

cryptonews.ruHá 1h

"The Final Phase Before the New Cycle". What Will Happen to Bitcoin in August

cryptonews.ruHá 1h

Trading

Spot
活动图片