Wall Street FOMO Rally Continues to Heat Up, How Did Four Days of Gains Surpass Three Months of Fluctuations?

marsbitPublicado em 2026-08-11Última atualização em 2026-08-11

Resumo

A FOMO-driven rally on Wall Street saw the S&P 500 surge 5.8% over four consecutive trading days ending August 4th, a move whose magnitude exceeded the index's entire high-to-low closing price range from the preceding three months. This rapid ascent, placing the four-day gain in the 99.32 percentile for the past decade, forced late entrants to chase prices higher. Despite the bullish momentum, the VIX volatility index also rose concurrently, indicating that traders were simultaneously hedging against potential downside risks. This was reflected in option markets, where short-term call skew hit a two-year high and the one-month average put/call ratio reached its most bullish level in at least four years, showcasing a rare mix of aggressive optimism and persistent caution.

After the close on August 4th, Wall Street witnessed an acceleration that was hard to ignore. The S&P 500 index had rallied 5.8% cumulatively over the four trading days ending that day. According to Reuters, the options market also showed the most bullish skew in at least four years.

The rally itself is not FOMO. What truly makes this round of market action different is how fast prices moved upward and what price the options market simultaneously placed on both upside and downside risks. On August 4th, closing data compiled by FRED also showed the stock market continuing to climb higher, while the VIX volatility index, which measures expected volatility, also closed higher. Optimism did not push volatility down alongside it.

Why Four Days Can Seem Longer Than Three Months
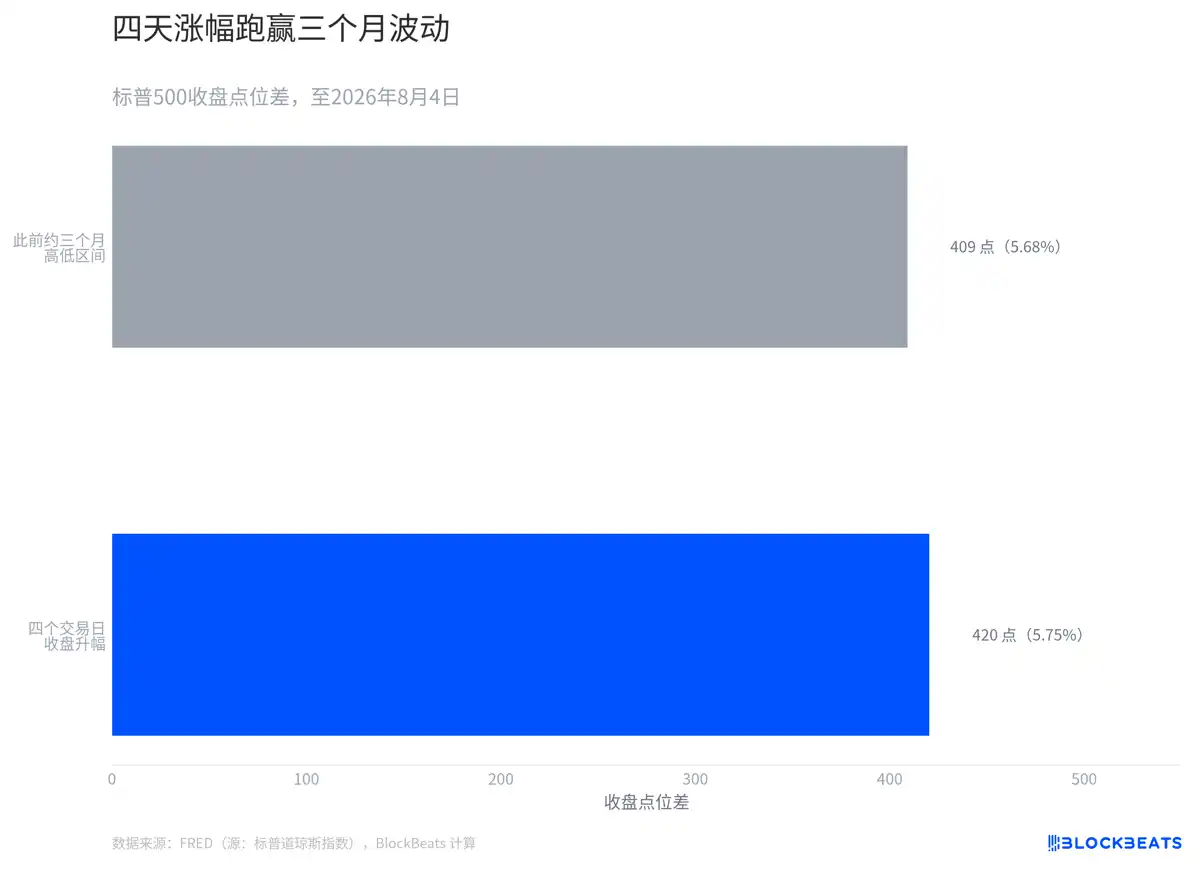
According to the S&P Dow Jones Indices daily closing data compiled by FRED, the economic database of the Federal Reserve Bank of St. Louis, this four-day upward move, measured by the same closing price metric, has slightly exceeded the point difference between the highest and lowest closing prices over the preceding approximately three months.

Placing these two changes side by side is not to equate the four-day return with the three-month high-low range as the same metric. The former indicates direction, the latter a range. They are placed on the same scale to visualize a shift in trading tempo: the closing price fluctuation band formed over months was surpassed by a one-way move over just four trading days.

The price path itself cannot prove the psychology of every participant. What it does illustrate is that four consecutive days of closing price increases rapidly raised the entry price for those joining later. Reuters characterized traders chasing into this rally as FOMO. The speed shown in the chart is precisely the aspect that allows this characterization to be tested against the price series.

How Rare Is This in the Past Decade?
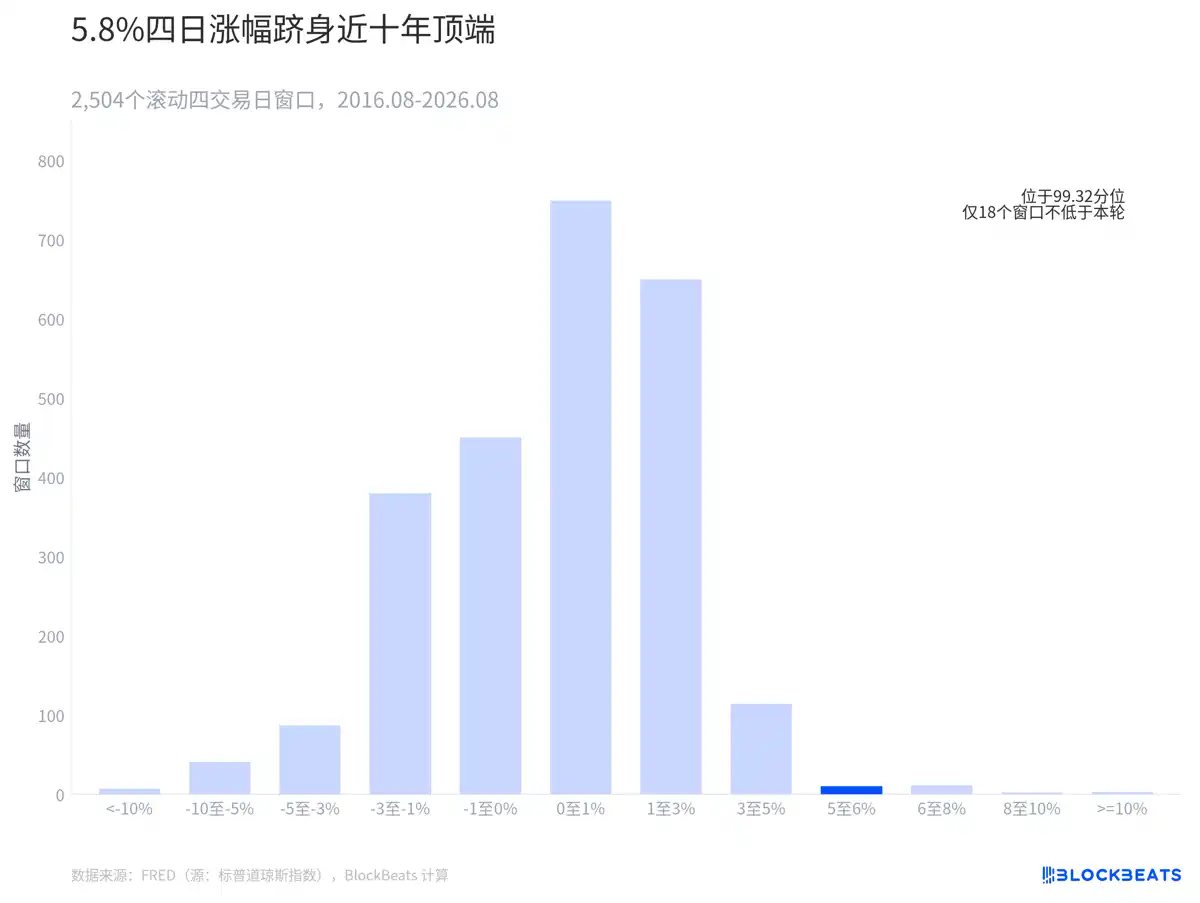
Based on a rolling calculation using nearly a decade of daily S&P 500 closing data from FRED, 2,504 four-day windows were obtained. The current rally of 5.7458% falls at the 99.32nd percentile, already in the sparse area on the far right of the chart.

Calculated from FRED data, including this round, only 18 windows have seen four-day gains at or above this level. Such a four-day magnitude is not common.

How Are Bullishness and Hedging Both Appearing in Options?
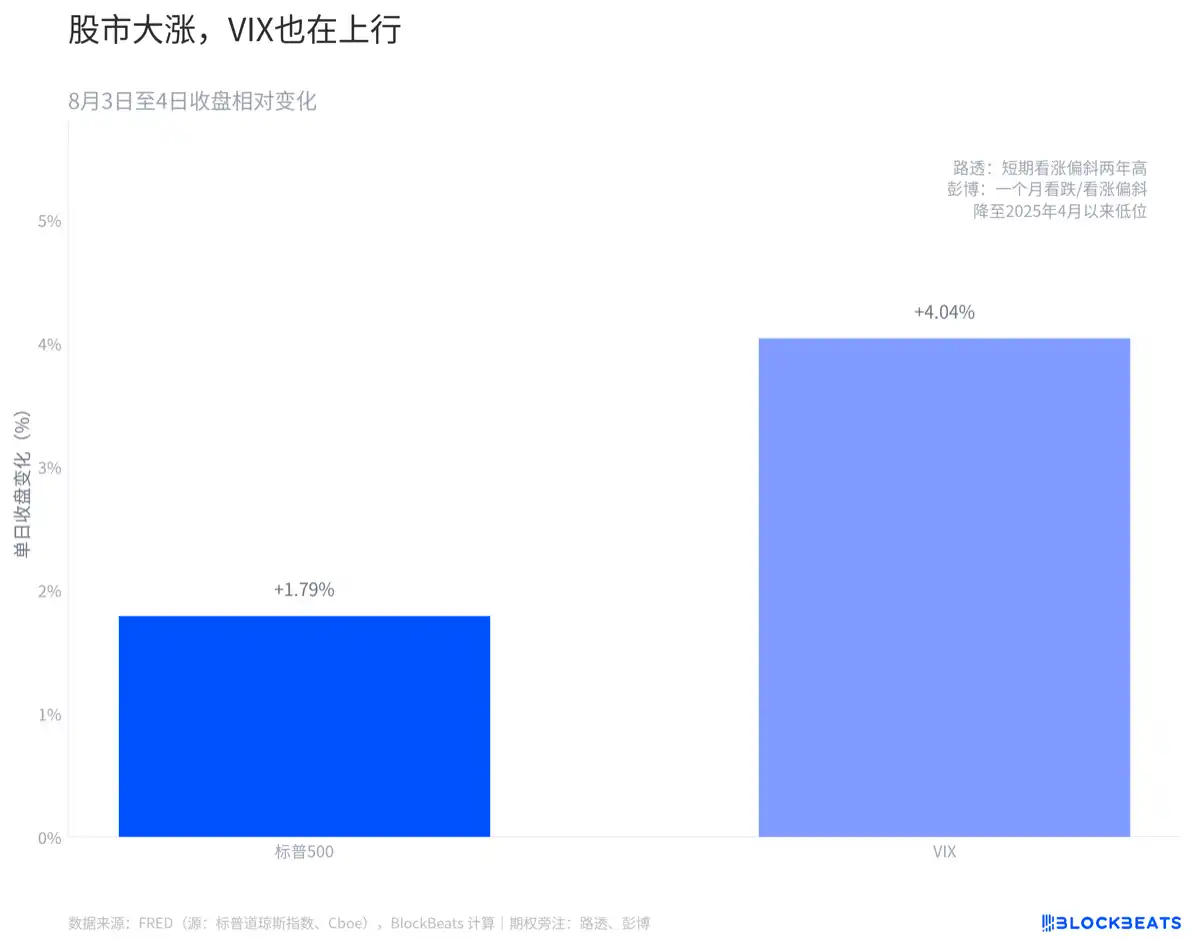
According to closing data for the S&P Dow Jones Indices and the Cboe (Chicago Board Options Exchange) compiled by FRED, the S&P 500 rose 1.79% while the VIX closed up 4.04%. The fact that both prices moved in the same direction indicates that, at least by the end of that day's trading, the market was not fully pricing down expectations for future volatility.

According to Reuters, the skew for near-term call options hit a two-year high. Data from options analytics firm Trade Alert showed the average daily S&P 500 call/put ratio for one month was 0.9, in its most bullish range in at least four years.

Perguntas relacionadas

QAccording to the article, what two contrasting phenomena occurred simultaneously in the options market during the described rally?

AThe article states that while short-term call option skew hit a two-year high and the call/put ratio indicated strong bullish sentiment (at least a four-year high), the volatility index (VIX) also rose, meaning the market did not completely price down expectations for future volatility. This shows bullishness and a demand for hedging against risk appeared together.

QWhat statistical benchmark is used in the article to show the rarity of the four-day S&P 500 gain mentioned?

AThe article uses a percentile rank based on a rolling calculation of all four-day windows over the past decade of S&P 500 closing data. The specific gain of 5.7458% ranks at the 99.32nd percentile, meaning it is higher than over 99% of similar four-day periods in the last ten years.

QHow does the article visually demonstrate that the four-day price move exceeded the prior three-month range?

AThe article includes a chart (the first image) that plots the four-day upward movement alongside the three-month high-to-low closing price range on the same scale. This visual comparison shows the four-day directional gain crossing the width of the three-month range.

QWhat specific data point from August 4th is given to illustrate that rising stock prices and rising volatility expectations can coincide?

AOn August 4th, the S&P 500 rose by 1.79%, while the VIX (a measure of expected market volatility) also rose, closing up by 4.04%. This simultaneous increase shows that optimism about prices did not suppress expectations for future price swings.

QWhat does the term FOMO refer to in the context of this market rally, and what evidence does the article link to this behavior?

AFOMO refers to 'Fear Of Missing Out,' describing traders chasing the rising market to avoid missing further gains. The article links this behavior to the evidence of the rapid, four-day price increase that quickly raised the entry price for latecomers, as well as the extremely bullish readings in the options market (e.g., high call/put ratios).

Leituras Relacionadas

Alexander Shokhin: Business Needs an Interest Rate Below 10% and the Dollar at 90-95 Rubles

Alexander Shokhin, head of the Russian Union of Industrialists and Entrepreneurs (RSPP), has advocated for potentially using "non-market" tools to keep the ruble within a target exchange rate corridor. This, he argues on August 21, would help avoid excessive volatility, though he called the topic a separate discussion. Shokhin had previously raised the idea of a currency corridor in late May, noting the ruble's current exchange rate is not fully market-driven due to a limited currency segment and reduced foreign currency demand. He stated that many business community colleagues propose fixing a corridor, even through non-market methods, to ensure predictability. The business community's key targets, as outlined by Shokhin in late December 2025, are a Central Bank key rate of 12%, inflation of 4–5%, and a US dollar exchange rate of 90–95 rubles by the end of 2026. A turning point for investment, he said, would be lowering the rate to 12% with 6% inflation, though truly comfortable business conditions would require a rate below 10%. He stressed the critical importance of currency predictability for corporate investment decisions. From a data analysis perspective, the idea of a ruble corridor is not new. A similar mechanism was used in Russia from 1995 to 1998, where the central bank held the dollar within fixed boundaries through regular interventions. This regime lasted three years before ending abruptly during the 1998 default, illustrating the fragility of rigid targets under external shocks. The macro-economic link is clear: stricter corridors require more reserves to defend against currency pressure. The key unresolved technical aspect is the specific sources and volume of such interventions given the current market's limited liquidity. Whether this discussion remains theoretical or leads to concrete corridor parameters will be seen in the coming months.

cryptonews.ruHá 1h

Alexander Shokhin: Business Needs an Interest Rate Below 10% and the Dollar at 90-95 Rubles

cryptonews.ruHá 1h

Trading

Spot
活动图片