VIRTUAL continues to gain strength as market sentiment shifts decisively in its favor. The asset recorded a 12% increase over the past 24 hours, reflecting growing bullish positioning.
AMBCrypto’s analysis highlights a rare alignment between Spot and Futures markets, with participants across both segments actively accumulating the asset.
Futures market drives capital inflow
The recent surge in Virtual [VIRTUAL] has been largely fueled by bullish activity in the Futures market. This bias is reinforced by a positive Funding Rate of 0.0022%, indicating that long traders are paying a premium to maintain their positions.
In effect, long positions dominate capital flows into VIRTUAL contracts, signaling strong expectations of continued upside.
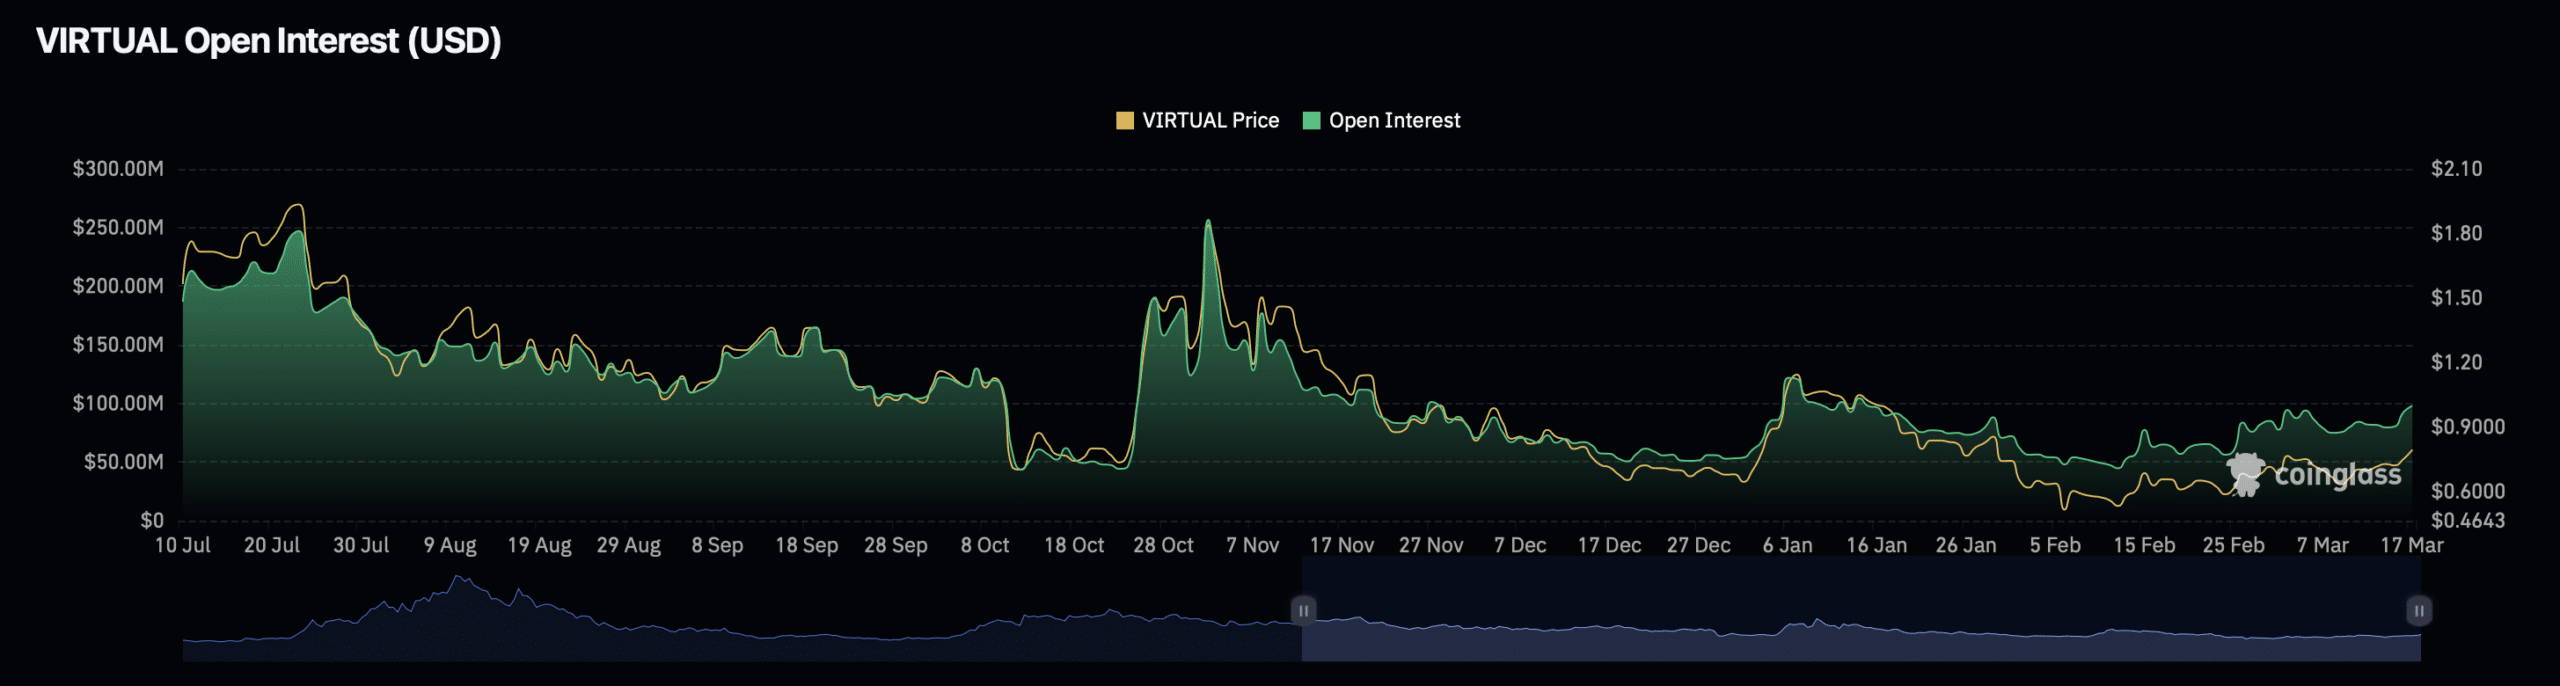
Within the last 24 hours, capital inflows totaled $12 million, pushing Open Interest to $102.42 million. This sharp increase reflects rising participation and conviction among derivatives traders.
With most of this capital concentrated in long positions, bullish momentum remains firmly intact—at least in the short term.
Spot demand strengthens conviction
Spot market activity has also accelerated, reinforcing the broader bullish outlook. Accumulation began modestly on the 16th of March, with net inflows of just $72,000, according to CoinGlass data.
However, this quickly scaled. By the 17th of March, total purchases surged to $697,140—nearly ten times the previous day’s volume.
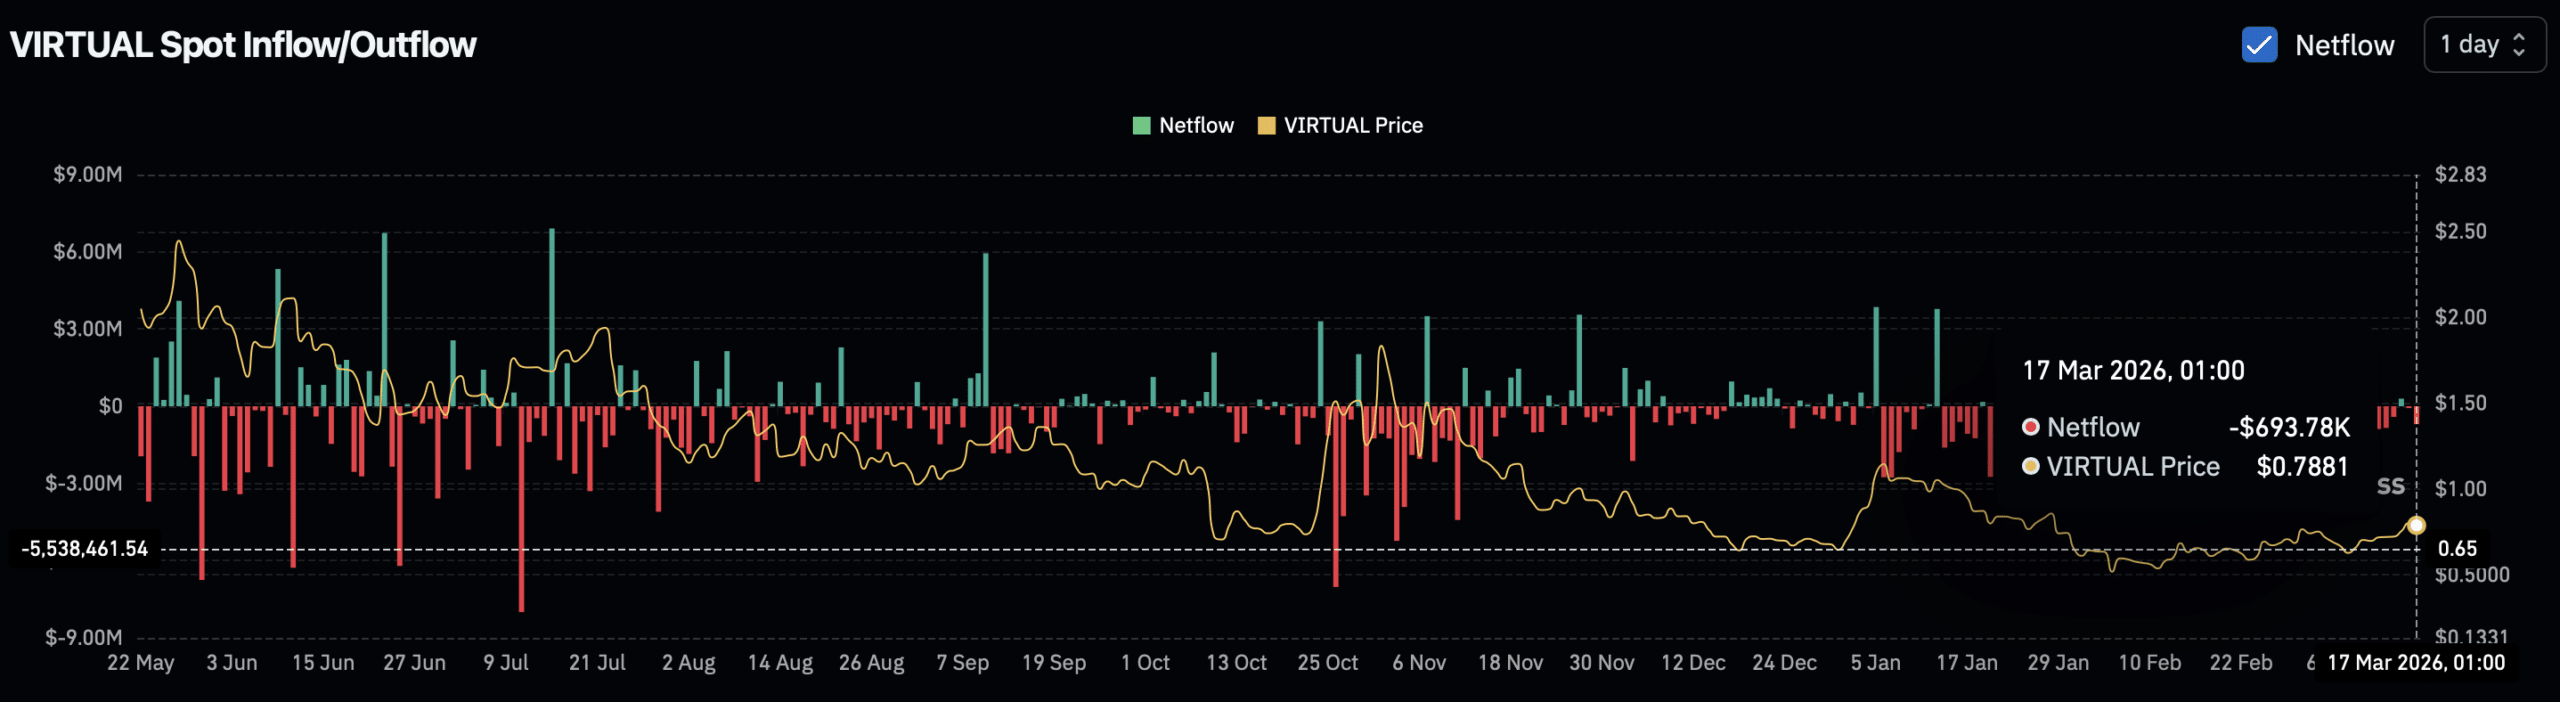
This sharp increase signals renewed investor confidence. When capital inflows expand at this pace, it typically reflects stronger conviction and a growing expectation of sustained price appreciation.
If this level of demand persists, it could provide the structural support needed to extend the rally. A slowdown, however, would weaken that foundation and expose the asset to downside pressure.
Liquidity clusters leave direction open
Despite the bullish buildup, liquidation data suggests the next move is not yet fully determined.
The heatmap shows liquidity clusters both above and below the current price. These clusters—visible as dense shaded zones—tend to attract price action.
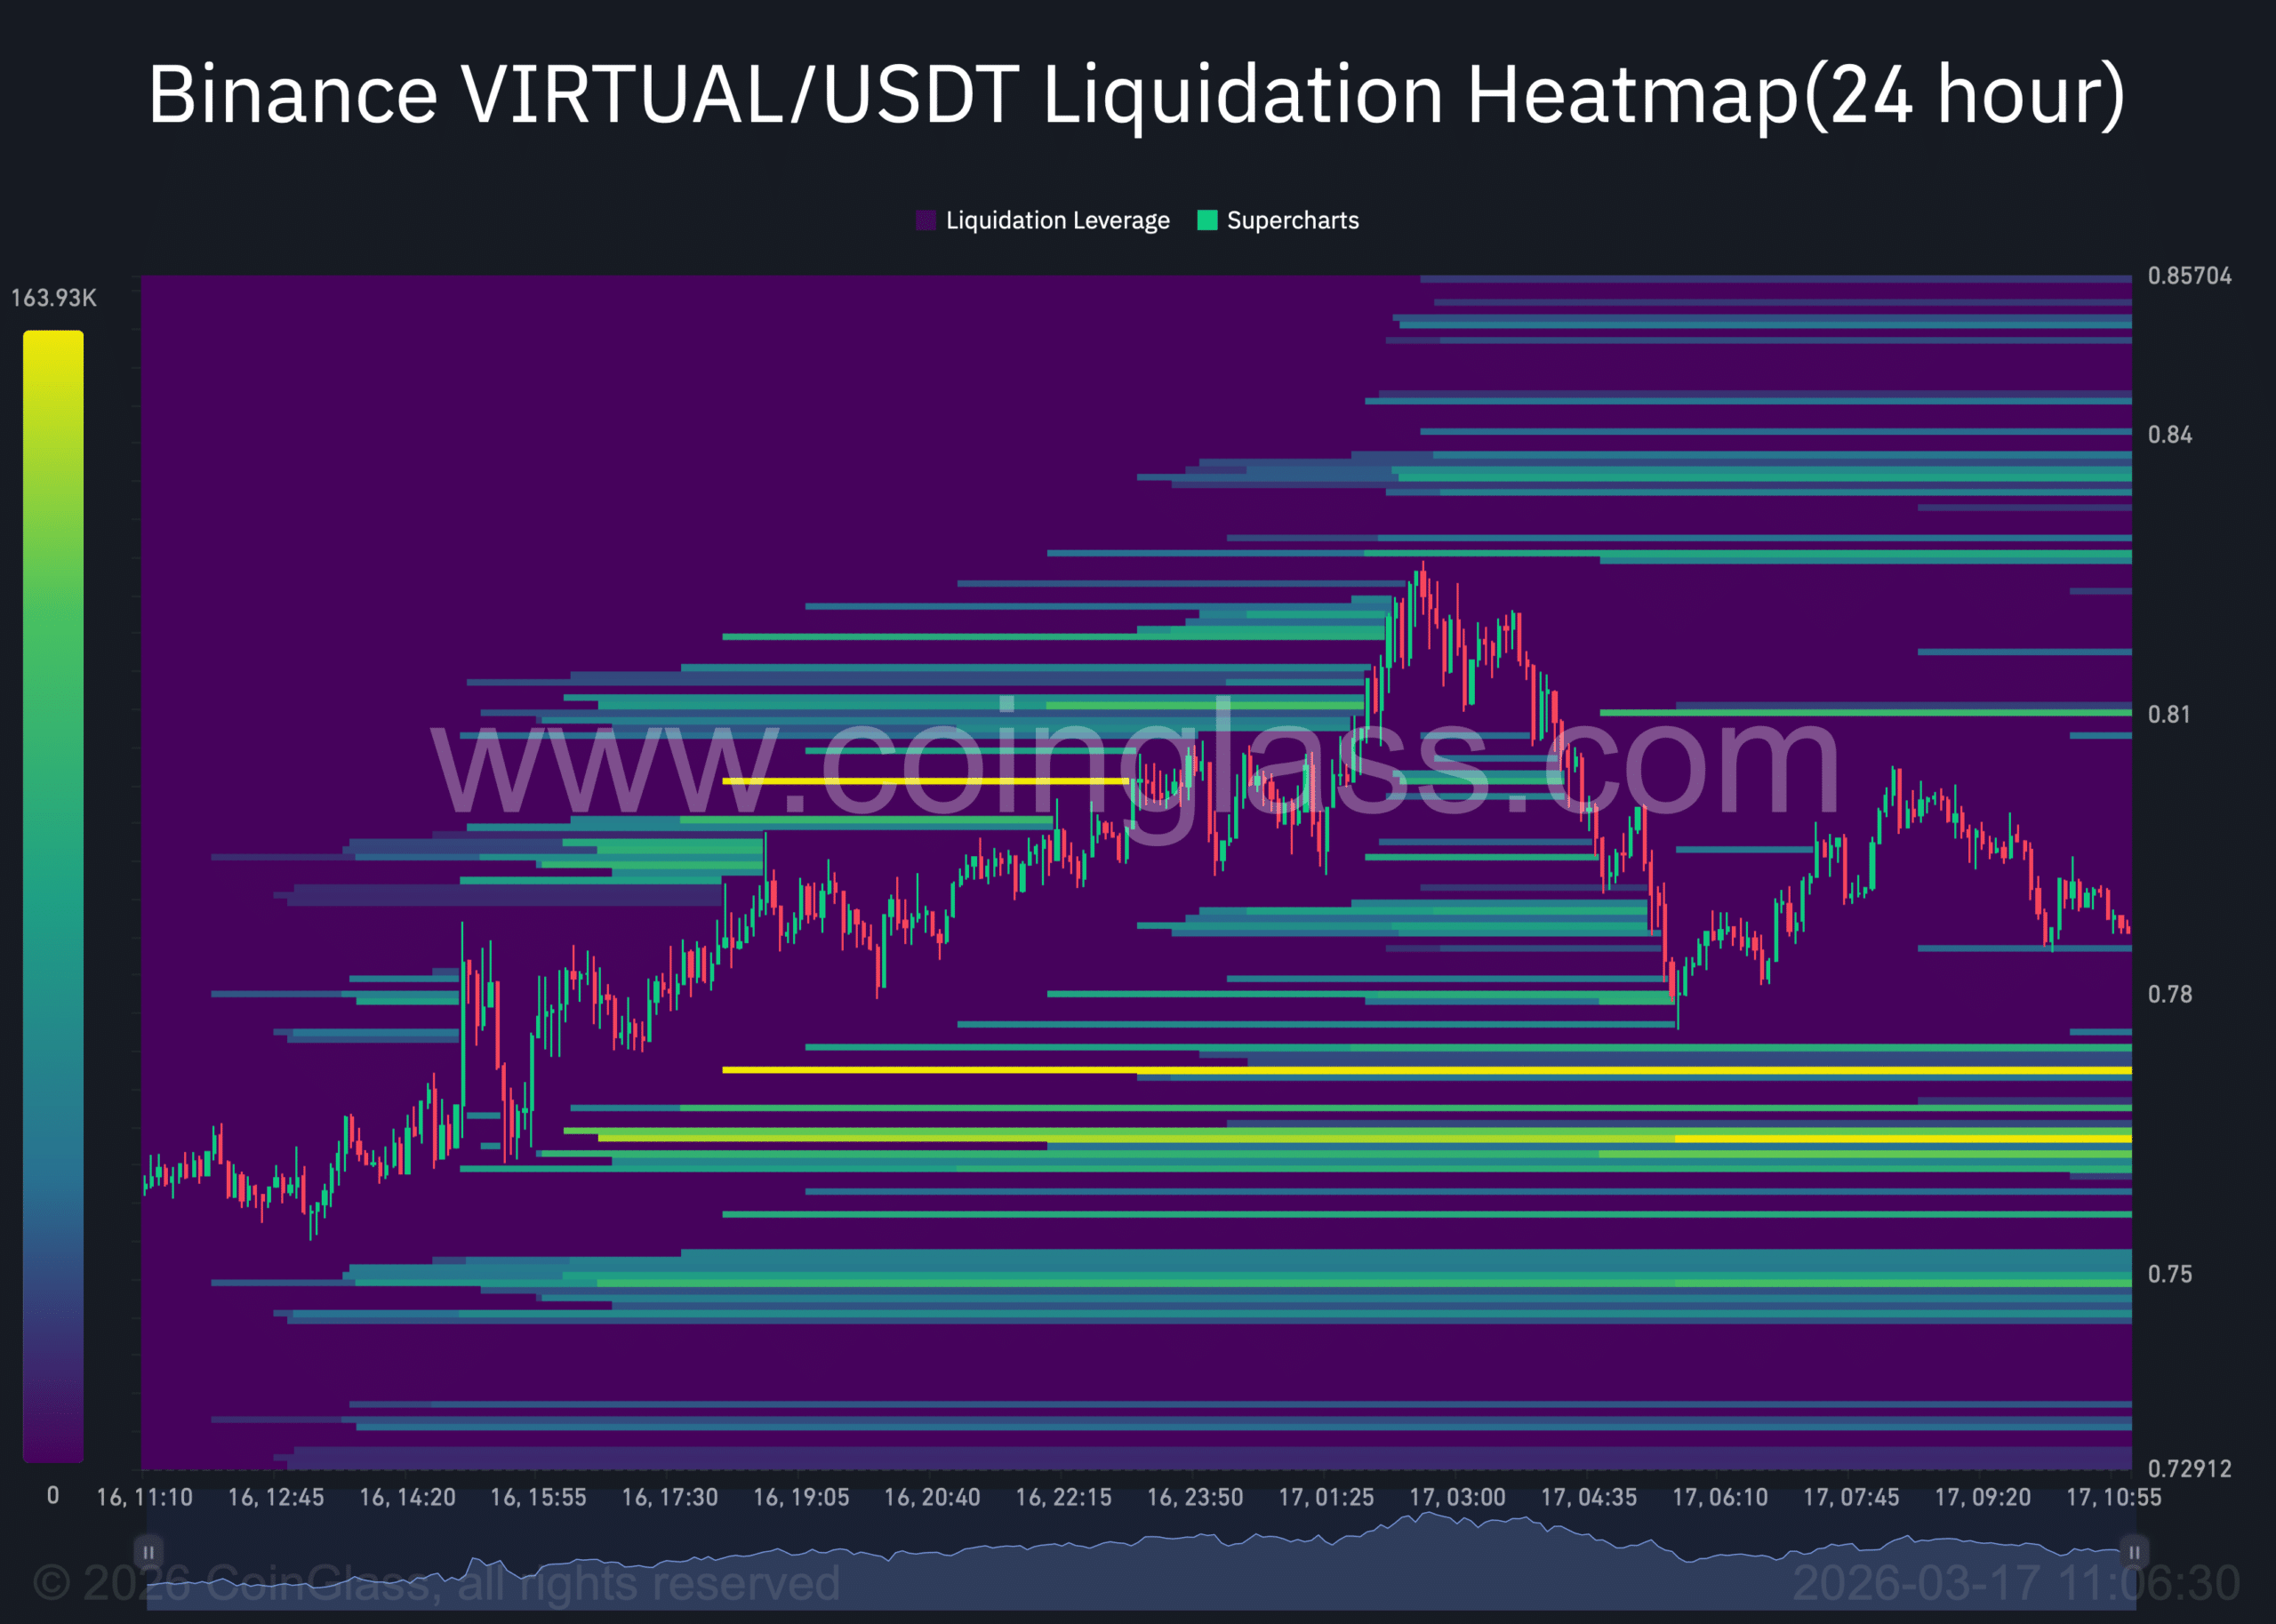
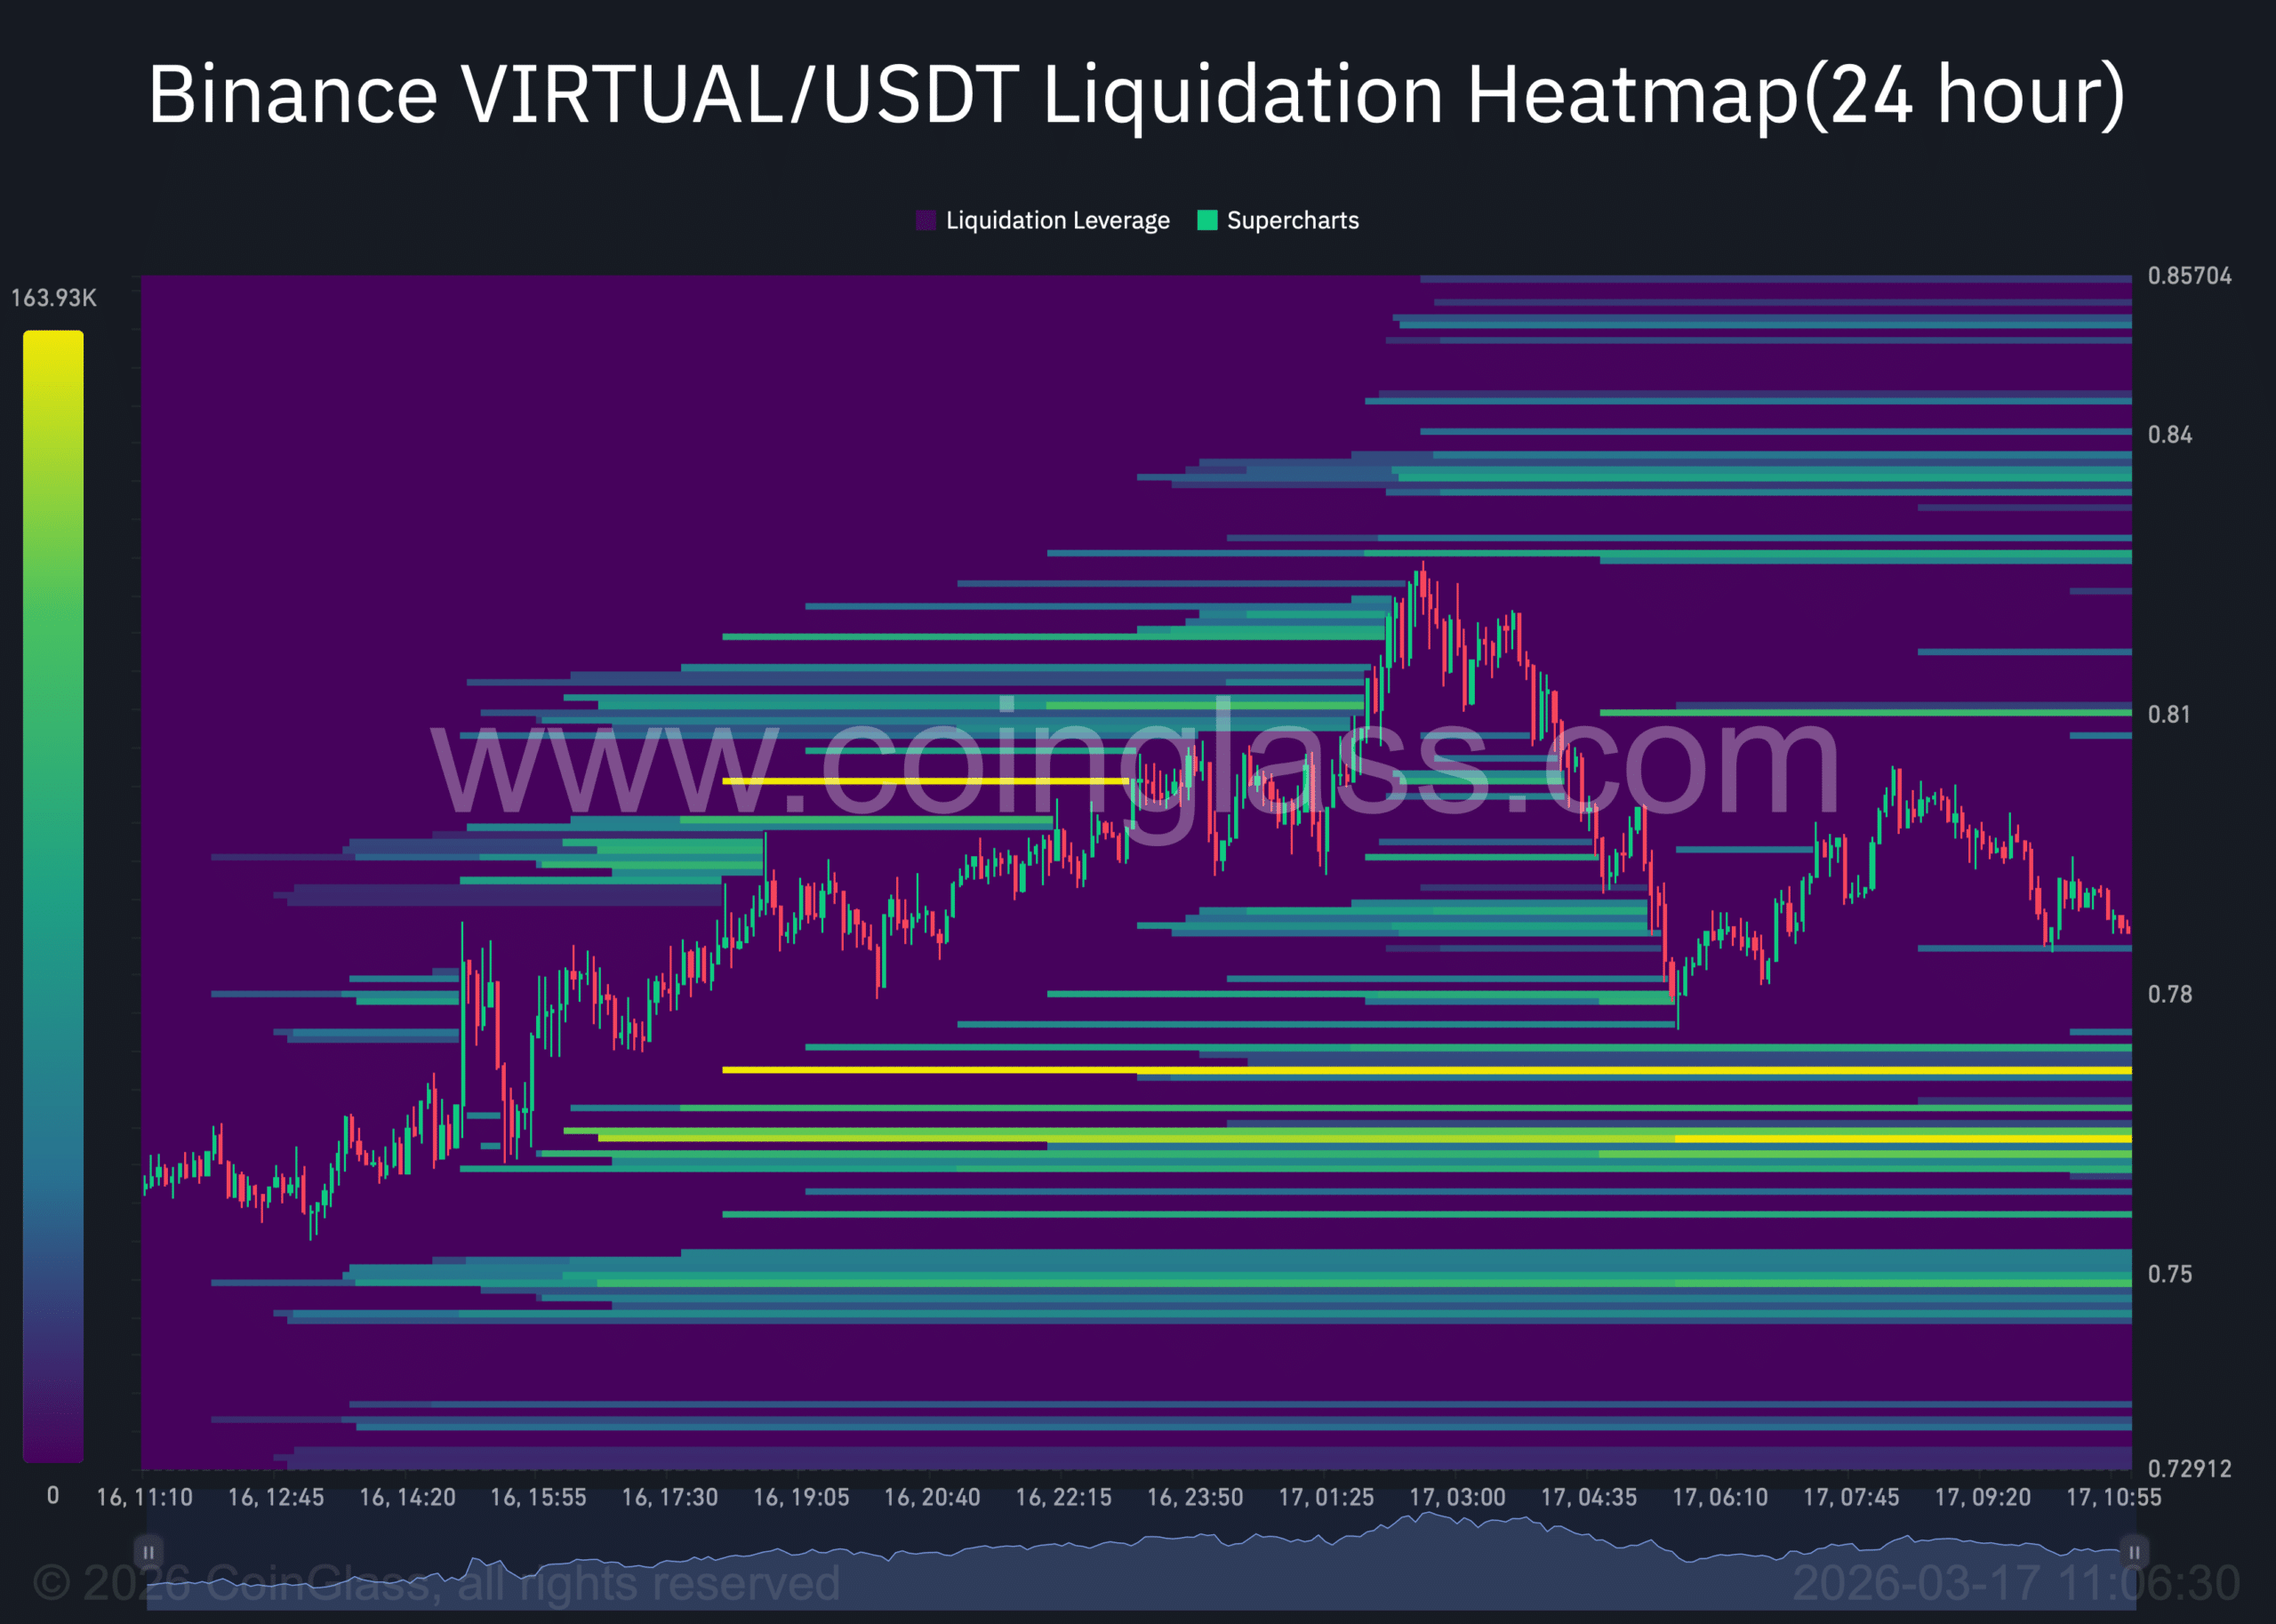
While liquidity remains split, the clusters below price appear more concentrated, suggesting stronger downside pull.
This creates a balanced but fragile setup. As a result, the next phase of price action will depend heavily on momentum, with VIRTUAL likely to move toward the dominant liquidity zone in the near term.
Final Summary
- VIRTUAL’s price rally and capital inflows were driven primarily by long traders in the perpetual market.
- Spot investors intensified accumulation, with purchases rising nearly tenfold day-over-day.






