Venice Token [VVV] surges 14% – Why THIS is the next KEY hurdle

ambcryptoPublicado em 2026-03-26Última atualização em 2026-03-26

Resumo

Venice Token (VVV) surged 14.37% to $6.40, supported by a 26.54% increase in trading volume, indicating strong spot market demand. The price broke out of a pennant pattern, shifting the market structure from consolidation to expansion, with immediate resistance at $6.68 and a potential target near $8.50. Key support now lies at $5.14. However, the MACD shows weakening bullish momentum with a negative histogram, suggesting a divergence between price action and underlying strength. Additionally, persistent sell pressure in Spot CVD indicates aggressive selling, though buyers appear to be absorbing it. Open Interest rose 18.74%, reflecting leveraged positioning that could fuel volatility. The rally's sustainability depends on holding above $5.14; a break below could quickly reverse gains.

Venice Token [VVV] has surged 14.37% to $6.40 as trading volume climbs 26.54% to $23.12M, signaling strong demand expansion across the spot market.

This expansion shows that price is not drifting upward but rather advancing through strong spot demand.

As participation increases, the rally reflects conviction instead of low-liquidity spikes. The VVV price increase toward $6.40 highlights alignment between demand and price action.

However, volume expansion at this stage also suggests that traders are reacting to the breakout rather than anticipating it.

As a result, this phase often defines whether continuation can hold or begin to fade under pressure.

VVV breaks free as structure shifts upward

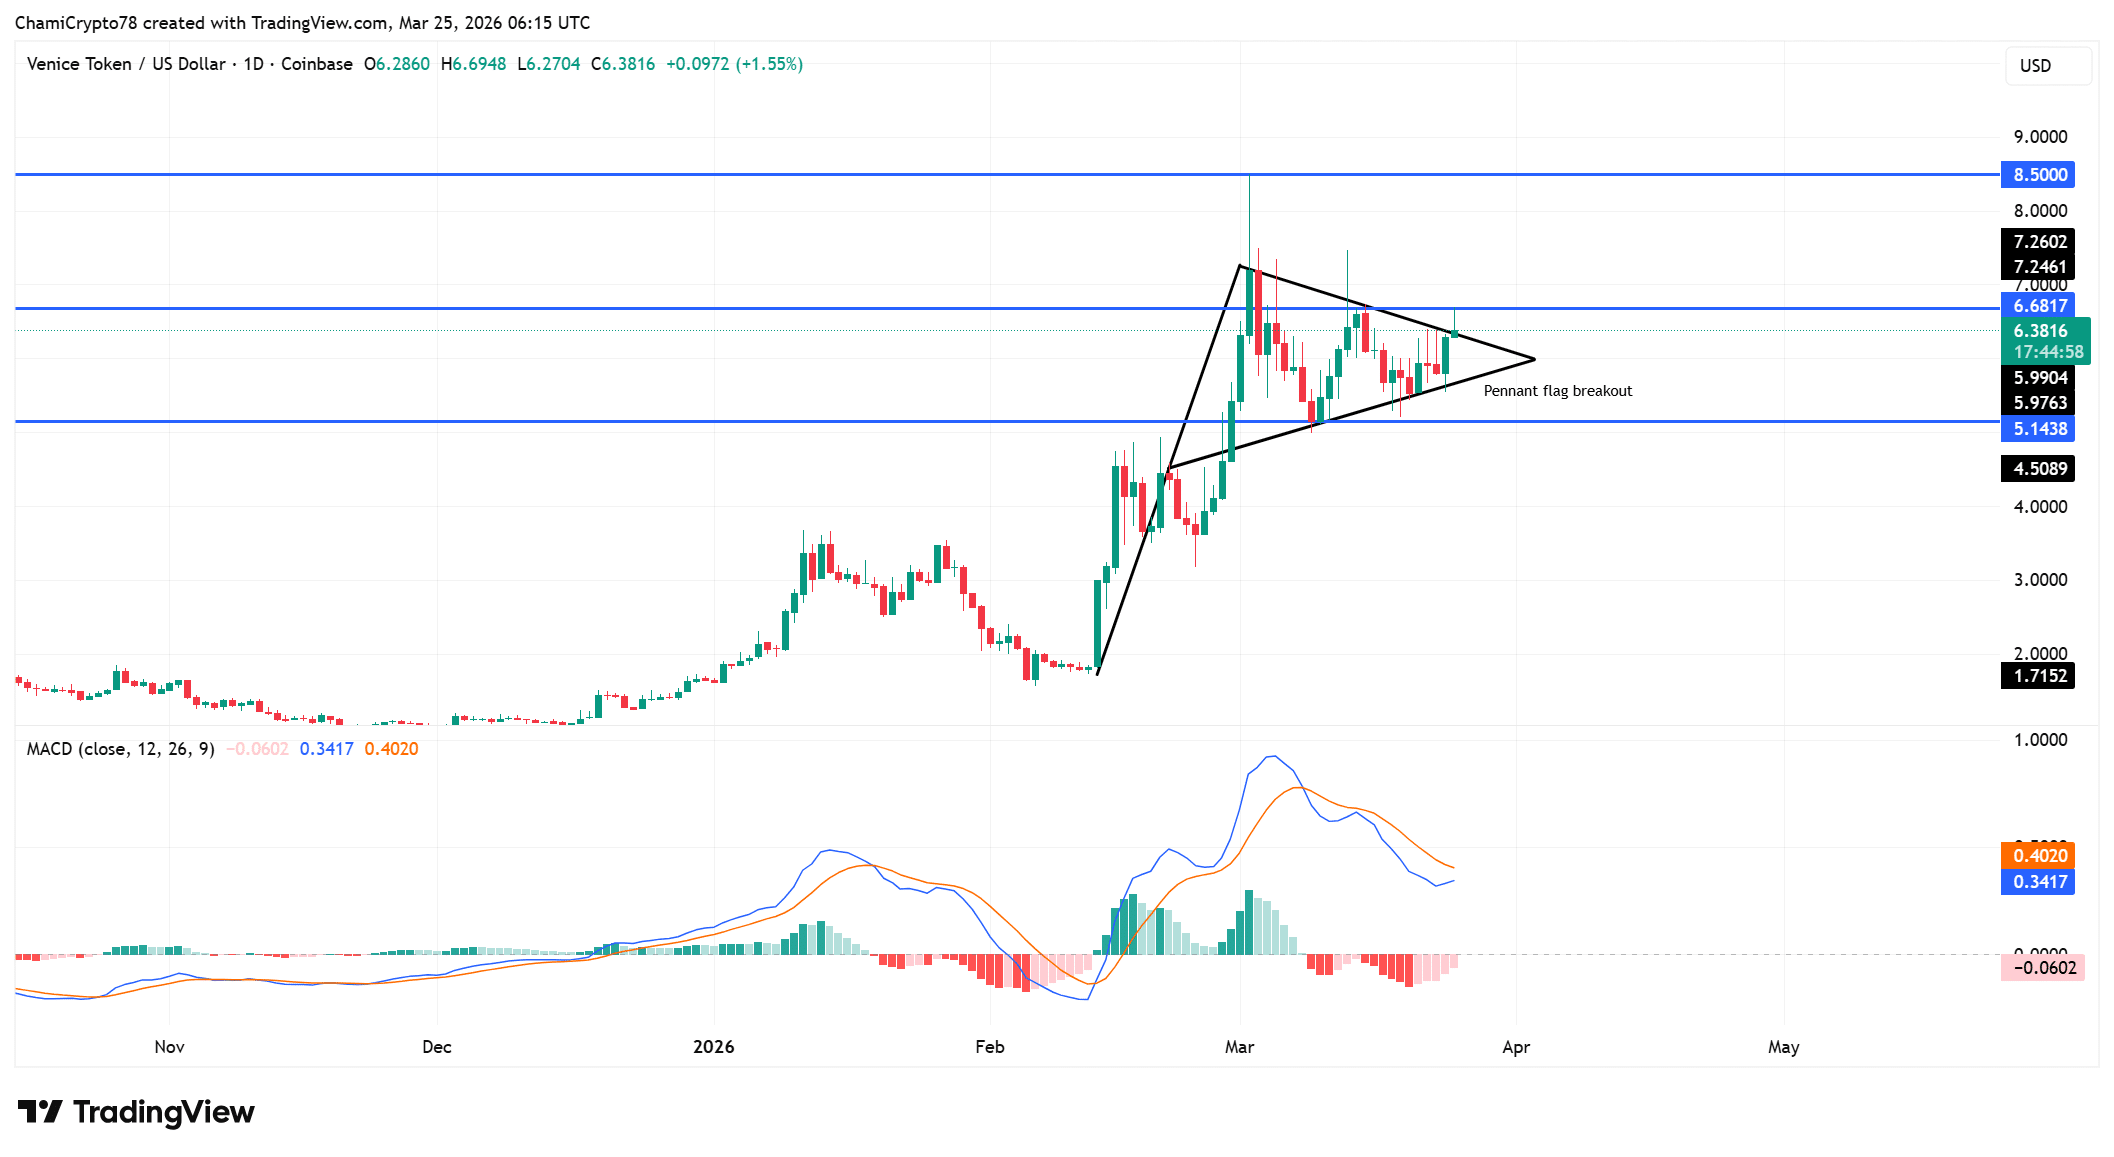
Price has broken out of the pennant flag, ending the prior compression phase and shifting structure toward expansion.

The breakout places immediate resistance at $6.68, while a broader target forms near $8.50 if continuation holds.

Besides, the former consolidation region around $5.14 now acts as a key support base. This transition reflects a shift from indecision into directional control.

However, price now approaches resistance zones where sellers may respond. As a result, holding above the breakout zone remains critical.

If price maintains this structure, the breakout could extend, but failure to hold support would quickly weaken the setup.

The MACD structure shows that bullish strength has not fully aligned with price action.

The indicator has not crossed above the signal line, which limits confirmation of sustained upside pressure.

Additionally, the histogram has turned negative, reflecting weakening strength after the breakout.

This divergence highlights a gap between structural expansion and internal strength. However, price continues holding above key levels, suggesting that buyers still defend the move.

As a result, the current setup reflects early-stage expansion rather than fully confirmed continuation.
Source: TradingView

CVD divergence exposes underlying sell pressure

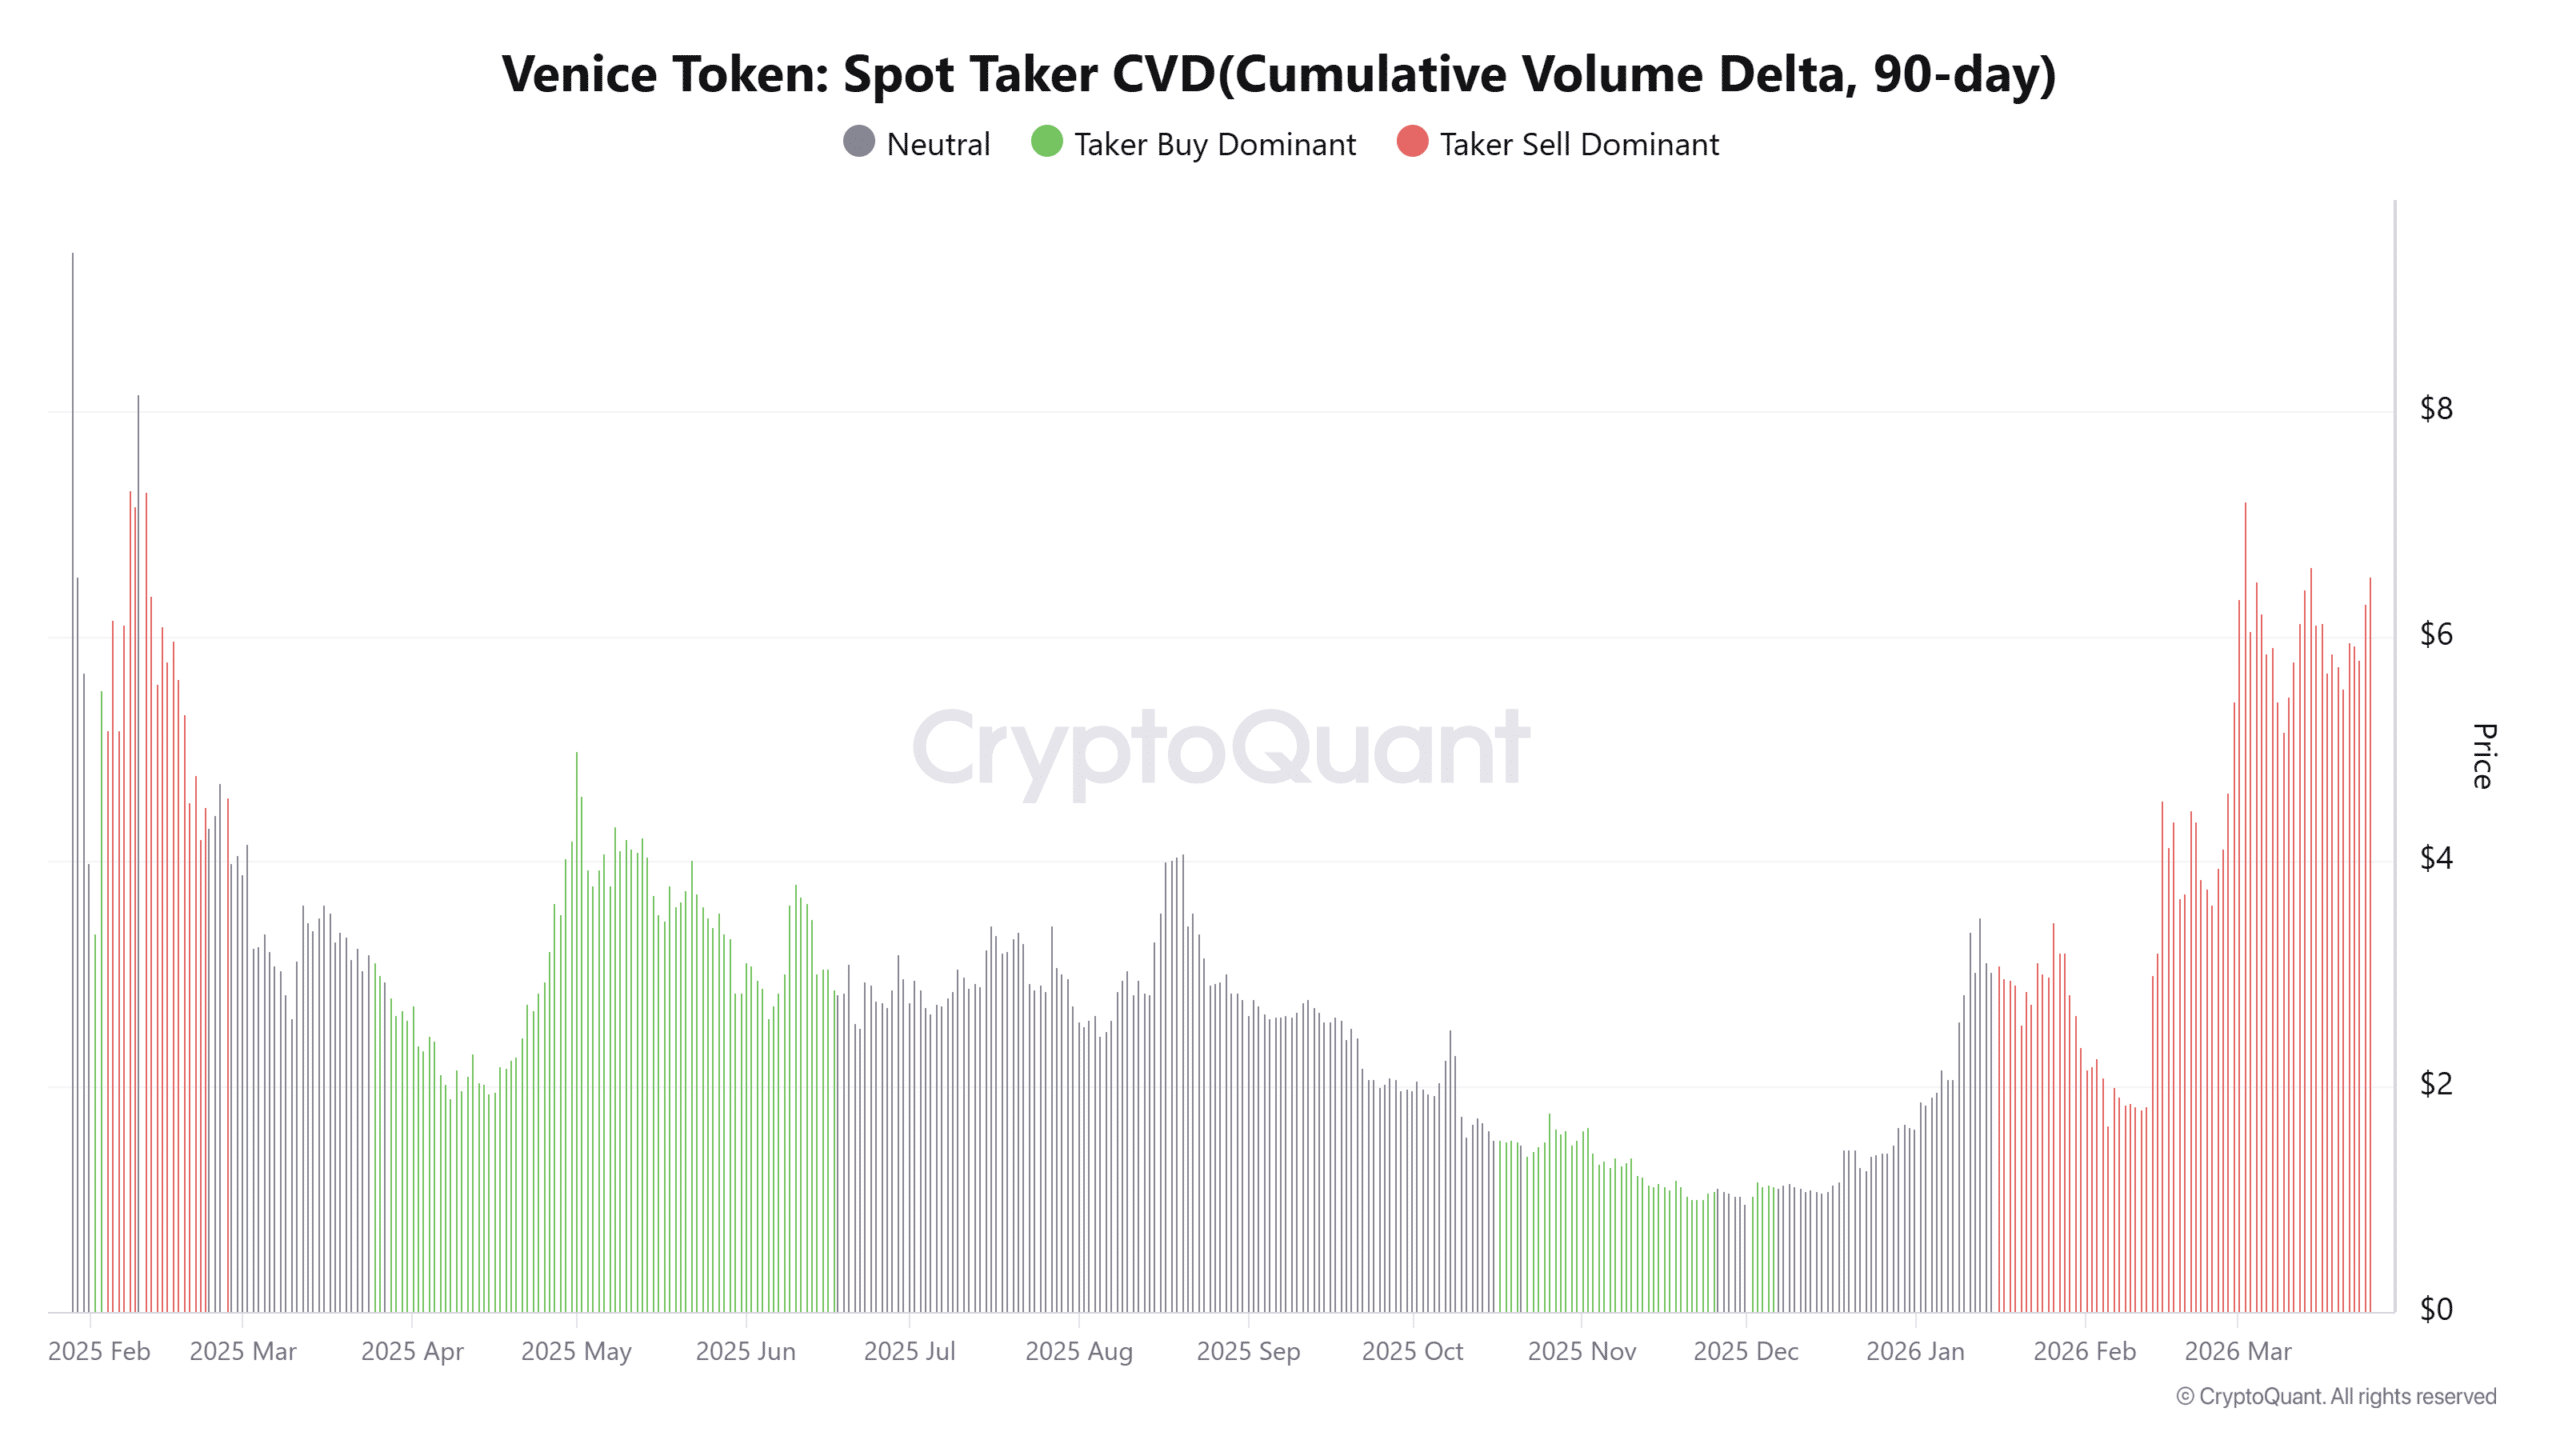
Spot Taker CVD remains sell-dominant over the past 90 days, revealing persistent aggressive selling beneath the rally.

This structure indicates that market participants continue executing sell orders even as price rises.

However, price has not declined, which suggests that larger buyers may be absorbing this supply.

This divergence highlights a key imbalance between visible selling and hidden demand. As a result, the rally depends on continued absorption to sustain upward movement.

If selling pressure intensifies without matching demand, the structure could weaken. However, as long as price holds, this absorption continues supporting the current trend.
Source: CryptoQuant

Open interest rise shows leveraged buildup into VVV breakout

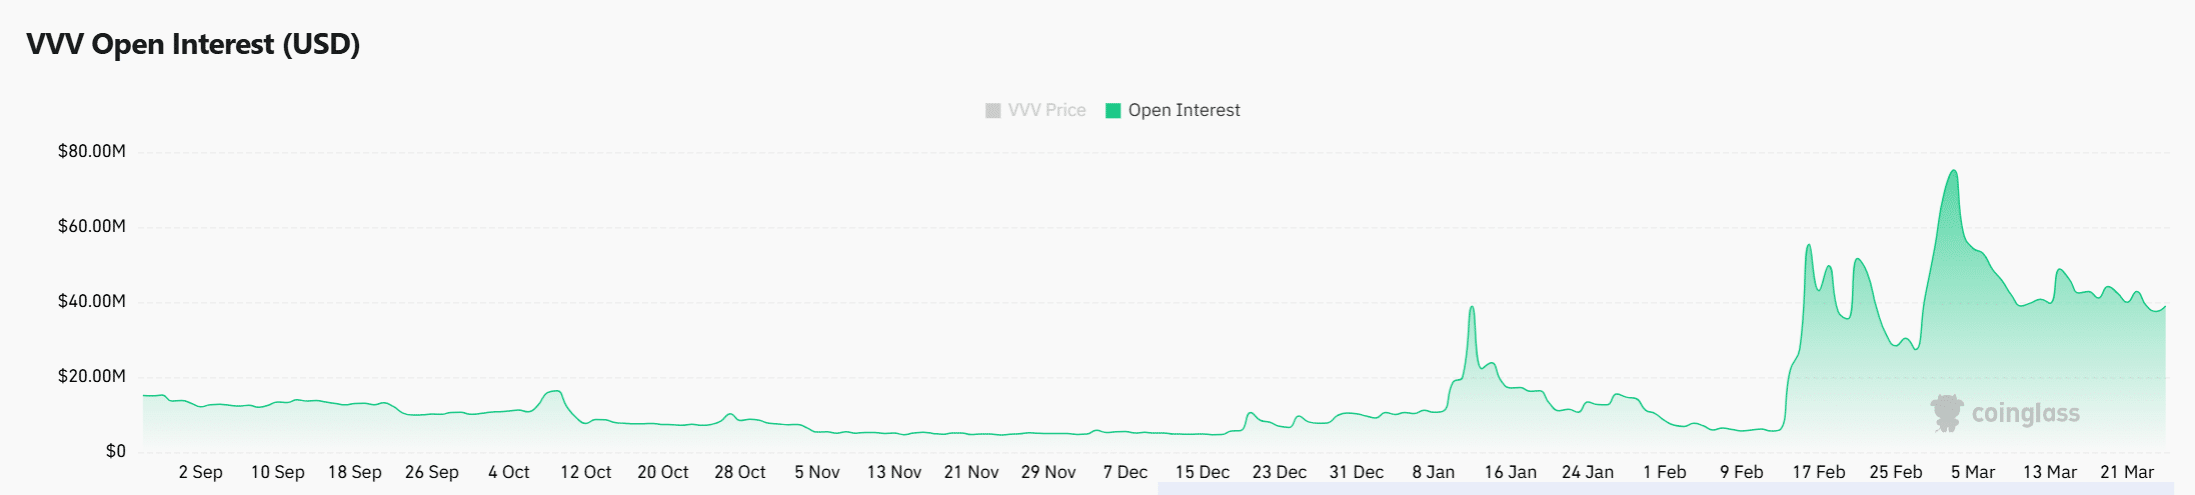
Open interest has increased by 18.74% to $43.21M, reflecting growing participation in derivatives markets.

This rise shows that traders are positioning aggressively as price breaks out of consolidation. However, leveraged positioning introduces volatility, especially near resistance zones.

As positions build, the market becomes sensitive to rapid price movements in either direction. This setup often leads to sharp expansions once liquidity gets triggered.

At the same time, rising open interest without strong confirmation from other indicators increases risk.

If price continues higher, these positions could fuel continuation, but any reversal would quickly unwind these leveraged trades.
Source: CoinGlass


VVV has broken out with strong volume support, which strengthens its bullish structure. However, weakening MACD signals and persistent sell pressure create underlying tension.

The rally can sustain if buyers continue absorbing supply and hold above $5.14. If that support fails, the breakout would likely weaken quickly under pressure.


Final Summary

  • VVV surged 14% to $6.40, backed by a 26% jump in Spot Volume. Breakout above the pennant shifted the structure from consolidation to expansion.
  • Open Interest rose 18%, signaling aggressive leveraged positioning. Rising leverage increases the risk of sharp moves, especially near resistance


Perguntas relacionadas

QWhat is the current price of Venice Token (VVV) and by what percentage has it surged?

AThe current price of Venice Token (VVV) is $6.40, and it has surged by 14.37%.

QWhat key resistance level does the article identify for VVV after its breakout?

AThe article identifies $6.68 as the immediate resistance level for VVV after its breakout.

QAccording to the MACD indicator, what divergence suggests a lack of full confirmation for the upward price movement?

AThe MACD has not crossed above the signal line, and the histogram has turned negative, indicating a divergence between the price expansion and the underlying bullish strength.

QWhat does the persistent sell-dominant Spot Taker CVD indicate about the market activity?

AThe persistent sell-dominant Spot Taker CVD indicates that there is aggressive selling pressure happening beneath the rally, which is being absorbed by larger buyers to sustain the price increase.

QWhy does the rise in Open Interest introduce increased risk for VVV price movement?

AThe 18.74% rise in Open Interest to $43.21M shows that traders are using significant leverage. This introduces volatility and the risk of sharp price movements in either direction, as these leveraged positions could quickly unwind if the price reverses.

Leituras Relacionadas

Within Strategy's Framework, STRC's Dividend Yield Remains at 12% as Share Price Stays Below Par Value

Michael Saylor, Executive Chairman of Strategy (MSTR), confirmed that the dividend rate for its STRC perpetual preferred shares will remain at 12.00% through August 2026. The rate has increased from 9% at its July 2025 launch to the current high via a "ratchet" mechanism, which permanently raises the rate by 0.5% whenever the share price falls below $95. This mechanism is intended to push the price back toward its $100 par value and support Strategy's "at-the-market" (ATM) program for issuing new shares to fund Bitcoin purchases. However, the mechanism has not worked as intended. STRC shares closed at $89.46 on July 31, remaining about 10-11% below par value despite the record-high dividend. Competition from rival Strive's higher-yielding SATA securities has pressured demand. The persistent discount has forced Strategy to suspend new STRC issuances via its ATM program, limiting this funding channel for Bitcoin acquisitions. STRC's struggles reflect Bitcoin's own volatility, as the preferred shares historically move in tandem. Analysts have warned the ratchet structure carries long-term, one-way risk. A law firm is investigating Strategy's ability to maintain dividend payments if Bitcoin's price stays low. Retail investors own roughly 83% of outstanding STRC shares, a group seen as prone to panic selling during downturns. In response, Strategy has established financial reserves, including a liquidity cushion covering about 26 months of dividend/interest obligations, and a $2 billion share buyback program alongside a Bitcoin monetization framework, though the company emphasized it is not obligated to sell any Bitcoin.

cryptonews.ruHá 21m

Within Strategy's Framework, STRC's Dividend Yield Remains at 12% as Share Price Stays Below Par Value

cryptonews.ruHá 21m

Analyst: Bitcoin's Price Will Drop to $60k in August, Then Rebound to $70k

Financial analyst Andrey Poroshin has provided a new forecast for Bitcoin's price dynamics in August. Poroshin, an analyst at the Bitbanker exchange, expects the cryptocurrency market to experience a downturn this month, with prices retesting the $60,000 level due to a lack of supportive macroeconomic catalysts. He noted that the recent US Federal Reserve decision to hold interest rates did not significantly impact the market, while inflation remains above the 2% target. Poroshin stated that Bitcoin is ending July under pressure from moderate volatility and a lack of new macroeconomic stimuli, leading to continued market caution. According to his base scenario, Bitcoin will drop to a range of $60,000 to $62,000 before recovering to $70,000. He pointed out that even $70,000 remains below the cost of mining in the US, which has prompted some miners to shift towards AI data center operations. Poroshin cited the winding down of BitMEX's operations as a potential catalyst for a price rebound, suggesting the exit of weaker players often coincides with market reversals and reduced short-term selling pressure. He believes Bitcoin is currently less susceptible to geopolitical shocks, such as the Iran-US conflict, and does not expect significant market changes in August related to the pending CLARITY Act. Looking ahead, Poroshin forecasts that September will bring more active price fluctuations driven by potential Fed rate decisions and possible discussions or approval of the CLARITY Act.

cryptonews.ruHá 21m

Analyst: Bitcoin's Price Will Drop to $60k in August, Then Rebound to $70k

cryptonews.ruHá 21m

Trading

Spot
活动图片




