US Stocks Surge 16% in Two Months: Only 4 Occurrences in History, the Most Recent Was Just Before the 1987 Crash

marsbitPublicado em 2026-06-03Última atualização em 2026-06-03

Resumo

U.S. stocks have surged 16% over April and May, a gain seen only four times since WWII, according to Deutsche Bank strategist Henry Allen. Three prior instances followed recessions, but the sole non-recession precedent was in early 1987, months before the "Black Monday" crash. The current rally is underpinned by AI enthusiasm and strong data, but its speed without an economic recovery is historically unprecedented. Meanwhile, credit spreads remain near record lows despite growing consumer strain—the U.S. savings rate hit just 2.6% in April, a level last seen before the Global Financial Crisis, and consumer sentiment is at its lowest since 1952. Market risks are concentrated. While stocks and credit markets appear immune to geopolitical tensions, sovereign bonds tell a different story. Treasury yields have tracked oil prices and recently hit multi-year highs, creating a widening divergence with equities. Surprisingly stable oil prices, despite the prolonged closure of the Strait of Hormuz, have been a key pillar for risk assets. However, if the blockage persists, this support could fade, raising the risk of a stagflation shock not currently priced in.

Original Author: Zhao Ying

Original Source: Wall Street News

The recent strong rally in U.S. stocks is triggering historical alarms. The S&P 500 index has accumulated a 16% gain from April to May, a magnitude of increase that has occurred only 4 times since World War II. Three of those instances happened during recovery phases following economic recessions. The sole precedent not in a post-recession context occurred just months before the "Black Monday" crash in 1987.

Deutsche Bank macro strategist Henry Allen points out that the current rally is not taking place against a backdrop of post-recession recovery, making the historical comparison particularly stark. Meanwhile, credit spreads remain at historically low levels, but pressure signals from the consumer side are accumulating, expectations for Federal Reserve interest rate hikes are heating up, and the divergence between sovereign bond markets and stock markets continues to widen.

With multiple risk factors converging, market tail risks are becoming exceptionally concentrated. Henry Allen wrote in the report, "The tail risks in the current distribution are exceptionally prominent, both at the geopolitical level and at the market level."

Historical Precedents Are Rare, Only One Non-Recession Example Exists

The S&P 500's two-month gain of 16% from April to May has only 4 precedents since WWII.

Three of them occurred during powerful rebounds following recessions: the post-COVID-19 recovery from April to May 2020, the post-global financial crisis rebound from March to April 2009, and the recovery rally following the first oil crisis from January to February 1975.

The 4th instance was from January to February 1987. That was just months before October's "Black Monday" — the day the S&P 500 plunged 20% in a single session.

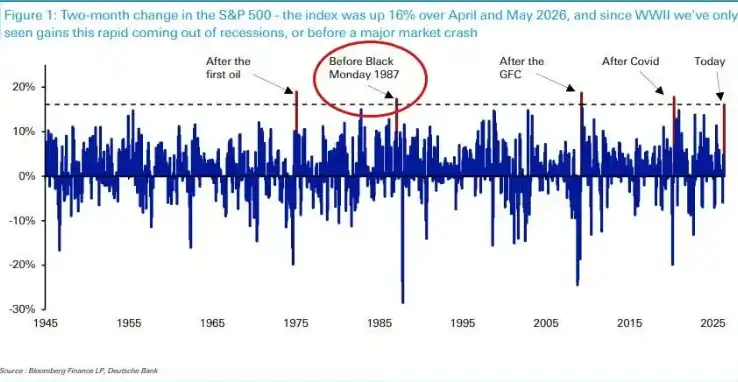
Henry Allen emphasizes that the current rally has its fundamental support, including high enthusiasm for artificial intelligence and strong economic data, but "the pace of gains itself has broken all recent precedents." In an economy not emerging from a recession, a rebound of this speed has never ended well in history.

Furthermore, the S&P 500 is on track to achieve its fourth consecutive year of double-digit gains, a record not seen since the late 1990s.

Excessive Optimism in Credit Markets, Consumer Pressure Signals Overlooked

The strength in equities has also spread to credit markets. Credit spreads in both the US and Europe are currently narrower than before the US-Iran conflict erupted, showing the market's high tolerance for risk.

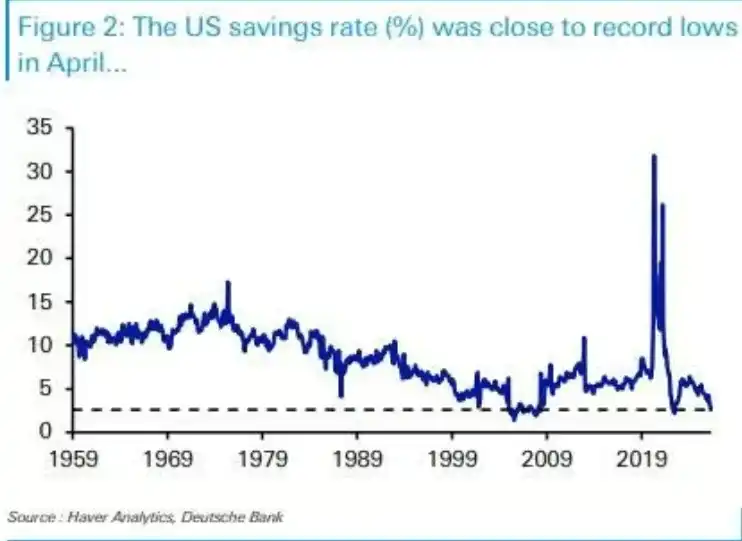
However, warning signals at the consumer level are accumulating. The US savings rate was just 2.6% in April, a similarly low level historically seen in only two other periods: a single month in 2022 (when pandemic-era excess savings were being depleted) and just before the global financial crisis erupted. Meanwhile, the University of Michigan Consumer Sentiment Index hit its all-time low in May since records began in 1952.

The monetary policy environment is also tightening. The European Central Bank is widely expected to raise interest rates this month, and market bets on Federal Reserve rate hikes in 2026 are heating up — with US PCE inflation reaching 3.8% year-on-year in April, providing support for this expectation.

Henry Allen notes that historically, hawkish stances from the Federal Reserve have often coincided with widening credit spreads, as seen in 2022, late 2018, and from 2015 to 2016. The current calm in credit markets forms a clear divergence from this historical pattern.

Bond Market Bearing Pressure Alone, Divergence with Stocks Continues to Widen

While equity and credit markets show high immunity to geopolitical risks, sovereign bond markets have charted a distinctly different course.

Over the past month, the yield on the 10-year US Treasury note has almost completely tracked oil price movements, clearly decoupling from other asset classes. In mid-May, sovereign bond yields hit multi-year highs: the 30-year US Treasury yield rose to 5.18%, the highest since 2007; the 10-year German bund yield climbed to 3.19%, the highest since 2011.

At that time, stocks were just a step away from record highs, while bond yields were already at levels not seen in over a decade. This divergence shows no signs of convergence to this day.

Henry Allen believes that bond markets more directly price in inflation and fiscal risks, hence reacting more sensitively to geopolitical shocks. The persistent divergence between stock and bond markets is itself a manifestation of current market fragility.

Unexpectedly Stable Oil Prices: A Key Pillar for Risk Assets

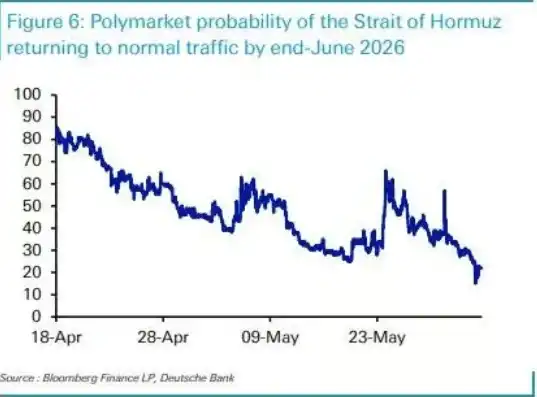
The blockade of the Strait of Hormuz has lasted far longer than initial market expectations, yet the reaction in oil prices has been surprisingly mild, which partly explains the resilience of risk assets.

When the US-Iran conflict erupted on February 28, the White House initially estimated the operation would last 4 to 6 weeks. However, the Strait of Hormuz remains blocked to this day. According to prediction market Polymarket data, the probability of normal navigation resuming by the end of June has plummeted from around 80% in mid-April to just 22%.

Despite this, the oil futures curve has remained relatively stable. Just two weeks after the conflict began, on March 13, the 6-month Brent crude futures contract settled at $85.66 per barrel. On June 1, the same contract was quoted around $84.88, barely moving.

Henry Allen points out that it is precisely because the oil futures curve has not shifted significantly higher that investors have not priced in serious stagflation risks, thereby avoiding larger-scale selling of risk assets. However, he warns that if the Strait of Hormuz blockade persists, whether this support can be maintained remains uncertain.

Perguntas relacionadas

QAccording to the article, how many times since WWII has the S&P 500 gained 16% in a two-month period, and what is the key characteristic of the only non-recessionary precedent?

AAccording to the article, the S&P 500 has gained 16% in a two-month period only 4 times since WWII. Three of these instances occurred during recoveries from recessions. The only non-recessionary precedent was in January-February 1987, which preceded the 'Black Monday' crash later that year.

QWhat consumer-related warning signs are mentioned in the article as potential risks being overlooked by the market?

AThe article mentions two key consumer-related warning signs: the U.S. savings rate was only 2.6% in April (a level historically only seen briefly in 2022 and before the global financial crisis), and the University of Michigan Consumer Sentiment Index hit its lowest recorded level since 1952 in May.

QWhat historical anomaly does the article point out regarding the current relationship between Federal Reserve policy expectations and credit spreads?

AThe article points out a historical anomaly where tightening Federal Reserve policy has typically coincided with widening credit spreads, as seen in 2022, late 2018, and 2015-2016. However, currently, despite rising expectations for Fed rate hikes, credit spreads remain at historically low levels, showing a clear divergence from this past pattern.

QHow has the sovereign bond market behaved differently from the stock and credit markets in response to recent geopolitical risks?

AWhile stock and credit markets have shown resilience, the sovereign bond market has been under significant pressure. Specifically, the 10-year U.S. Treasury yield has closely followed oil price movements, decoupling from other assets. Yields on long-term U.S. and German government bonds recently hit multi-year highs, indicating the bond market is more directly pricing in inflation and fiscal risks.

QWhy has the oil market's reaction to the prolonged closure of the Strait of Hormuz been described as a 'key pillar' for risk assets?

AThe oil market's reaction has been a 'key pillar' for risk assets because, despite the Strait of Hormuz closure lasting much longer than initially expected, oil futures prices have remained surprisingly stable. This lack of a sharp upward move in the oil futures curve has prevented investors from pricing in severe stagflation risks, thereby avoiding a larger sell-off in riskier assets like stocks.

Leituras Relacionadas

The Rally That Wasn't

The article analyzes Bitcoin's sharp decline amid a shift in macroeconomic expectations, with strong US job data leading markets to price out Fed rate cuts. Bitcoin fell 13% to around $67,000, triggering significant outflows from US spot ETFs and indicating institutional de-risking. On-chain data confirms a bearish structure. Price has dropped back into the "bear market range," with the Short-Term Holder Cost Basis falling below a key mean level—a pattern last seen in early 2022. The profitability bias has collapsed, with loss realization now dominating, mirroring a panic wave from February. Recent buyers who accumulated near the $82k top are under pressure, and loss realization is accelerating across both short-term and long-term holder cohorts. Off-chain, the rally failed at the aggregate US ETF cost basis near $83k, turning it into resistance. Spot market demand has deteriorated sharply, with sellers dominating order books. While a major long liquidation event cleared over $400M in leverage, spot buyers have not returned to absorb supply. Options markets show sustained demand for downside protection (elevated put premiums) but not panic, with volatility premiums near three-month highs. The conclusion is that the market remains fragile, with overhead supply from trapped ETF investors, weak spot demand, and accelerating losses. Without a return of spot buying and a reclaim of key cost bases, Bitcoin is vulnerable to further downside within the prevailing bear market structure.

insights.glassnodeHá 2h

The Rally That Wasn't

insights.glassnodeHá 2h

Trading

Spot
Futuros

Artigos em Destaque

Como comprar 4

Bem-vindo à HTX.com!Tornámos a compra de 4 (4) simples e conveniente.Segue o nosso guia passo a passo para iniciar a tua jornada no mundo das criptos.Passo 1: cria a tua conta HTXUtiliza o teu e-mail ou número de telefone para te inscreveres numa conta gratuita na HTX.Desfruta de um processo de inscrição sem complicações e desbloqueia todas as funcionalidades.Obter a minha contaPasso 2: vai para Comprar Cripto e escolhe o teu método de pagamentoCartão de crédito/débito: usa o teu visa ou mastercard para comprar 4 (4) instantaneamente.Saldo: usa os fundos da tua conta HTX para transacionar sem problemas.Terceiros: adicionamos métodos de pagamento populares, como Google Pay e Apple Pay, para aumentar a conveniência.P2P: transaciona diretamente com outros utilizadores na HTX.Mercado de balcão (OTC): oferecemos serviços personalizados e taxas de câmbio competitivas para os traders.Passo 3: armazena teu 4 (4)Depois de comprar o teu 4 (4), armazena-o na tua conta HTX.Alternativamente, podes enviá-lo para outro lugar através de transferência blockchain ou usá-lo para transacionar outras criptomoedas.Passo 4: transaciona 4 (4)Transaciona facilmente 4 (4) no mercado à vista da HTX.Acede simplesmente à tua conta, seleciona o teu par de trading, executa as tuas transações e monitoriza em tempo real.Oferecemos uma experiência de fácil utilização tanto para principiantes como para traders experientes.

616 Visualizações TotaisPublicado em {updateTime}Atualizado em 2026.06.02

Como comprar 4

Discussões

Bem-vindo à Comunidade HTX. Aqui, pode manter-se informado sobre os mais recentes desenvolvimentos da plataforma e obter acesso a análises profissionais de mercado. As opiniões dos utilizadores sobre o preço de 4 (4) são apresentadas abaixo.

活动图片