Unsteady Ground, Room to Bounce

insights.glassnodePublicado em 2026-03-04Última atualização em 2026-03-04

Resumo

Bitcoin remains in a tenuous consolidation below the $70k resistance level, with weakening buy-side momentum and declining realized profits. The Percent of Supply in Profit has fallen to levels historically associated with early bear markets. Short-term holder cost basis near $70k presents a key resistance zone. However, signs of stabilization are emerging: spot and ETF selling pressure is moderating, derivatives leverage is compressing, and options markets show fading downside fear with growing upside call interest around the $75k strike. The market appears to be transitioning from a stressed regime toward a more balanced state, though a sustained recovery depends on renewed spot demand.

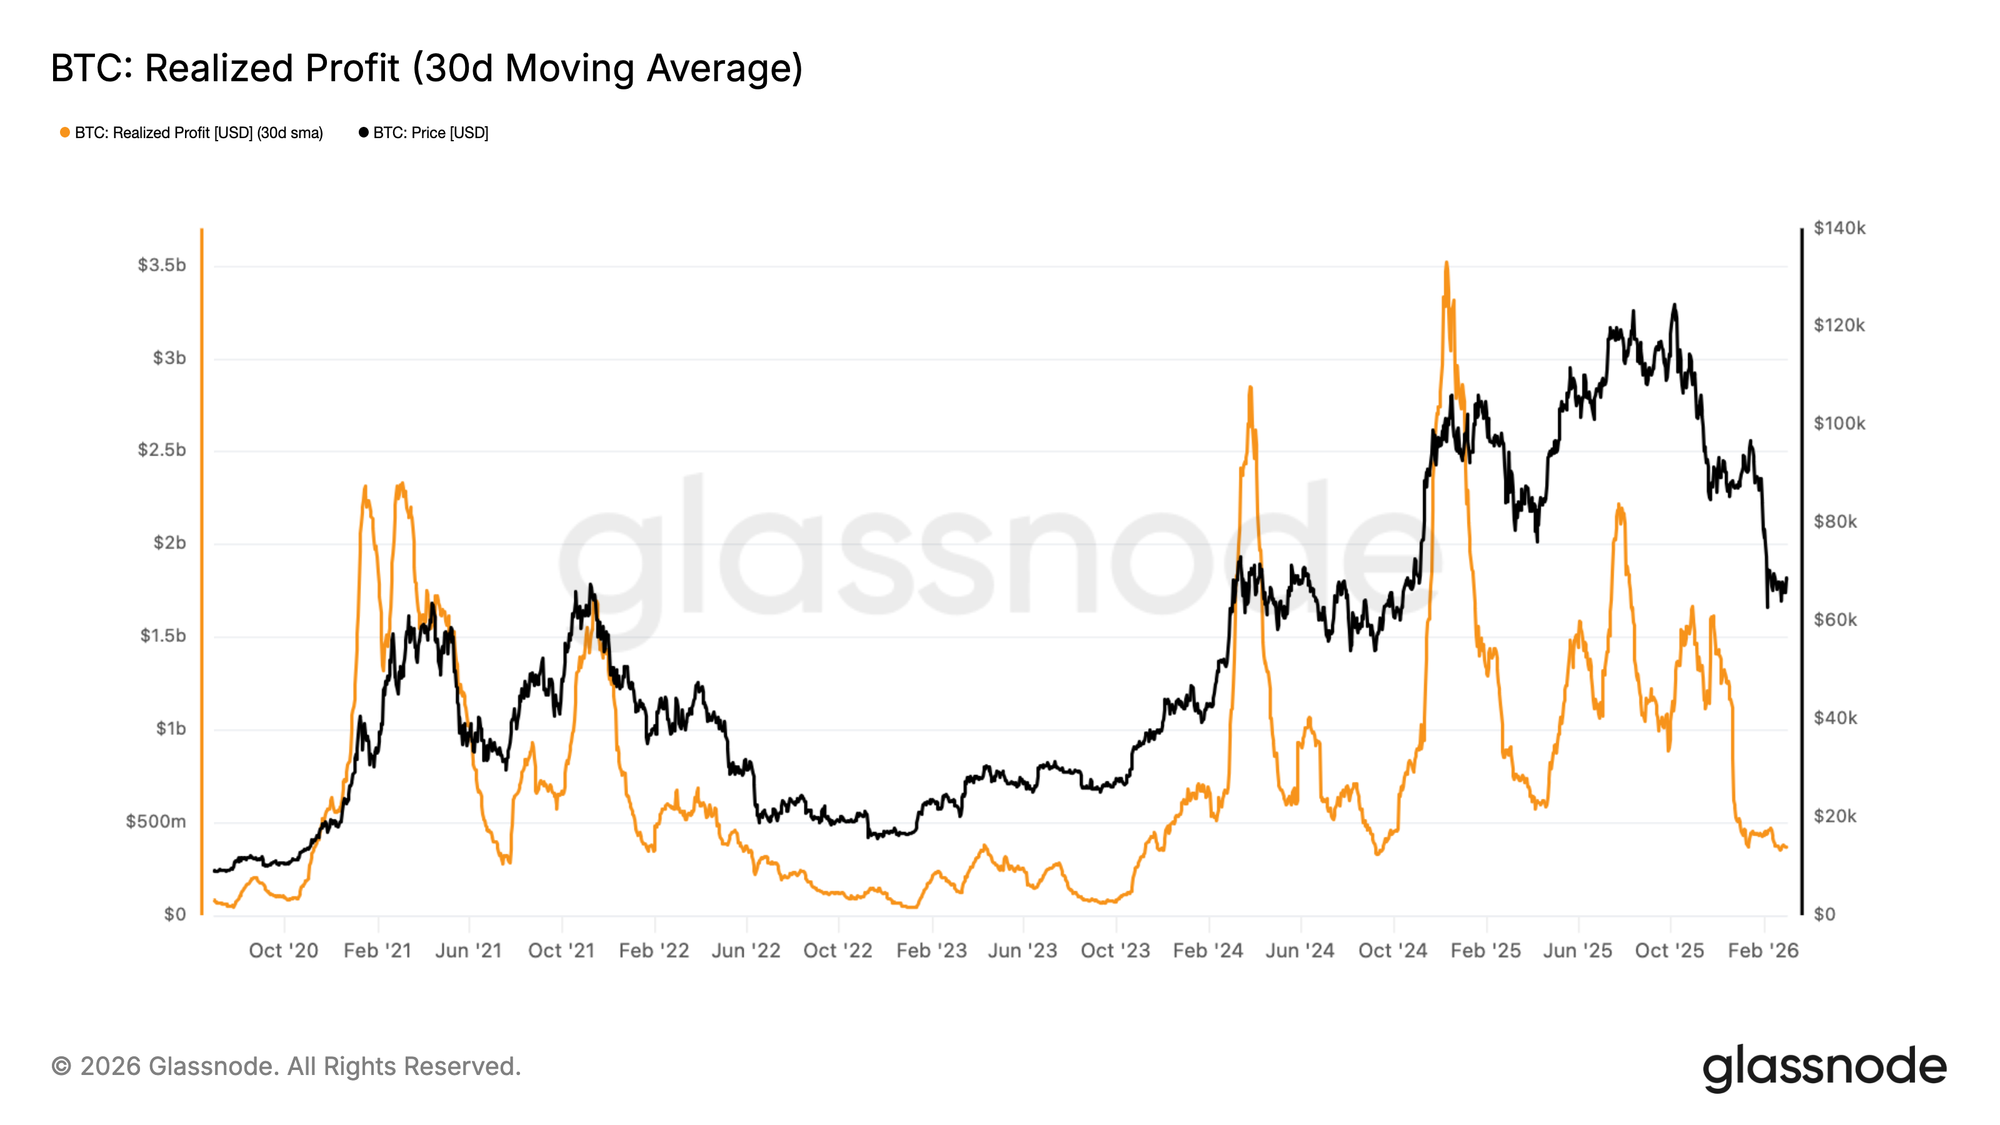
Since early February, Bitcoin has repeatedly failed to post a weekly close above $70k, establishing this region as a meaningful near-term resistance level. To assess whether this price rejection reflects a genuine deterioration in demand, we turn to the 30-day Simple Moving Average (30D-SMA) of Realized Profit, a metric that aggregates the USD-denominated profit locked in by on-chain participants at the moment coins are spent, smoothed to filter short-term noise.

As price stabilized beneath the $70K threshold, this indicator contracted sharply from above $1B per day to approximately $370M per day, a decline of roughly 63%. This compression in monthly-averaged realized profit signals that the cohort of buyers willing to transact at a premium has materially thinned, with buy-side liquidity now at its weakest since the August–September 2024 period.
Taken together, the evidence suggests that upside momentum has stalled, leaving the price in a state of directionless consolidation until fresh demand catalysts emerge.

Live Chart

Regime Detection in Bear Market

Sideways price action is a recurring structure across both bull and bear market cycles, therefore context is everything. Two periods of horizontal consolidation can carry vastly different implications depending on the underlying demand regime, making it essential to look beneath price for corroborating evidence.

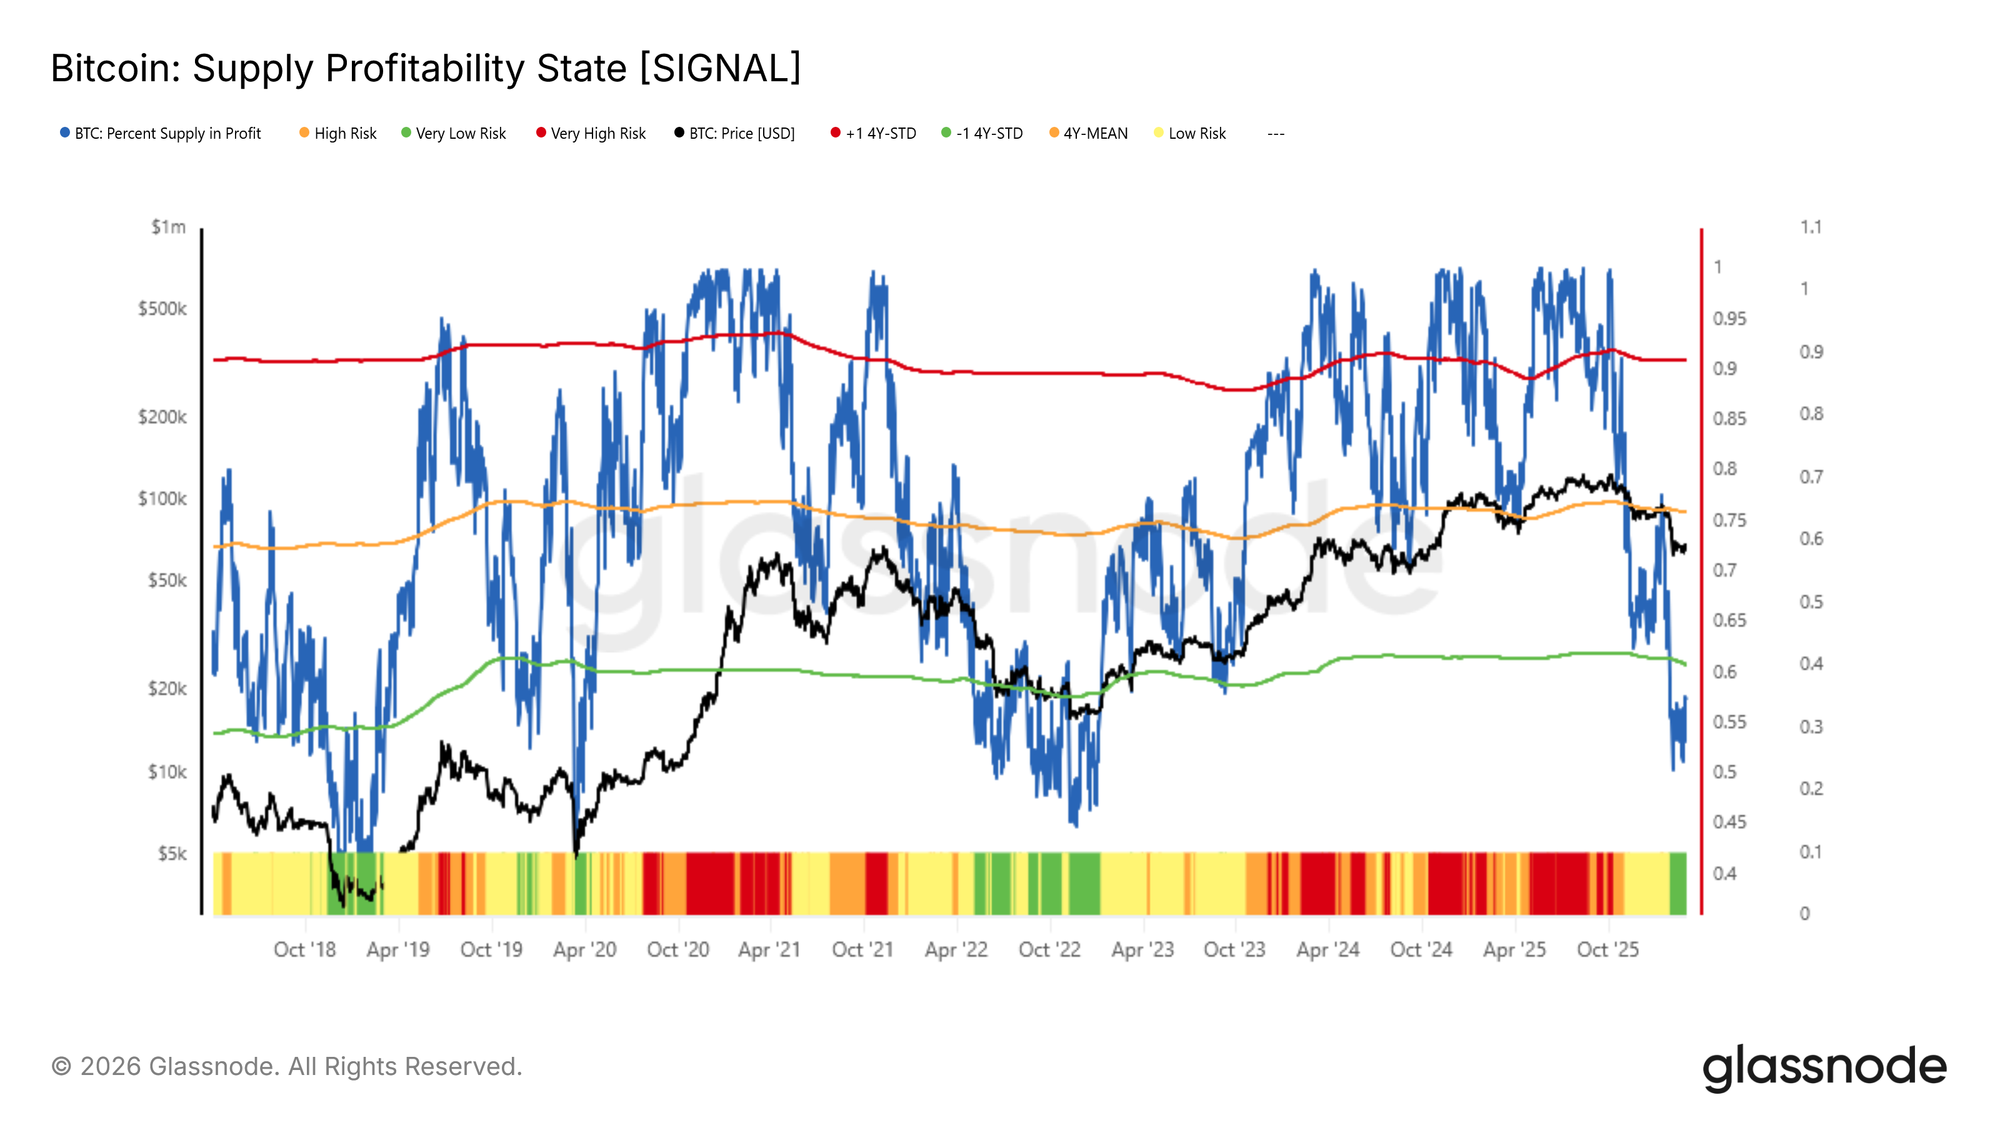
One effective lens for this purpose is the Percent of Supply in Profit, which measures the share of circulating Bitcoin supply held at an unrealized gain relative to each coin's on-chain acquisition cost.

When broadly elevated, this metric reflects widespread investor confidence; when it deteriorates, it signals a growing cohort of underwater holders, a condition historically associated with sustained selling pressure.

Since early February, this indicator has broken below its -1 standard deviation threshold near 60%, and currently sits at approximately 57%. Readings at this level have historically coincided with the early stages of deep bear markets, most notably May 2022 and November 2018. This suggests the present consolidation may be less a springboard for recovery, and more a continuation of the prevailing adverse market regime in mid-term.

Live Chart

Short-Term Relief Rallies and the Cost Basis Ceiling

Despite the headwinds posed by diminishing buy-side liquidity and a market regime starved of broad unrealized profitability, the multi-week sideways consolidation is not without a constructive interpretation. A local equilibrium of this nature can, and often does, precede short-term relief rallies.

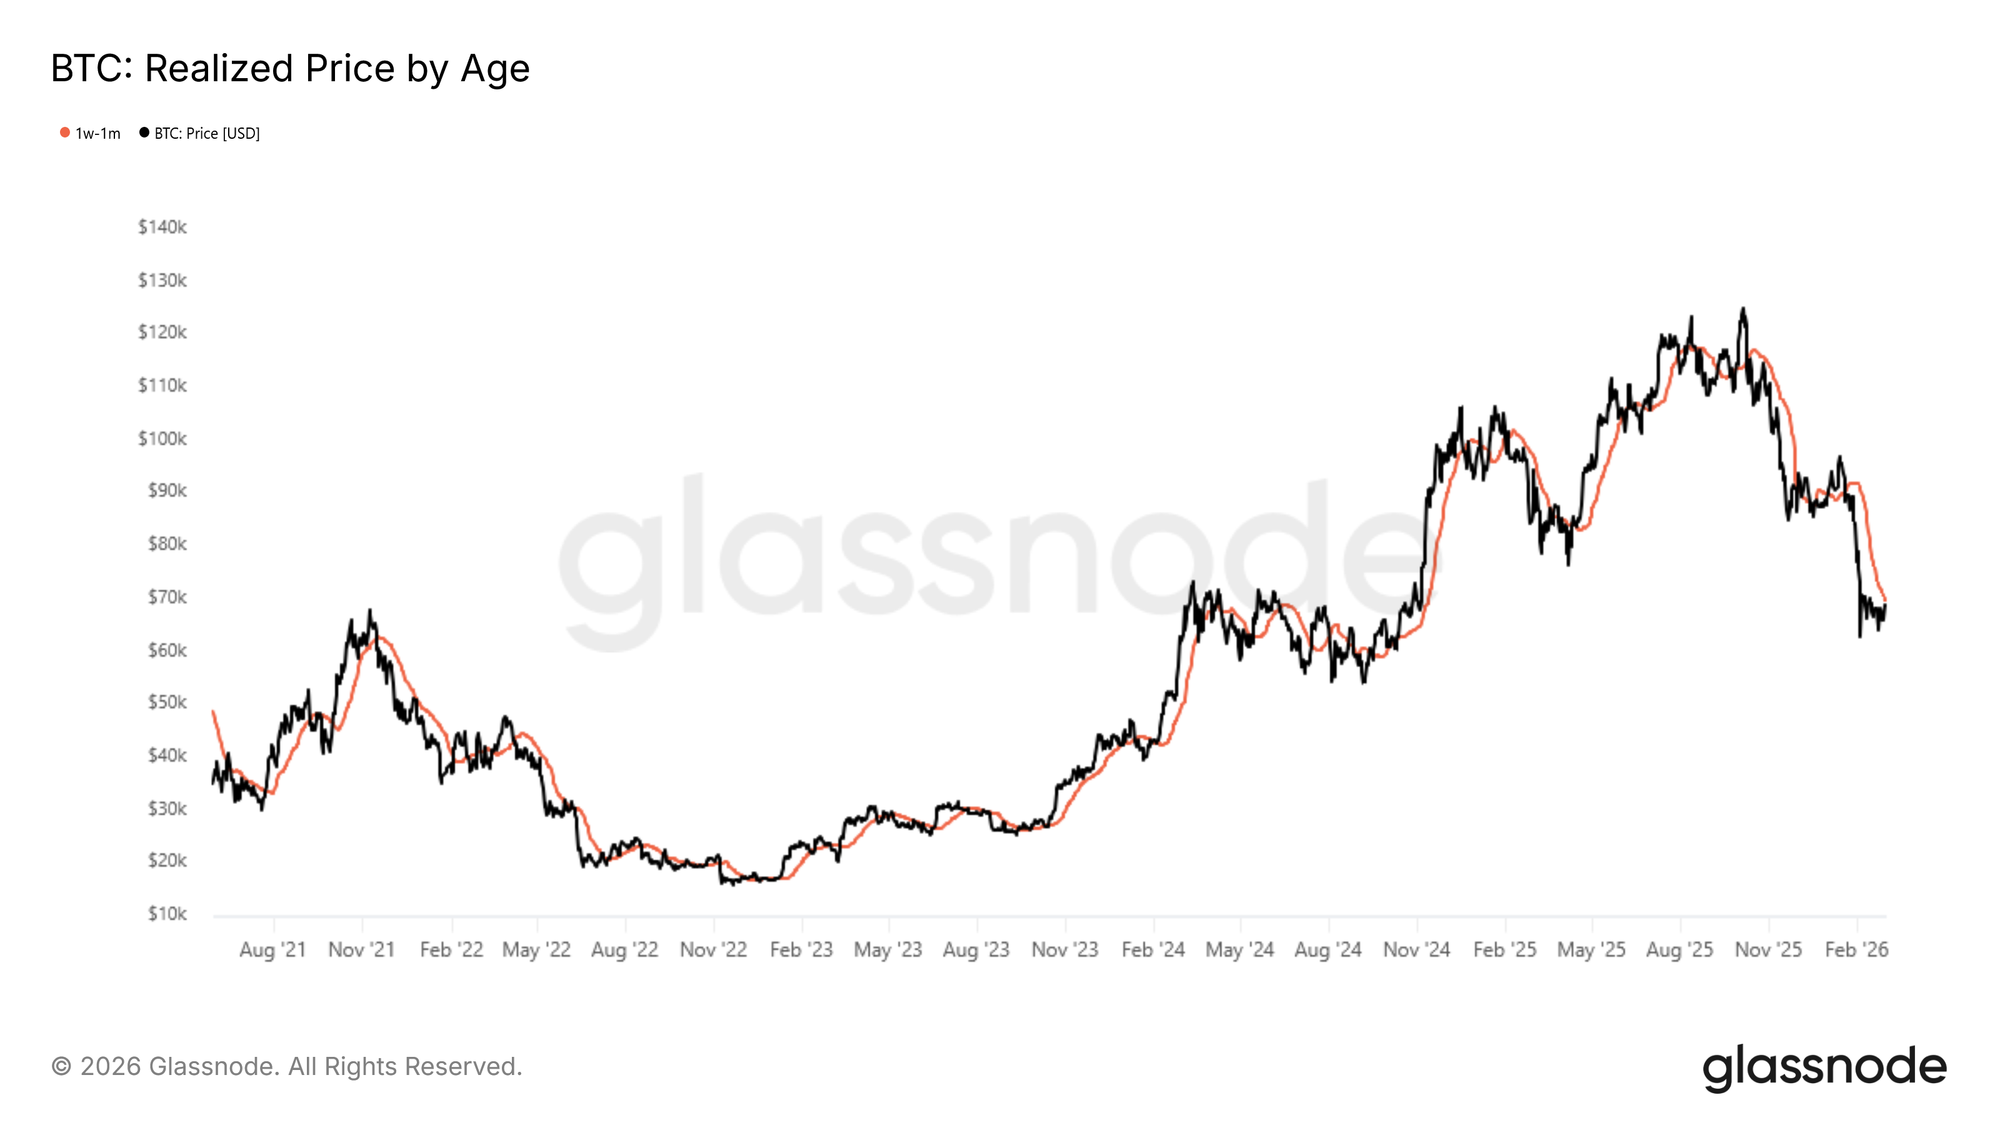
A practical on-chain tool for gauging the potential exhaustion point of such rallies is the Short-Term Holder Cost Basis, specifically for coins aged between one week and one month. This cohort represents the most recent wave of market participants, whose acquisition price acts as a key behavioral anchor: in the deeper stages of a bear market, local bounces tend to stall as these recent buyers approach breakeven, incentivizing them to exit positions or lock in thin profit margins before conditions deteriorate further.

Currently, the cost basis of this 1W–1M holder cohort sits near $70k, meaning the ±2% zone surrounding this level — roughly $68.5k to $71.5k— represents a significant potential resistance and distribution zone for any near-term price recovery.

Live Chart

Off-Chain Insights

Spot Flows Shows Signs of Recovery

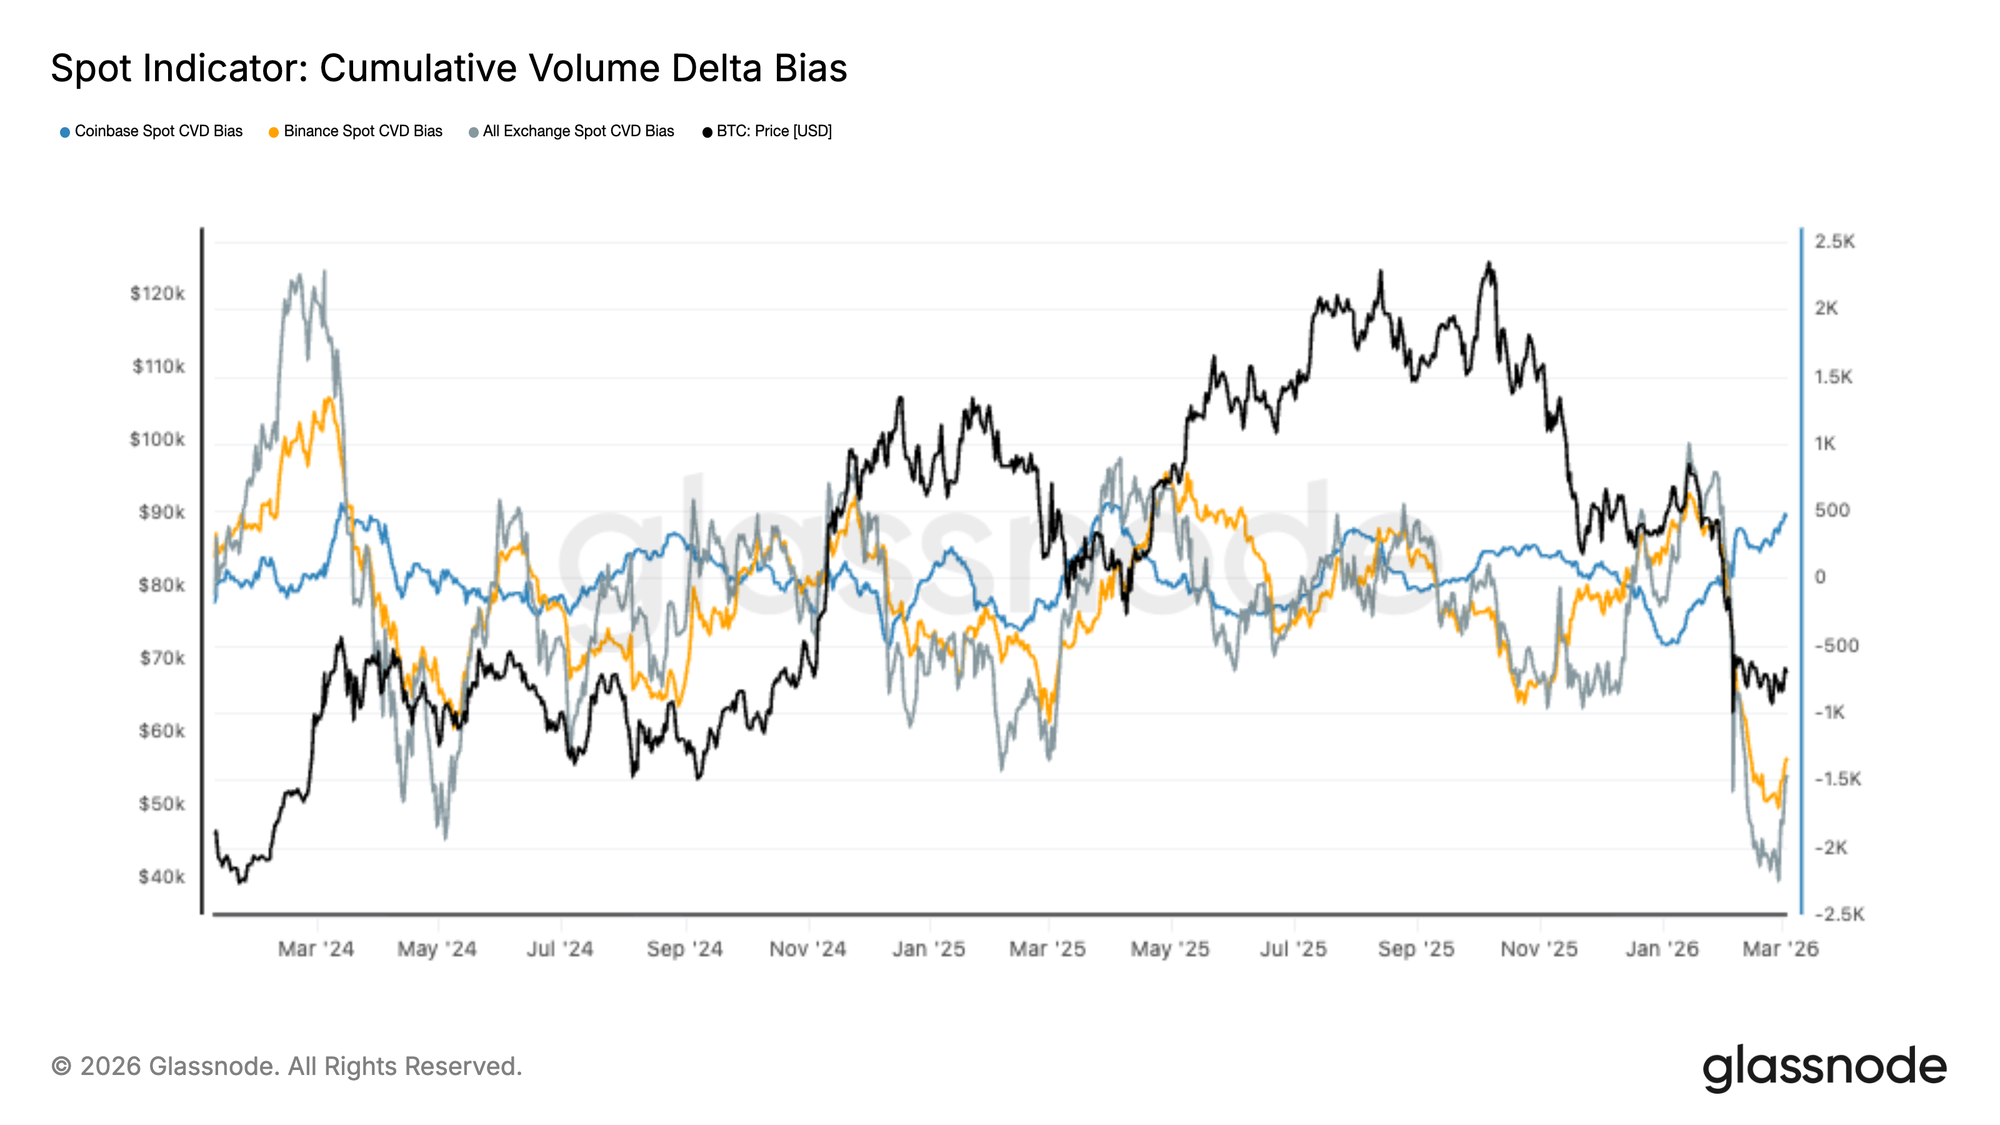
Spot markets recently experienced a sharp wave of sell-side dominance, with Cumulative Volume Delta (CVD) across major exchanges plunging to deeply negative levels as aggressive market sell orders drove the latest price drawdown.

Over the past few days, however, the pace of selling appears to be moderating. Coinbase spot CVD has begun to rebound, suggesting early signs of renewed bid-side activity, while Binance and aggregate exchange flows remain weak but are no longer accelerating lower.

This shift hints that the most intense phase of spot-driven distribution may be easing. Nevertheless, a sustained recovery will likely require broader improvement in spot bid absorption across multiple exchanges before stronger accumulation dynamics can take hold.

Live Chart

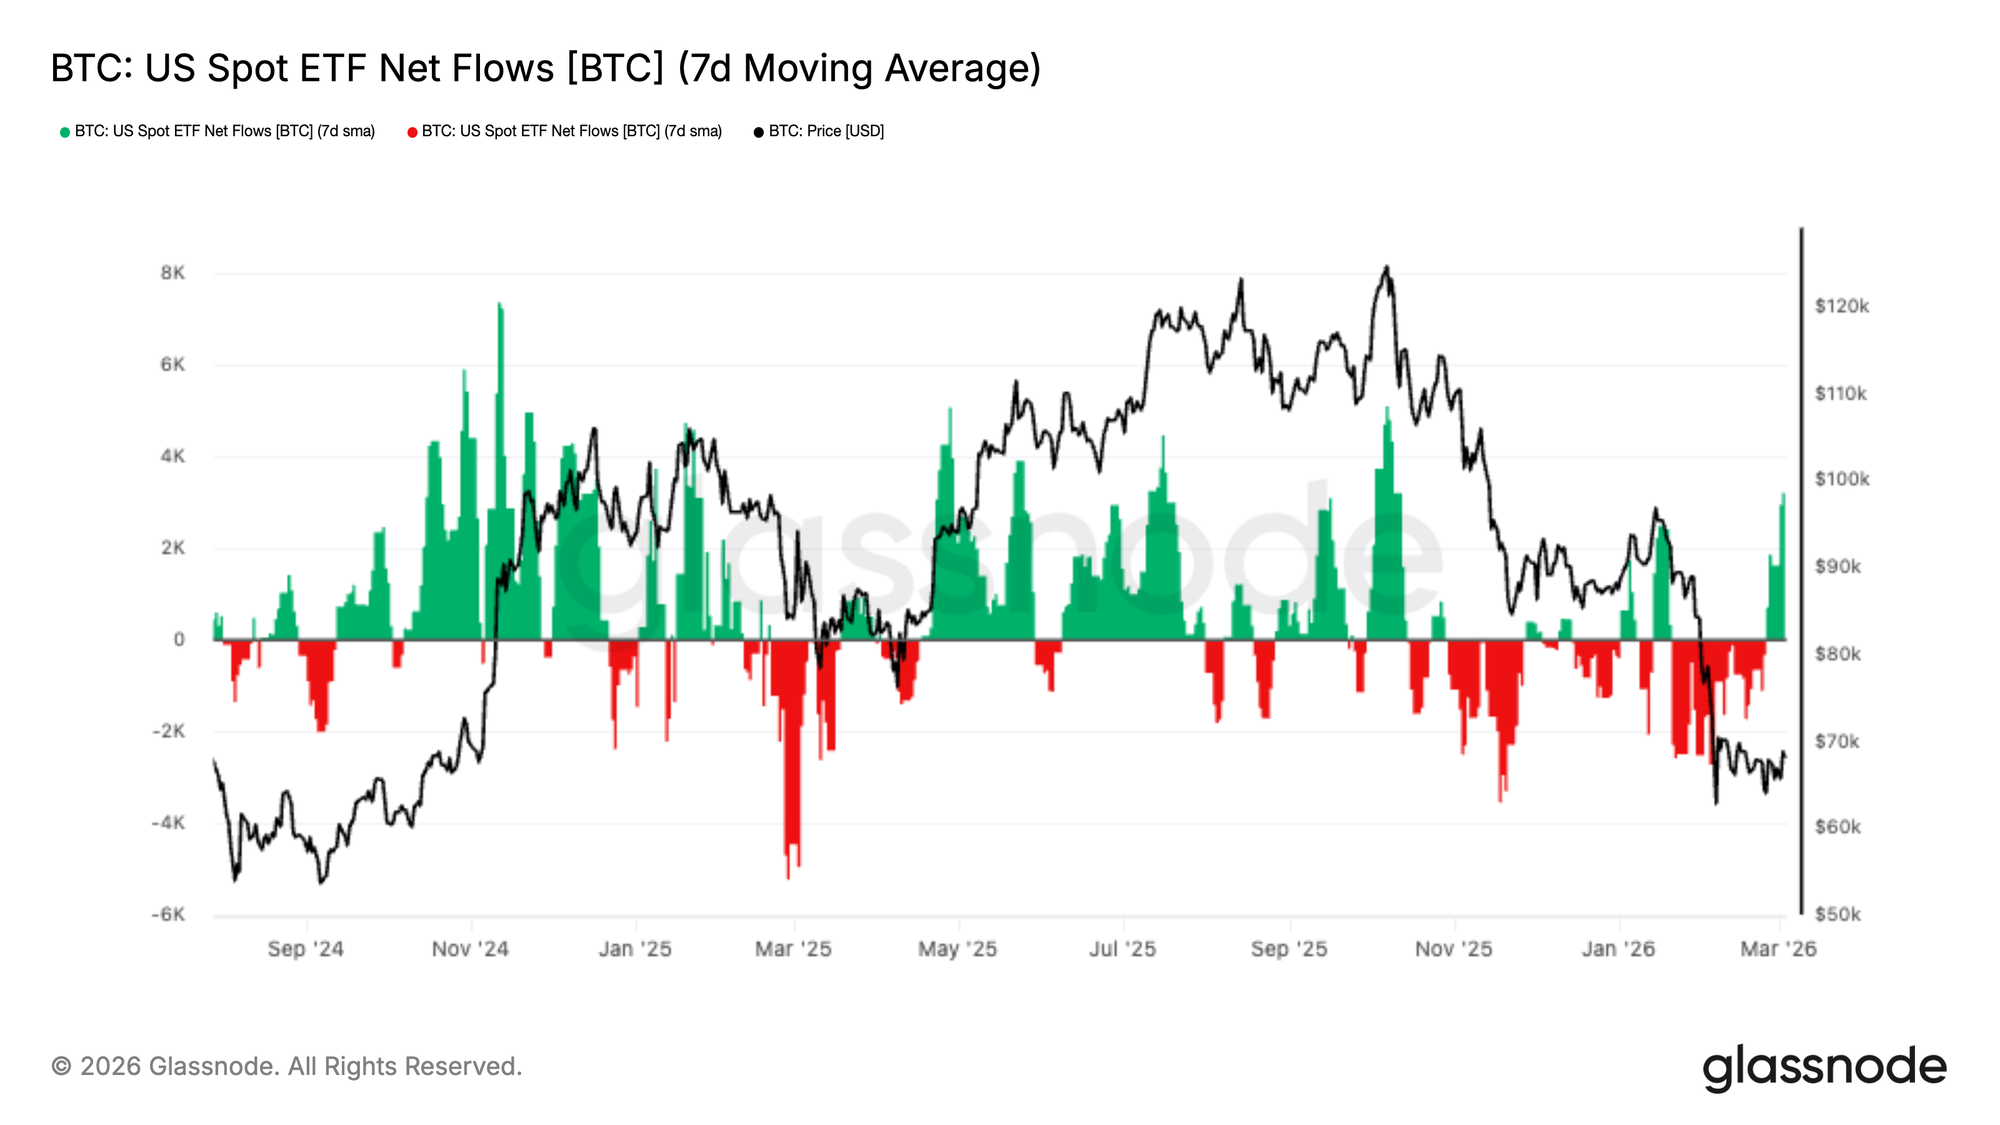
ETF Outflows Ease as Early Inflows Reappear

US Spot Bitcoin ETFs experienced sustained outflows during the recent market decline, reflecting persistent institutional de-risking as prices moved lower. The 7-day moving average of net flows remained negative for several weeks, reinforcing the broader risk-off environment across regulated investment channels.

Over the past few days, however, flows have begun to stabilize, with the first signs of renewed inflows emerging. This shift suggests that institutional selling pressure may be moderating as Bitcoin consolidates near recent lows.

While it is too early to confirm a durable reversal in demand, a continued recovery in ETF inflows would signal improving institutional sentiment and could provide an important source of spot-side support for the market.

Live Chart

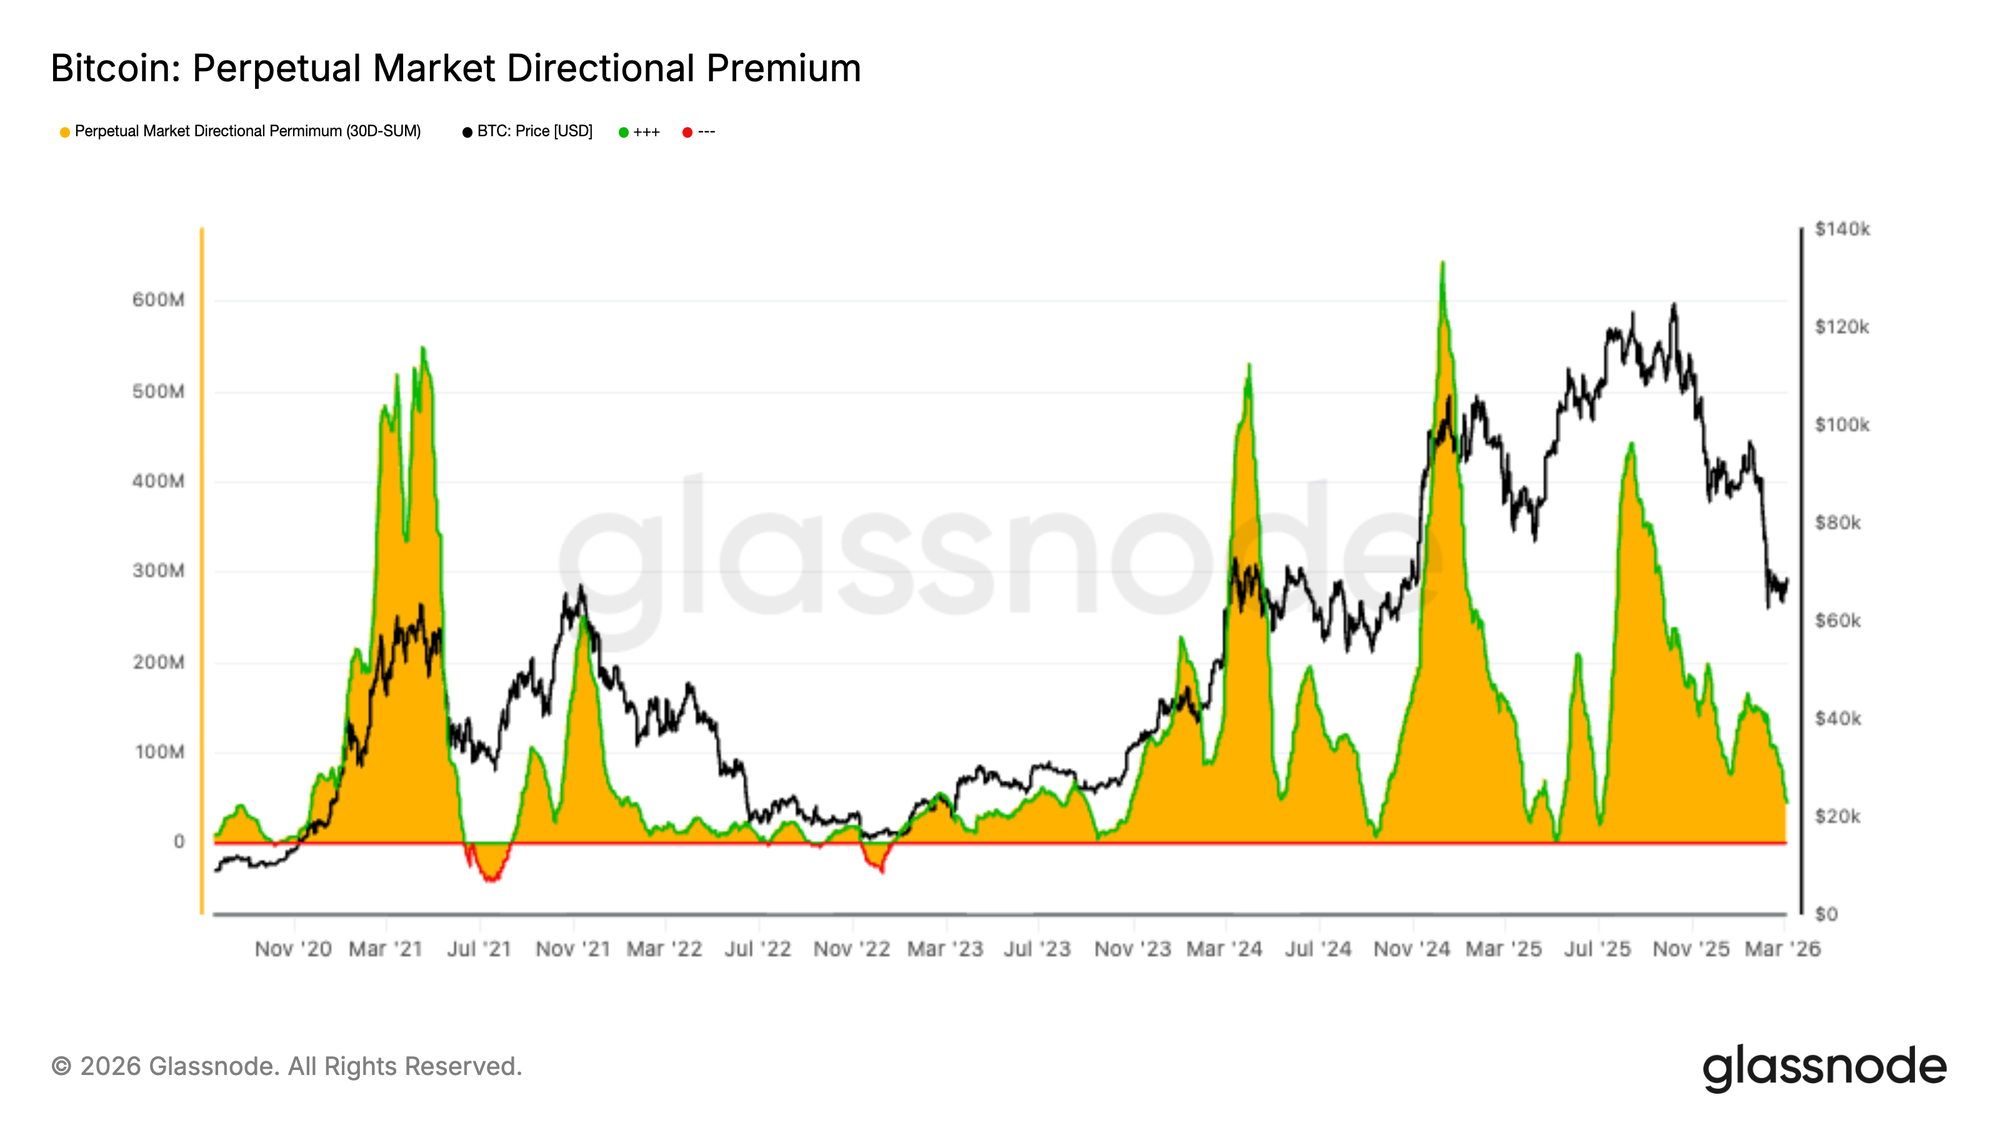
Perpetual Premium Continues to Compress

The Perpetual Market Directional Premium continues to trend lower, reflecting a sustained reduction in bullish positioning across perpetual futures markets. The metric has declined steadily in recent weeks as leverage and directional conviction have cooled alongside the broader market pullback.

Over the past few days, the premium has compressed further toward cycle lows, signalling that speculative long exposure is continuing to unwind. This dynamic suggests that derivatives traders remain cautious, with demand for leveraged upside exposure notably subdued.

While the decline reflects weakening bullish momentum, it also indicates that excess leverage is being flushed from the system. A stabilization in the premium could signal that derivatives positioning is approaching a more neutral footing.

Live Chart

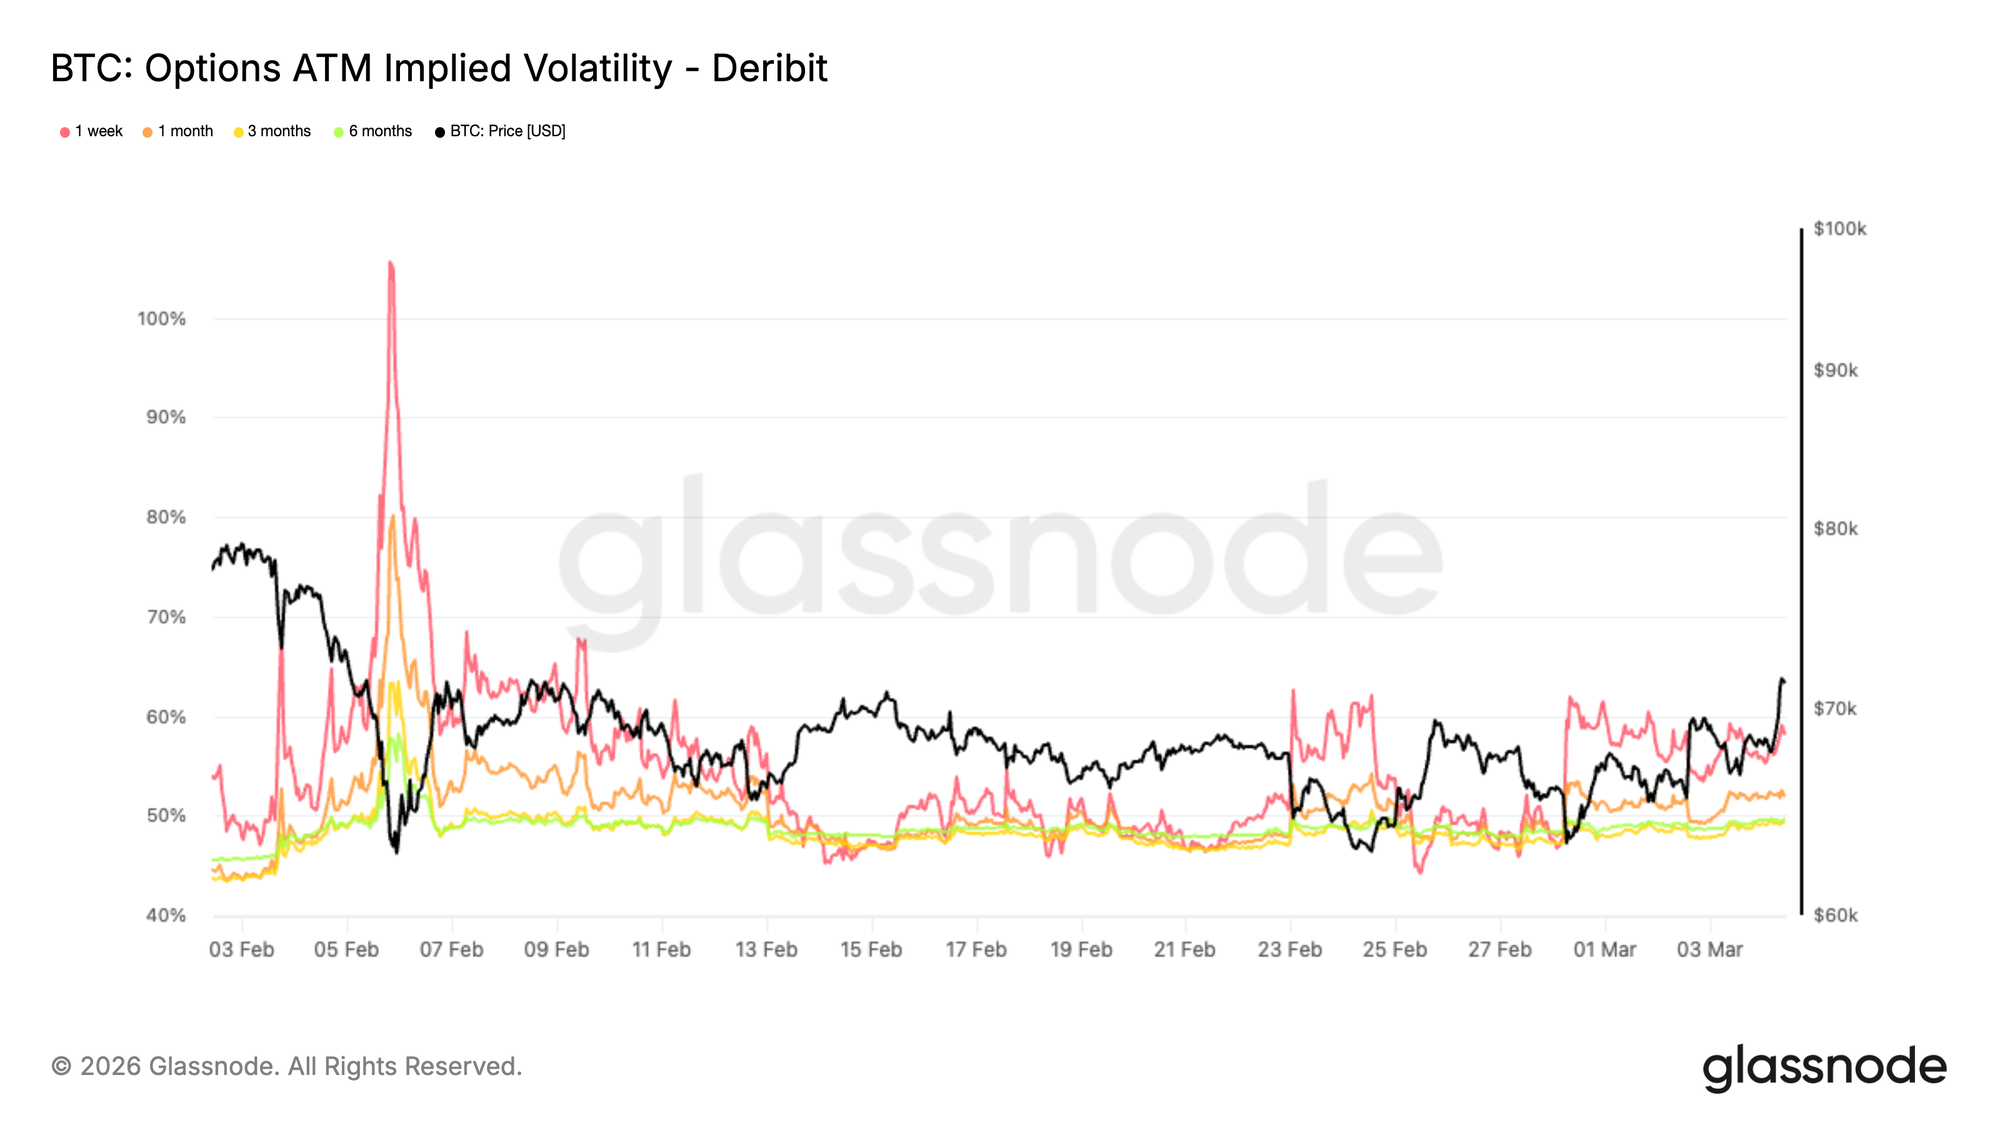
Volatility Compression Signals Stabilization

Implied volatility has continued to compress following the spike observed in early February. Across the main tenors, ATM IV has moved materially lower, indicating that traders are no longer aggressively pricing tail risk.

This shift reflects a stabilization in sentiment after a period of forced deleveraging and liquidation-driven volatility. As panic pricing fades, options markets begin transitioning from stress conditions toward a more neutral volatility regime.

Lower implied volatility also changes positioning dynamics. When volatility declines while price stabilizes, long option holders face increasing theta decay, making directional conviction more important.

For now, volatility compression suggests the market is moving away from crisis pricing and into a consolidation phase where positioning, rather than panic hedging, becomes the dominant driver of price action.

Live Chart

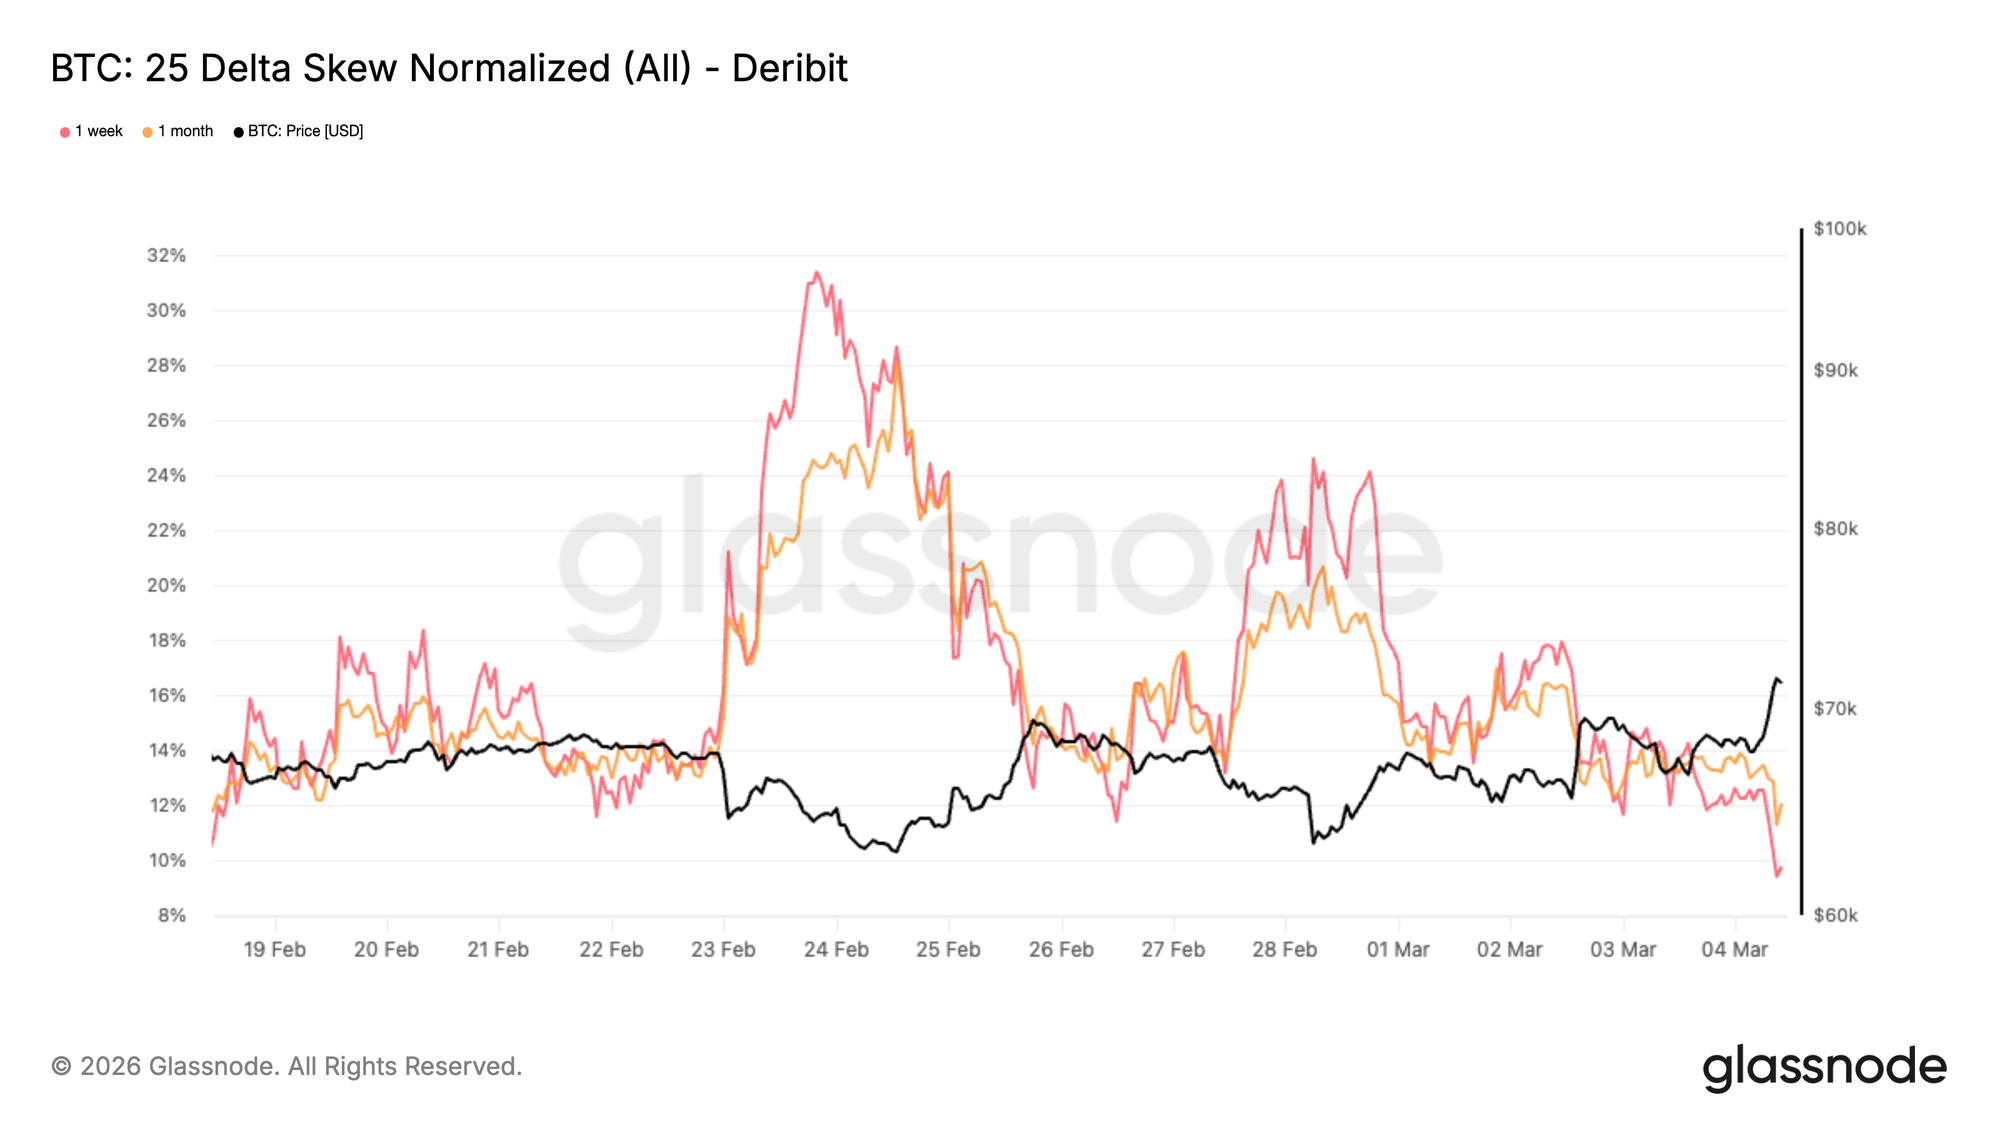
Skew Normalization Reflects Fading Downside Fear

Skew has compressed materially from the extreme levels observed during the February sell-off. Over the past two weeks, as the chart shows, each move lower in BTC price has triggered a progressively milder reaction in the options market. Traders have been far less aggressive in bidding for downside protection, gradually pulling the skew lower. During the peak of the sell-off, put demand surged and pushed skew deep into put territory as traders rushed to hedge against further downside. That urgency has clearly eased.

Rather than a full normalization, what we are seeing is a repricing of risk: skew has moved from the mid-20s to the low-10s, still reflecting demand for protection but at far less stressed levels. This shift suggests that the immediate need for downside hedging is fading. Some protective positioning is being unwound, while interest in upside exposure is slowly reappearing.

Historically, this type of skew compression tends to occur when markets move out of stress phases and begin transitioning into more balanced positioning environments.

Live Chart

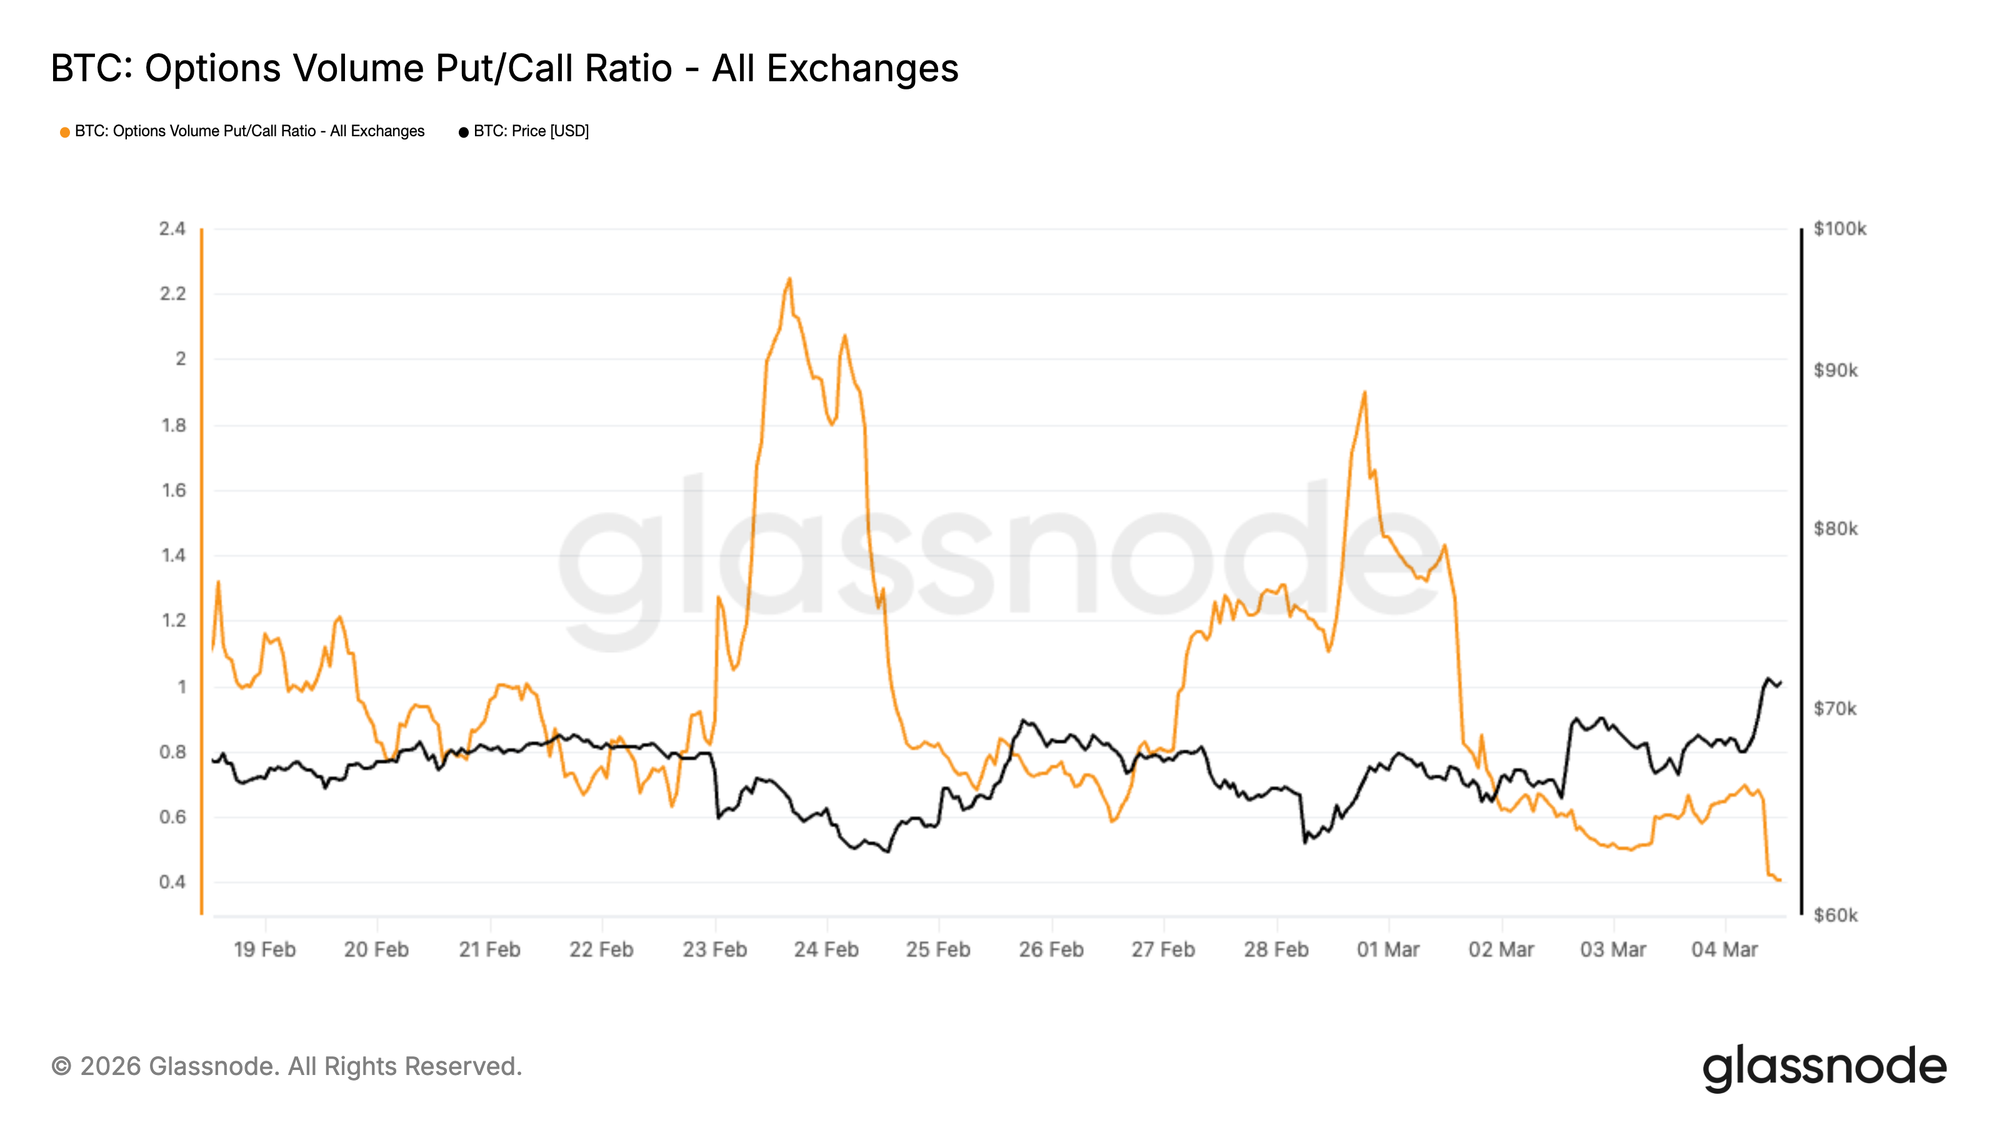
Options Flow Rotates Toward Upside Calls

The Put/Call volume ratio measures the relative trading activity between puts and calls. When the ratio declines, it indicates that call activity is increasing relative to puts.

As implied volatility compresses, put holders face increasing theta decay and mark-to-market pressure. With downside momentum weakening, these positions become more costly to carry, prompting traders to buy back their hedges. This dynamic can create incremental spot demand as protective positions are unwound.

This environment has incentivized traders to position for a tactical upside move, a shift that is visible in the Put/Call volume ratio. Since February 28th, the ratio has moved from 1.89 to 0.4, marking a significant reversal in options flows and highlighting the growing willingness of the market to position for upside.

This shift is also reflected in the increasing interest around the $75,000 strike.

The combination of declining volatility and rising call activity suggests a market gradually transitioning away from defensive hedging toward more opportunistic upside positioning.

Live Chart

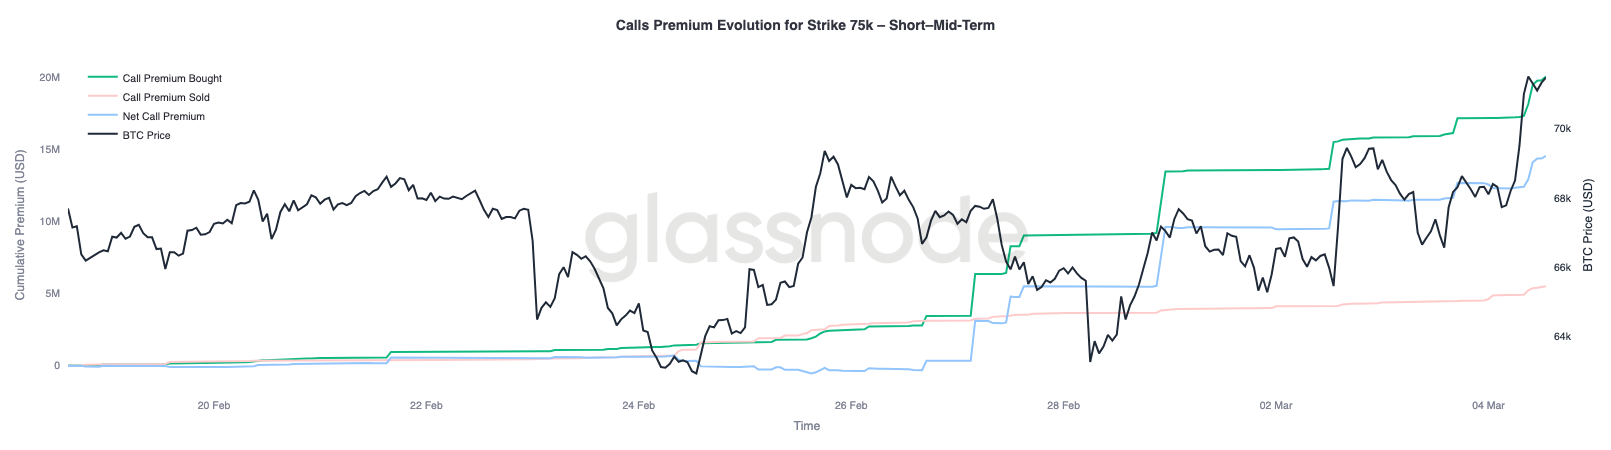
$75K Emerges as the Key Gamma Magnet

The rotation toward call activity is also visible in the growing interest around the $75,000 strike, which has become the most significant negative gamma level for dealers.

The $75,000 strike currently hosts a substantial concentration of negative gamma, estimated at around $2.3 billion across expiries, with approximately $1.8 billion concentrated in the March 27th expiry.

Negative gamma environments can amplify price movements as dealer hedging flows reinforce the prevailing trend. When price approaches these zones, hedging activity can pull the market toward the strike, creating a magnet effect. Over the past week, this magnet has effectively shifted from the $60K to $65K area up toward the $75K strike.

For now, $75K stands out as the key level where positioning and liquidity could converge in the coming sessions.

Looking at the premium dynamics for the $75K calls across the next three monthly expiries, roughly $14.5 million in net call premium has been traded. This represents the difference between premium bought and premium sold.
Notably, nearly two thirds of this net premium has been accumulated over the past week, helping fuel the current rebound.

Live Chart

Conclusion

Bitcoin remains locked in a tenuous consolidation below the $70k threshold, with several indicators suggesting that buy-side momentum has materially weakened. Realized profit has contracted sharply, highlighting reduced willingness among market participants to transact at elevated prices, while the decline in the Percent Supply in Profit places the current regime within a historical context often associated with the early stages of bear market conditions. At the same time, the cost basis of short-term holders near $70k is emerging as a key behavioural ceiling, likely acting as a distribution zone should price attempt a near-term recovery.

Beneath the surface, however, some signs of stabilization are beginning to appear. Spot selling pressure is moderating at the margin, ETF outflows are easing with early inflows returning, and derivatives leverage continues to be flushed from the system. In options markets, volatility and skew are normalizing as panic hedging fades and positioning rotates toward upside exposure. With the $75k strike emerging as a major gamma magnet, the market appears to be transitioning from stress-driven selling toward a more balanced positioning regime. Whether this evolves into a sustainable recovery will ultimately depend on the return of stronger spot demand to absorb overhead supply.


Disclaimer: This report does not provide any investment advice. All data is provided for informational and educational purposes only. No investment decision shall be based on the information provided here, and you are solely responsible for your own investment decisions.

Exchange balances presented are derived from Glassnode’s comprehensive database of address labels, which are amassed through both officially published exchange information and proprietary clustering algorithms. While we strive to ensure the utmost accuracy in representing exchange balances, it is important to note that these figures might not always encapsulate the entirety of an exchange’s reserves, particularly when exchanges refrain from disclosing their official addresses. We urge users to exercise caution and discretion when utilizing these metrics. Glassnode shall not be held responsible for any discrepancies or potential inaccuracies.

Perguntas relacionadas

QWhat key resistance level has Bitcoin repeatedly failed to close above since early February, and what does this indicate about current market momentum?

ABitcoin has repeatedly failed to post a weekly close above $70k since early February, establishing it as a significant near-term resistance level. This, combined with a sharp 63% contraction in the 30-day SMA of Realized Profit, indicates that upside momentum has stalled, leaving the price in a state of directionless consolidation.

QAccording to the 'Percent of Supply in Profit' metric, what does the current reading of approximately 57% historically suggest about the market regime?

AThe 'Percent of Supply in Profit' metric breaking below its -1 standard deviation threshold near 60% and sitting at approximately 57% suggests that the present consolidation may be less a springboard for recovery and more a continuation of the prevailing adverse market regime. Historically, readings at this level have coincided with the early stages of deep bear markets, such as in May 2022 and November 2018.

QWhat is the significance of the Short-Term Holder (1W-1M) Cost Basis being near $70k, and what zone does it create?

AThe cost basis of Short-Term Holders (coins aged between one week and one month) near $70k is significant because it acts as a key behavioral anchor. The ±2% zone surrounding this level (roughly $68.5k to $71.5k) represents a major potential resistance and distribution zone for any near-term price recovery, as these recent buyers are incentivized to exit their positions or lock in thin profits as they approach breakeven.

QWhat recent shifts in ETF flows and options market activity suggest a potential stabilization or change in sentiment?

ARecent shifts include ETF outflows easing with the first signs of renewed inflows appearing, suggesting institutional selling pressure may be moderating. In options markets, the Put/Call volume ratio has dramatically reversed from 1.89 to 0.4, indicating a significant rotation from defensive put buying to opportunistic call buying, and the $75k strike has emerged as a key gamma magnet, reflecting growing upside positioning.

QHow has implied volatility and skew changed, and what does this signal about the current market phase?

AImplied volatility has compressed materially, indicating traders are no longer aggressively pricing tail risk and that the market is moving away from crisis pricing. Skew has normalized from extreme put-heavy levels (mid-20s) to the low-10s, reflecting a fading immediate need for downside hedging. This compression suggests the market is transitioning from a stress phase into a more balanced consolidation phase where positioning, rather than panic, drives price action.

Leituras Relacionadas

How Many Tokens Away Is Yang Zhilin from the 'Moon Chasing the Light'?

The article explores the intense competition between two leading Chinese AI companies, DeepSeek and Kimi (Moon Dark Side), and the mounting pressure on Yang Zhilin, the founder of Kimi. While DeepSeek re-emerged after 15 months of silence with its powerful V4 model—boasting 1.6 trillion parameters and low-cost, long-context capabilities—Kimi has been focusing on long-context processing and multi-agent systems with its K2.6 model. Yang faces a threefold challenge: technological rivalry, commercialization pressure, and investor expectations. Despite Kimi’s high valuation (reaching $18 billion), its revenue heavily relies on a single product with low paid conversion rates, while DeepSeek’s strategic silence and open-source influence have strengthened its market position and valuation prospects, now targeting over $20 billion. Both companies reflect broader trends in China’s AI ecosystem: Kimi aims for global influence through open-source contributions and agent-based advancements, while DeepSeek prioritizes foundational innovation and hardware independence, notably shifting to Huawei’s chips. Their competition is seen as vital for China’s AI progress, with the gap between top Chinese and U.S. models narrowing to just 2.7% on the Elo rating scale. Ultimately, the article argues that this rivalry, though anxiety-inducing for leaders like Zhilin, is essential for driving innovation and solidifying China’s role in the global AI landscape.

marsbitHá 43m

How Many Tokens Away Is Yang Zhilin from the 'Moon Chasing the Light'?

marsbitHá 43m

TechFlow Intelligence Bureau: ChatGPT Helps Amateur Mathematician Crack 60-Year-Old Problem, CFTC Sues New York Regulator Over Coinbase and Gemini

An amateur mathematician, with the assistance of ChatGPT, has solved a combinatorial mathematics puzzle originally proposed by Hungarian mathematician Paul Erdős in the 1960s. This marks another milestone in AI-aided mathematical research, demonstrating the evolving capabilities of large language models in formal reasoning. In other AI developments, OpenAI introduced a new privacy filter tool for enterprise API usage, automatically screening sensitive data. Meanwhile, the Qwen3.6-27B model achieved 100 tokens per second on a single RTX 5090 GPU using quantization, significantly lowering the cost barrier for local AI deployment. In crypto and Web3, the U.S. CFTC sued New York’s financial regulator, challenging its oversight of Coinbase and Gemini—a first-of-its-kind federal-state regulatory clash. Following a vulnerability, KelpDAO and major DeFi protocols established a recovery fund. Tether froze $344 million in assets linked to Iran’s central bank upon U.S. Treasury request, highlighting the centralized control risks in stablecoins. Separately, Litecoin underwent a 3-hour chain reorganization to undo a privacy-layer exploit. In the U.S., former President Trump invoked the Defense Production Act to address power grid bottlenecks affecting AI data centers and dismissed the entire National Science Board, raising concerns over research independence. A retail trader gained 250% on a $600k Intel options bet amid AI-related speculation. Xiaomi announced its first performance electric vehicle, targeting rivals like Tesla. Meanwhile, iPhone users reported devices automatically reinstalling a hidden app daily, suspected to be MDM-related. A Chinese securities report noted that A-share institutional crowding has reached its second-longest streak since 2007, signaling high valuations and potential style rotation. The day’s developments reflect a dual narrative: AI is enabling unprecedented individual breakthroughs, while centralized power structures—whether governmental or corporate—are becoming more assertive, underscoring that decentralization is as much a political-economic challenge as a technical one.

marsbitHá 1h

TechFlow Intelligence Bureau: ChatGPT Helps Amateur Mathematician Crack 60-Year-Old Problem, CFTC Sues New York Regulator Over Coinbase and Gemini

marsbitHá 1h

Trading

Spot
Futuros

Artigos em Destaque

O que é BITCOIN

Compreender o HarryPotterObamaSonic10Inu (ERC-20) e a Sua Posição no Espaço Cripto Nos últimos anos, o mercado de criptomoedas assistiu a um aumento na popularidade das moedas meme, cativando não apenas os traders, mas também aqueles que procuram envolvimento comunitário e valor de entretenimento. Entre estes tokens únicos está o HarryPotterObamaSonic10Inu (ERC-20), um projeto intrigante que mistura referências culturais no tecido das criptomoedas. Este artigo explora os principais aspetos do HarryPotterObamaSonic10Inu, examinando os seus mecanismos, a sua ética orientada pela comunidade e o seu envolvimento com o vasto panorama cripto. O que é o HarryPotterObamaSonic10Inu (ERC-20)? Como o nome sugere, o HarryPotterObamaSonic10Inu é uma moeda meme construída na blockchain Ethereum, classificada sob o padrão ERC-20. Ao contrário das criptomoedas tradicionais, que podem enfatizar a utilidade prática ou o potencial de investimento, este token prospera no valor de entretenimento e na força da sua comunidade. O projeto visa promover um ambiente onde utilizadores envolvidos possam reunir-se, partilhar ideias e participar em atividades inspiradas por diversos fenómenos culturais. Uma característica notável do HarryPotterObamaSonic10Inu é a zero taxa sobre transações. Este elemento atraente visa encorajar a negociação e o envolvimento da comunidade, isento de encargos adicionais que podem desencorajar os traders de pequena escala. A oferta total da moeda está fixada em mil milhões de tokens, uma cifra que marca a sua intenção de manter uma circulação substancial dentro da comunidade. Criador do HarryPotterObamaSonic10Inu (ERC-20) As origens do HarryPotterObamaSonic10Inu estão um pouco envoltas em mistério; os detalhes sobre o criador permanecem desconhecidos. O desenvolvimento deste token carece de uma equipa identificável ou de um plano explícito, o que não é raro no setor das moedas meme. Em vez disso, o projeto surgiu de forma orgânica, com o seu progresso a depender fortemente do entusiasmo e da participação da sua comunidade. Investidores do HarryPotterObamaSonic10Inu (ERC-20) No que diz respeito a investimentos externos e apoios, o HarryPotterObamaSonic10Inu também permanece ambíguo. O token não lista quaisquer fundações de investimento conhecidas ou apoio organizacional significativo. Em vez disso, o “sangue vital” do projeto é a sua comunidade de base, que informa o seu crescimento e sustentabilidade através da ação coletiva e do envolvimento no espaço cripto. Como Funciona o HarryPotterObamaSonic10Inu (ERC-20)? Como uma moeda meme, o HarryPotterObamaSonic10Inu opera principalmente fora dos quadros tradicionais que muitas vezes governam o valor dos ativos. Existem vários aspetos distintivos que definem como o projeto funciona: Transações Sem Taxas: Sem taxas sobre transações, os utilizadores podem comprar e vender o token livremente, sem a preocupação de custos ocultos. Envolvimento da Comunidade: O projeto prospera na interação da comunidade, aproveitando plataformas de redes sociais para criar entusiasmo e facilitar a participação. Discussões, partilha de conteúdo e envolvimento são elementos cruciais que ajudam a expandir o seu alcance e a fomentar a lealdade entre os apoiantes. Sem Utilidade Prática: Deve ser notado que o HarryPotterObamaSonic10Inu não oferece utilidade concreta dentro do ecossistema financeiro. Em vez disso, é classificado como um token principalmente para entretenimento e atividades comunitárias. Referência Cultural: O token incorpora de forma inteligente elementos da cultura popular para atrair interesse, conectando-se tanto com entusiastas de memes como com seguidores de criptomoedas. HarryPotterObamaSonic10Inu exemplifica como as moedas meme operam de forma diferente de projetos de criptomoedas mais tradicionais, entrando no mercado como construções sociais inovadoras em vez de ativos utilitários. Linha do Tempo do HarryPotterObamaSonic10Inu (ERC-20) A história do HarryPotterObamaSonic10Inu é marcada por vários marcos notáveis: Criação: O token surgiu de um meme viral, capturando a imaginação de muitos entusiastas de criptomoedas. Datas específicas de criação não estão disponíveis, sublinhando a sua ascensão orgânica. Listagem em Exchanges: O HarryPotterObamaSonic10Inu conseguiu entrar em várias exchanges, permitindo um acesso e negociação mais fáceis pela comunidade. Iniciativas de Envolvimento da Comunidade: Atividades contínuas direcionadas a melhorar a interação comunitária, incluindo concursos, campanhas em redes sociais e geração de conteúdo por fãs e defensores. Planos de Expansão Futura: O roteiro do projeto inclui o lançamento de uma coleção de NFTs, mercadorias e um site de eCommerce relacionado aos seus temas culturais, envolvendo ainda mais a comunidade e tentando adicionar mais dimensões ao seu ecossistema. Pontos-Chave sobre o HarryPotterObamaSonic10Inu (ERC-20) Natureza Orientada pela Comunidade: O projeto prioriza a contribuição coletiva e a criatividade, assegurando que o envolvimento dos utilizadores está na vanguarda do seu desenvolvimento. Classificação como Moeda Meme: Representa o epítome da criptomoeda baseada em entretenimento, destacando-se dos veículos de investimento tradicionais. Sem Afiliação Direta com o Bitcoin: Apesar da semelhança no nome do ticker, o HarryPotterObamaSonic10Inu é distinto e não tem qualquer relação com o Bitcoin ou outras criptomoedas estabelecidas. Foco na Colaboração: O HarryPotterObamaSonic10Inu é projetado para criar um espaço de colaboração e partilha de histórias entre os seus detentores, proporcionando uma via para a criatividade e o fortalecimento da comunidade. Perspectivas Futuras: A ambição de expandir além da sua premissa inicial para NFTs e mercadorias delineia um caminho para o projeto potencialmente entrar em avenidas mais mainstream dentro da cultura digital. À medida que as moedas meme continuam a capturar a imaginação da comunidade cripto, HarryPotterObamaSonic10Inu (ERC-20) destaca-se devido aos seus laços culturais e abordagem centrada na comunidade. Embora possa não se encaixar no molde típico de um token orientado para utilidade, a sua essência reside na alegria e camaradagem fomentadas entre os seus apoiantes, destacando a natureza em evolução das criptomoedas em uma era cada vez mais digital. À medida que o projeto continua a desenvolver-se, será importante observar como as dinâmicas comunitárias influenciam a sua trajetória no panorama em constante mudança da tecnologia blockchain.

1.2k Visualizações TotaisPublicado em {updateTime}Atualizado em 2024.12.03

O que é BITCOIN

Como comprar BTC

Bem-vindo à HTX.com!Tornámos a compra de Bitcoin (BTC) simples e conveniente.Segue o nosso guia passo a passo para iniciar a tua jornada no mundo das criptos.Passo 1: cria a tua conta HTXUtiliza o teu e-mail ou número de telefone para te inscreveres numa conta gratuita na HTX.Desfruta de um processo de inscrição sem complicações e desbloqueia todas as funcionalidades.Obter a minha contaPasso 2: vai para Comprar Cripto e escolhe o teu método de pagamentoCartão de crédito/débito: usa o teu visa ou mastercard para comprar Bitcoin (BTC) instantaneamente.Saldo: usa os fundos da tua conta HTX para transacionar sem problemas.Terceiros: adicionamos métodos de pagamento populares, como Google Pay e Apple Pay, para aumentar a conveniência.P2P: transaciona diretamente com outros utilizadores na HTX.Mercado de balcão (OTC): oferecemos serviços personalizados e taxas de câmbio competitivas para os traders.Passo 3: armazena teu Bitcoin (BTC)Depois de comprar o teu Bitcoin (BTC), armazena-o na tua conta HTX.Alternativamente, podes enviá-lo para outro lugar através de transferência blockchain ou usá-lo para transacionar outras criptomoedas.Passo 4: transaciona Bitcoin (BTC)Transaciona facilmente Bitcoin (BTC) no mercado à vista da HTX.Acede simplesmente à tua conta, seleciona o teu par de trading, executa as tuas transações e monitoriza em tempo real.Oferecemos uma experiência de fácil utilização tanto para principiantes como para traders experientes.

3.9k Visualizações TotaisPublicado em {updateTime}Atualizado em 2025.03.21

Como comprar BTC

O que é $BITCOIN

OURO DIGITAL ($BITCOIN): Uma Análise Abrangente Introdução ao OURO DIGITAL ($BITCOIN) OURO DIGITAL ($BITCOIN) é um projeto baseado em blockchain que opera na rede Solana, com o objetivo de combinar as características dos metais preciosos tradicionais com a inovação das tecnologias descentralizadas. Embora partilhe um nome com o Bitcoin, frequentemente referido como “ouro digital” devido à sua percepção como uma reserva de valor, o OURO DIGITAL é um token separado projetado para criar um ecossistema único dentro da paisagem Web3. O seu objetivo é posicionar-se como um ativo digital alternativo viável, embora os detalhes sobre as suas aplicações e funcionalidades ainda estejam em desenvolvimento. O que é o OURO DIGITAL ($BITCOIN)? OURO DIGITAL ($BITCOIN) é um token de criptomoeda explicitamente projetado para uso na blockchain Solana. Em contraste com o Bitcoin, que fornece um papel amplamente reconhecido como armazenamento de valor, este token parece focar em aplicações e características mais amplas. Aspectos notáveis incluem: Infraestrutura Blockchain: O token é construído na blockchain Solana, conhecida pela sua capacidade de lidar com transações de alta velocidade e baixo custo. Dinâmicas de Oferta: O OURO DIGITAL tem um fornecimento máximo limitado a 100 quatrilhões de tokens (100P $BITCOIN), embora os detalhes sobre o seu fornecimento circulante ainda não tenham sido divulgados. Utilidade: Embora as funcionalidades precisas não estejam explicitamente delineadas, existem indicações de que o token poderia ser utilizado para várias aplicações, potencialmente envolvendo aplicações descentralizadas (dApps) ou estratégias de tokenização de ativos. Quem é o Criador do OURO DIGITAL ($BITCOIN)? Neste momento, a identidade dos criadores e da equipa de desenvolvimento por trás do OURO DIGITAL ($BITCOIN) permanece desconhecida. Esta situação é típica entre muitos projetos inovadores no espaço da blockchain, particularmente aqueles alinhados com finanças descentralizadas e fenómenos de moedas meme. Embora tal anonimato possa fomentar uma cultura orientada pela comunidade, intensifica as preocupações sobre governança e responsabilidade. Quem são os Investidores do OURO DIGITAL ($BITCOIN)? As informações disponíveis indicam que o OURO DIGITAL ($BITCOIN) não tem apoiantes institucionais conhecidos ou investimentos proeminentes de capital de risco. O projeto parece operar num modelo peer-to-peer focado no apoio e adoção da comunidade, em vez de rotas de financiamento tradicionais. A sua atividade e liquidez estão principalmente situadas em exchanges descentralizadas (DEXs), como a PumpSwap, em vez de plataformas de negociação centralizadas estabelecidas, destacando ainda mais a sua abordagem de base. Como Funciona o OURO DIGITAL ($BITCOIN) A mecânica operacional do OURO DIGITAL ($BITCOIN) pode ser elaborada com base no seu design de blockchain e nas características da rede: Mecanismo de Consenso: Ao aproveitar o exclusivo proof-of-history (PoH) da Solana combinado com um modelo de proof-of-stake (PoS), o projeto assegura uma validação eficiente das transações, contribuindo para o alto desempenho da rede. Tokenomics: Embora mecanismos deflacionários específicos não tenham sido extensivamente detalhados, o vasto fornecimento máximo de tokens implica que pode atender a microtransações ou casos de uso de nicho que ainda estão por definir. Interoperabilidade: Existe o potencial para integração com o ecossistema mais amplo da Solana, incluindo várias plataformas de finanças descentralizadas (DeFi). No entanto, os detalhes sobre integrações específicas permanecem não especificados. Cronologia de Eventos Chave Aqui está uma cronologia que destaca marcos significativos relacionados ao OURO DIGITAL ($BITCOIN): 2023: O lançamento inicial do token ocorre na blockchain Solana, marcado pelo seu endereço de contrato. 2024: O OURO DIGITAL ganha visibilidade ao tornar-se disponível para negociação em exchanges descentralizadas como a PumpSwap, permitindo que os utilizadores o negociem contra SOL. 2025: O projeto testemunha atividade de negociação esporádica e potencial interesse em envolvimentos liderados pela comunidade, embora não tenham sido documentadas parcerias ou avanços técnicos notáveis até ao momento. Análise Crítica Forças Escalabilidade: A infraestrutura subjacente da Solana suporta altos volumes de transações, o que pode aumentar a utilidade do $BITCOIN em vários cenários de transação. Acessibilidade: O potencial preço de negociação baixo por token pode atrair investidores de retalho, facilitando uma participação mais ampla devido a oportunidades de propriedade fracionada. Riscos Falta de Transparência: A ausência de apoiantes, desenvolvedores ou um processo de auditoria publicamente conhecidos pode gerar ceticismo em relação à sustentabilidade e confiabilidade do projeto. Volatilidade do Mercado: A atividade de negociação depende fortemente do comportamento especulativo, o que pode resultar em volatilidade significativa dos preços e incerteza para os investidores. Conclusão O OURO DIGITAL ($BITCOIN) surge como um projeto intrigante, mas ambíguo, dentro do ecossistema em rápida evolução da Solana. Embora tente aproveitar a narrativa do “ouro digital”, a sua divergência do papel estabelecido do Bitcoin como reserva de valor sublinha a necessidade de uma diferenciação mais clara da sua utilidade pretendida e estrutura de governança. A aceitação e adoção futuras dependerão provavelmente da abordagem da atual opacidade e da definição mais explícita das suas estratégias operacionais e económicas. Nota: Este relatório abrange informações sintetizadas disponíveis até outubro de 2023, e desenvolvimentos podem ter ocorrido além do período de pesquisa.

92 Visualizações TotaisPublicado em {updateTime}Atualizado em 2025.05.13

O que é $BITCOIN

Discussões

Bem-vindo à Comunidade HTX. Aqui, pode manter-se informado sobre os mais recentes desenvolvimentos da plataforma e obter acesso a análises profissionais de mercado. As opiniões dos utilizadores sobre o preço de BTC (BTC) são apresentadas abaixo.

活动图片