Undercurrents of Capital in the Midst of Middle East Turmoil: Option Data Reveals BTC's Safe-Haven Logic

比推Publicado em 2026-03-02Última atualização em 2026-03-02

Resumo

Amidst the unprecedented geopolitical shock triggered by the U.S.-Israel military strike on Iran on March 1, 2026, global markets witnessed a classic flight to safety, with oil and gold surging while risk assets faced initial sell-offs. Bitcoin, positioned between its “digital gold” narrative and high-risk asset attributes, showed resilience by holding the key support level of $67,000. Deribit期权数据揭示BTC期权隐含波动率 surged to 51.3%, reflecting heightened expectations of near-term volatility. The significant divergence between the spot price (~$67,400) and the options max pain point at $76,000 indicates persistent institutional bullish sentiment before the crisis. The put/call open interest ratio of 0.75 shows dominant call holdings, while the 24-hour volume put/call ratio of 1.37 reveals tactical hedging via puts amid the crisis. A break below $65,000 could trigger a sell-off due to market maker hedging, potentially testing $60,000. Conversely, if tensions ease, a gamma squeeze above $70,000 could rapidly push BTC toward the $76,000 max pain level. The event underscores Bitcoin’s growing role as a non-sovereign, uncorrelated asset in institutional portfolios amid escalating geopolitical risks.

On March 1, 2026, the global macro markets encountered an epic "black swan" event: direct military strikes by the United States and Israel against Iran resulted in the death of Iran's Supreme Leader, Ayatollah Khamenei.

This extreme tail-risk event instantly reshaped the risk premium models for global asset classes. The complete ignition of the Middle East powder keg not only caused violent fluctuations in traditional crude oil and safe-haven assets but also pushed the cryptocurrency market, at a critical juncture of博弈, to a crossroads of liquidity and pricing power.

Combining Binance spot market data with Deribit option data, this analysis delves into the immediate impact of this geopolitical crisis on the cryptocurrency market from a quantitative and derivatives博弈 perspective, offering a forward-looking projection of future volatility paths and market trends.

The essence of geopolitical conflict is the reshaping of global supply chains, energy prices, and the ensuing inflation expectations. The financial market transmission of this surprise US-Israel attack on Iran manifested as a textbook risk-aversion pattern: commodities like crude oil and gold became the preferred safe havens, while high-risk assets faced indiscriminate selling in the first instance.
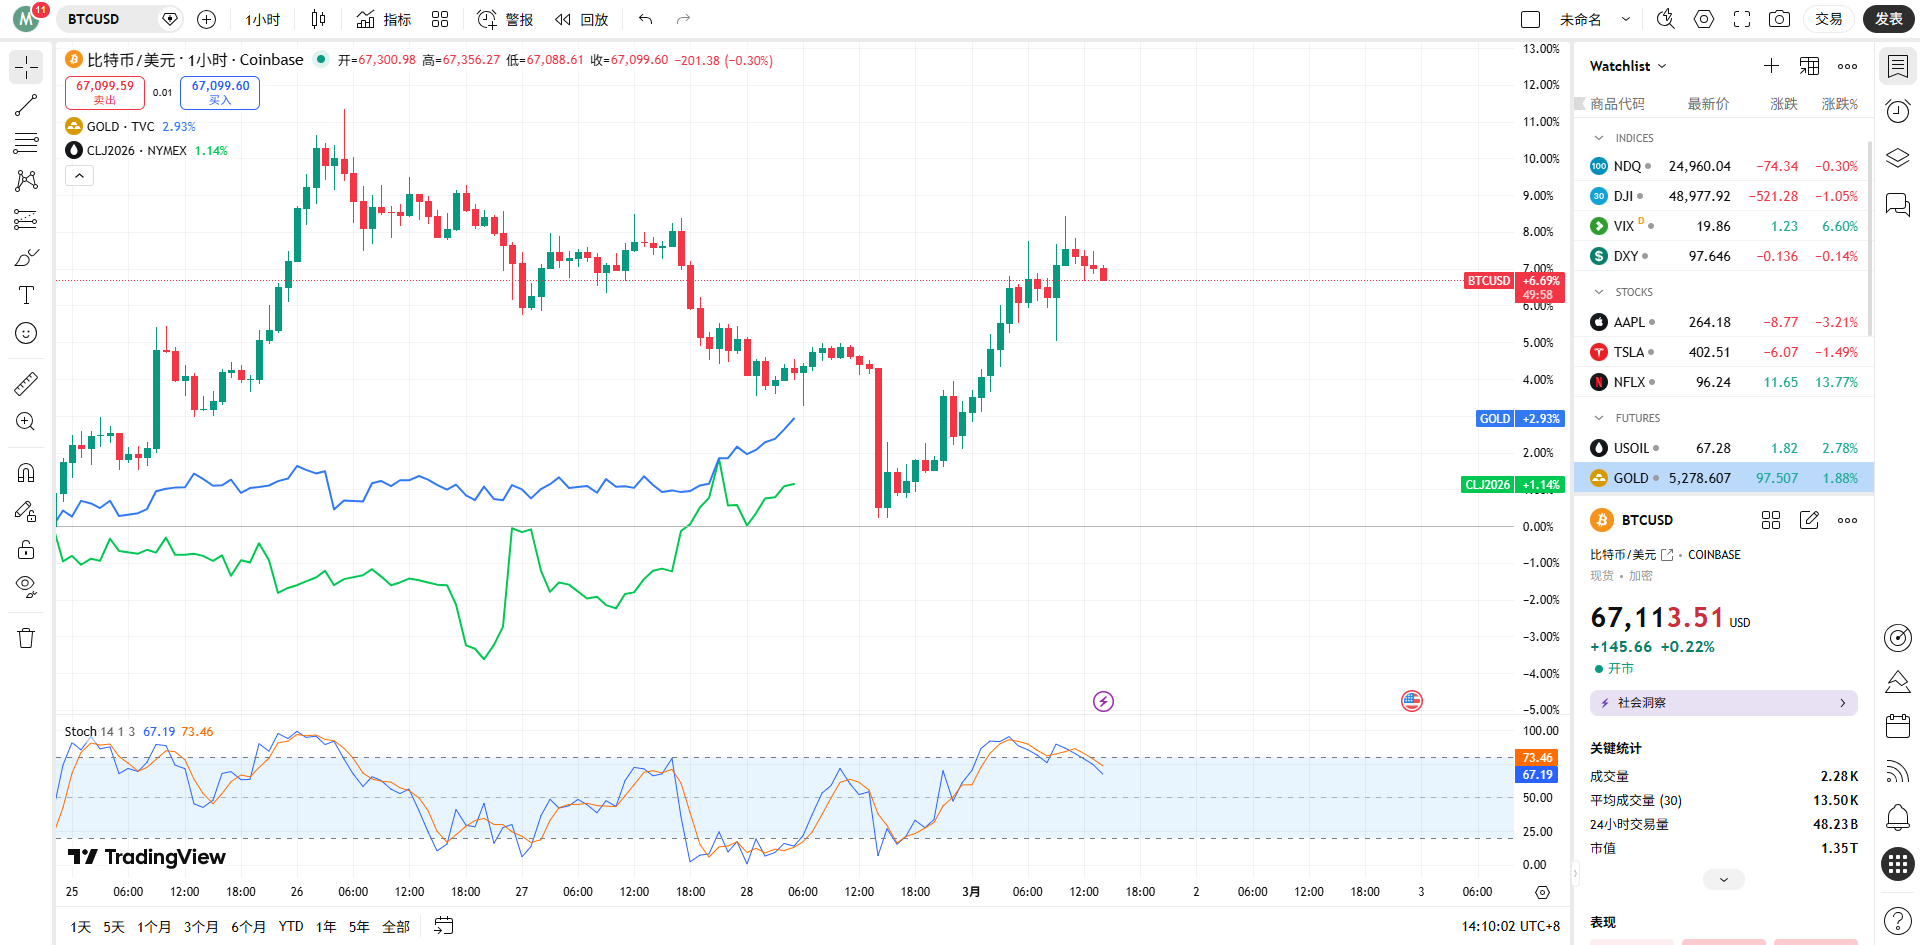
With the outbreak of high-intensity conflict in the Middle East, the primary concerns are the global energy supply chain and the safe-haven sentiment towards the fiat currency credit system. In traditional financial markets, Brent crude oil is highly likely to gap up on open due to panic over potential supply disruptions, and traditional safe-haven assets like gold will also see intensive accumulation by institutional funds. However, in the crypto asset space, BTC's "digital gold" narrative and its "high-beta risk asset"属性 are experiencing intense internal conflict.

From a macro liquidity perspective, panic induced by geopolitics (a soaring VIX index) typically triggers cross-asset indiscriminate selling in the first instance to secure US dollar liquidity. But after a brief liquidity squeeze, Bitcoin, which is不受特定主权国家控制 and possesses抗审查与便携属性, often attracts capital fleeing from high-risk emerging market fiat currencies.

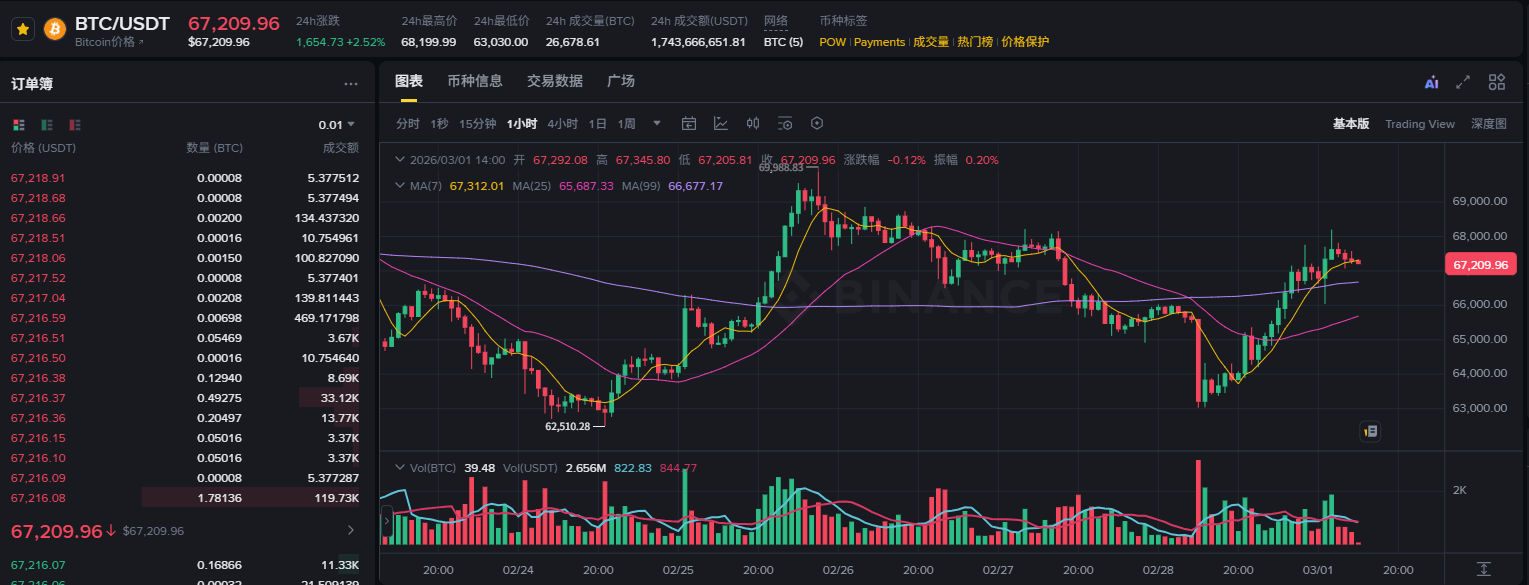
Combining Binance's spot and contract market data (as of 14:00 on March 1, 2026), the BTC/USDT spot price is oscillating around $67,392. In the initial phase of such a major geopolitical crisis, BTC did not experience a crash similar to the "312" event of 2020 but tenaciously held the key support level of $67,000.

The 24-hour trading volume reached a high of $1.74 billion, indicating significant disagreement and turnover between bulls and bears at this level. The moving average system in the price chart shows a pattern of high volatility after a多头排列, suggesting that, under the impact of sudden news, the承接盘力量 in the spot market is exceptionally robust, and the long-term配置底仓 of institutional funds has not fundamentally shifted.
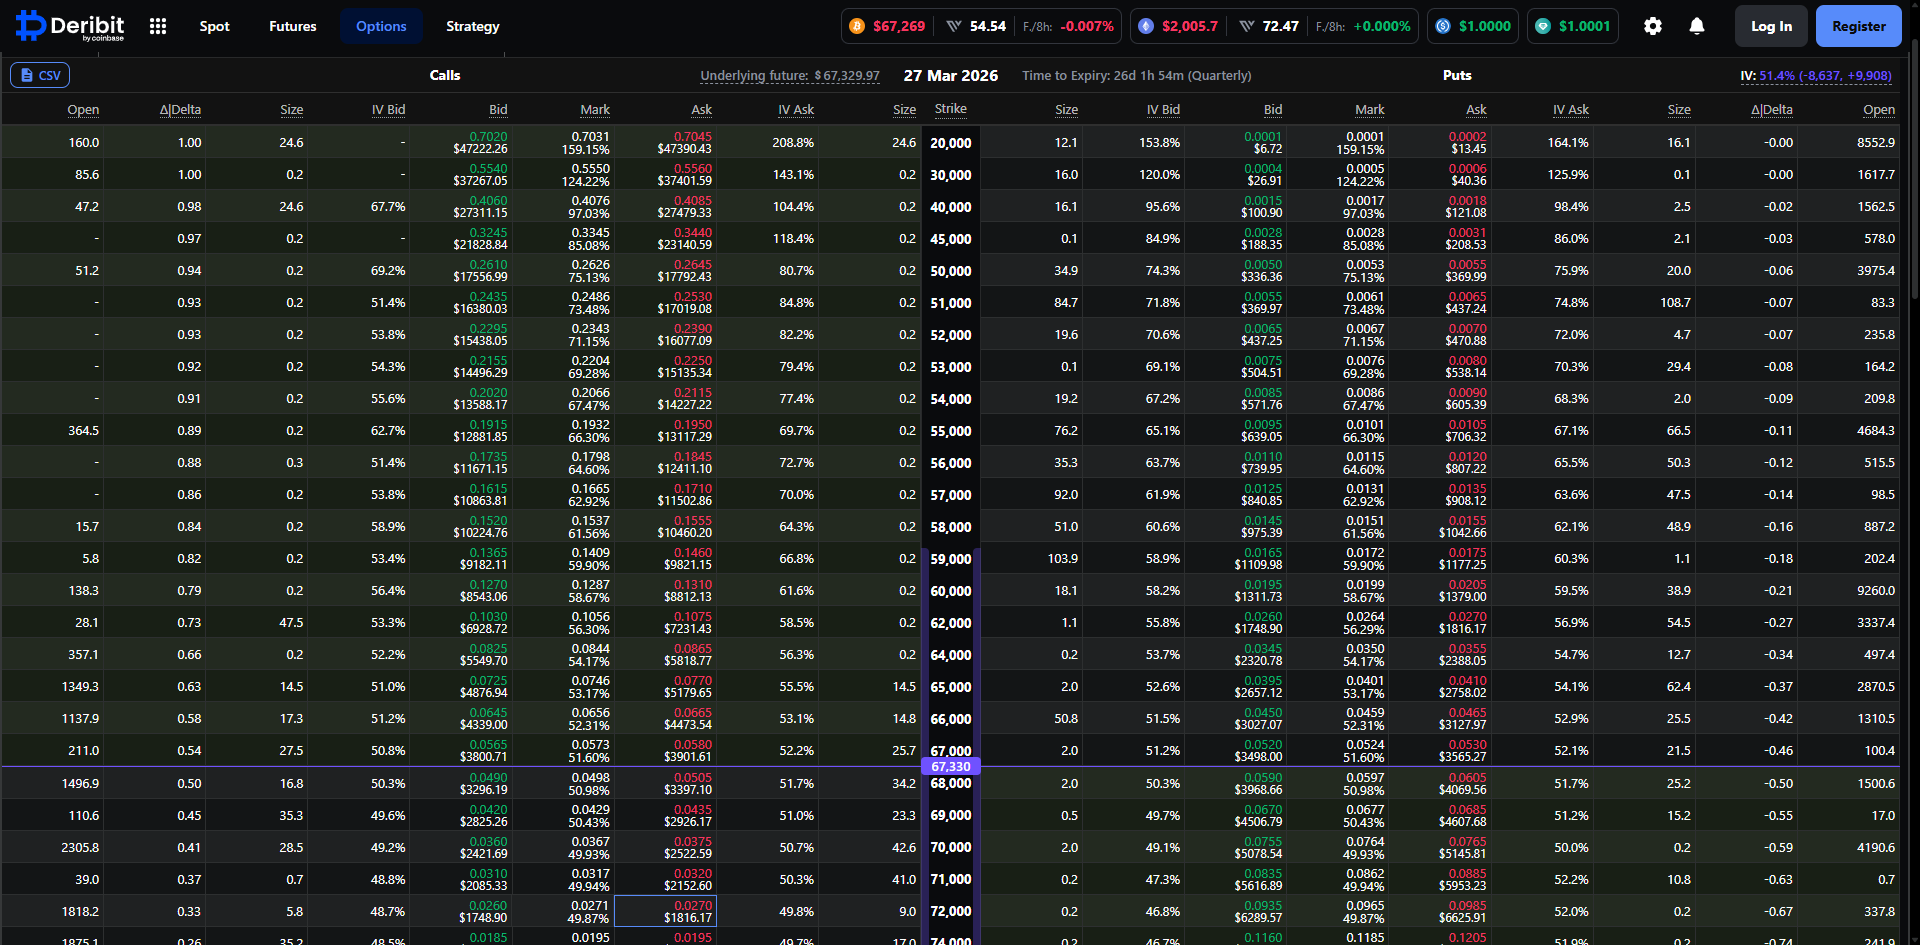
To透视聪明资金的真实意图, the derivatives market, especially option data, provides the most直观的量化截面. By analyzing the current BTC option data expiring on March 27, 2026, on the Deribit platform, we can clearly outline the path projection of major institutions for the next month.

The current implied volatility (IV) for BTC options expiring on March 27 has reached a relatively high level of 51.3%. Against the backdrop of the geopolitical crisis, option sellers quickly raised the volatility surface to hedge against the Gamma exposure risks posed by extreme market movements. An IV above 51% indicates the market is hedging against potential wide fluctuations in the next two to three weeks. For quantitative traders, the risk-reward ratio for selling volatility at this time is extremely poor, and the market is overall in a frenzy of "buying straddles" or constructing tail-risk protection.
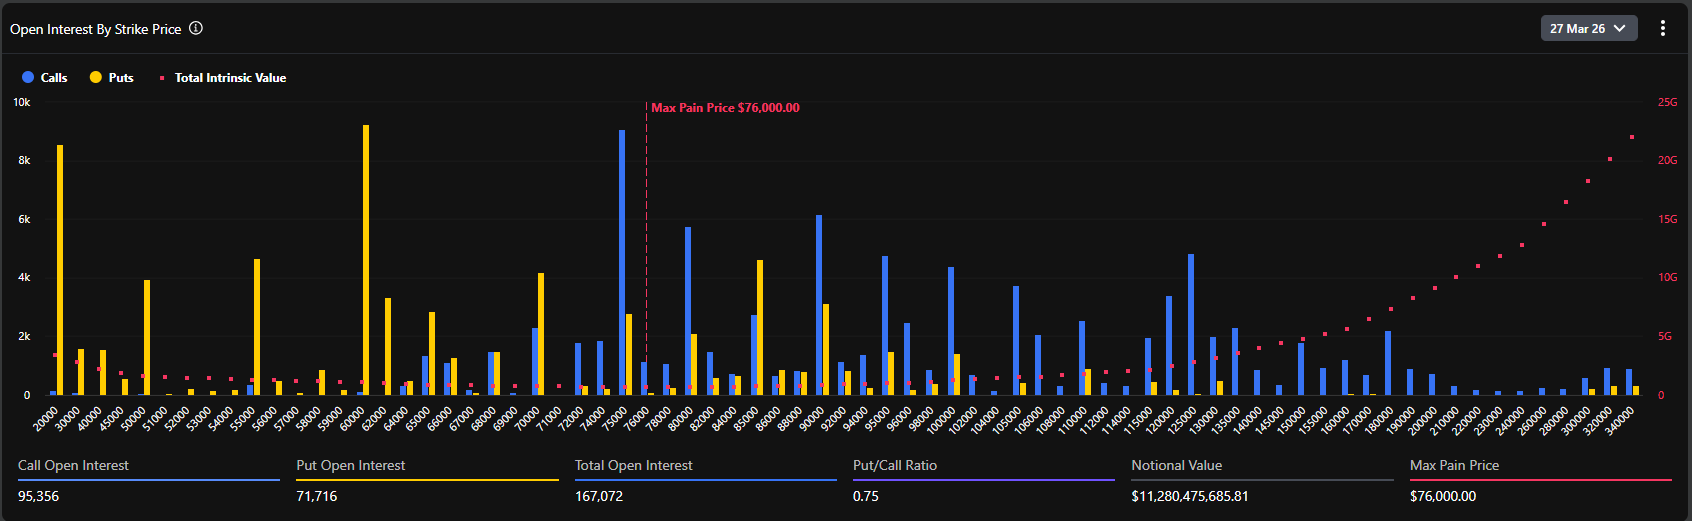
According to the open interest (OI) distribution chart for options, the current global maximum pain point is as high as $76,000. This is a highly forward-looking and controversial data point.

Typically, as expiration approaches, the underlying asset price tends to gravitate towards the maximum pain point to minimize the overall value for option buyers. However, the current spot price (around $67,400) is at a discount of nearly 12% to the maximum pain point ($76,000). This significant deviation reveals two core logics:

First, before the crisis erupted, the market was in an extremely optimistic bullish sentiment, with substantial funds betting on breaking through the all-time high (the $75,000–$80,000 range) by the end of March, which directly pushed the maximum pain point higher.

Second, the outbreak of the geopolitical crisis constituted a strong external shock, suppressing the upward momentum of the spot price. But judging from the total open interest of 167,072 BTC (notional value exceeding $11.2 billion), long positions did not experience large-scale unwinding and stampede due to the war news.

Data shows that the current put/call ratio (based on OI) is 0.75. This value, being below 1, indicates that from a global存量 perspective, call option (Call) open interest still dominates absolutely. Particularly at strike prices of $75,000, $80,000, and even $100,000, there are massive call open interest piles (with single strike open interest reaching nearly 10k BTC).

However, it is worth noting that the 24-hour volume PCR (Put/Call Volume Ratio) reached 1.37. The divergence between存量偏多 (0.75) and增量偏空 (1.37) perfectly captures the current market psychology: long-term institutions maintain their original long exposure (not selling spot, not closing long Calls), but in the short term following the outbreak of the Middle East war, substantial funds rushed in to buy out-of-the-money put options (OTM Puts) for tactical hedging, leading to a surge in short-term Put trading volume.

Combining detailed option data from Deribit, we observe that the distribution of Delta values is extremely dense in the $67,000 to $70,000 range. The current spot price of $67,495 is right in the "meat grinder" zone of the bull-bear struggle.

If the geopolitical situation further deteriorates, causing macro funds to withdraw en masse, and the spot price breaks below $65,000 (a strong support level), market makers, to hedge their short Put exposure, will be forced to sell in the spot or futures market, potentially triggering a wave of localized negative liquidity feedback, testing the psychological关口 of $60,000 downwards.

Conversely, if the Middle East situation enters a stalemate stage mediated by major powers after a brief violent conflict, and once the panic sentiment peaks and recedes, the rebound in the crypto market will be extremely fierce. Due to the massive accumulation of Call options in the $70,000 to $76,000 range above, once the spot price stabilizes and breaks through the $70,000 resistance level, market makers will be forced to buy spot to hedge their negative Gamma exposure. This classic "Gamma Squeeze" effect will propel the BTC price towards the maximum pain point of $76,000 at an unprecedented speed.

The aftershocks of the Middle East geopolitical tremor will continue to ferment. The subsequent actions of the US and Iran will determine the final destination of global safe-haven funds. In the foreseeable short term, BTC spot will experience violent whipsaws within a wide range of $62,000~$70,000. Leverage in the contract market will be反复清洗 during this process. Quantitative strategies should focus on "reducing leverage and capitalizing on volatility," suitable for constructing calendar spreads or grid market making at key support and resistance levels, avoiding unilateral trend exposure.

Judging from the option持仓结构, the massive expiration on March 27 is a gravitational center the market cannot bypass. Unless a global, uncontrollable World War III-level liquidity drought erupts, as panic sentiment marginally decreases, BTC's "safe-haven属性" and "anti-inflation属性" will be repriced. In mid-to-late March, the market is highly likely to initiate a restorative rebound, and the spot price has a strong incentive to move towards the $75,000–$76,000 range (the maximum pain point and dense Call strike zone).
This event marks the entry of geopolitics into a higher-risk phase. Whether it's the rekindling of inflation expectations brought by war (soaring crude oil) or the crisis of confidence in fiat currencies triggered by financial sanctions against specific countries, the strategic value of Bitcoin as a "borderless, non-sovereign hard asset" is being reinforced at the underlying logic level. For large institutions such as family offices and macro hedge funds, the单一的美元债+美股的60/40 portfolio can no longer cope with current tail risks. The allocation proportion of BTC as an "uncorrelated asset" in investment portfolios will undergo a systematic leap following this crisis.

The US and Israeli strike on Iran is the first thunderclap reshaping the global financial landscape in early 2026. Beneath the surface of panic, crypto option data冷静地揭示了机构资金's底牌 of "short-term defensive hedging, long-term依然看涨".

For professional financial practitioners, stripping away emotional noise and closely monitoring the trend of implied volatility changes and the transfer of market makers' Gamma exposure are the core codes to穿透战争迷雾 and grasp the next round of asset pricing power. With the $76,000 option maximum pain point standing like a lighthouse, every deep pullback caused by panic is accumulating potential energy for the future breakthrough.


Twitter:https://twitter.com/BitpushNewsCN

Bitpush TG Discussion Group:https://t.me/BitPushCommunity

Bitpush TG Subscription: https://t.me/bitpush

Original article link:https://www.bitpush.news/articles/7615676

Criptomoedas em alta

Perguntas relacionadas

QWhat was the immediate impact of the US-Israel military strike on Iran on global financial markets, according to the article?

AThe strike triggered a classic risk-aversion pattern: crude oil and gold surged as safe-haven assets, while high-risk assets experienced indiscriminate selling. It also caused a significant repricing of global risk premiums.

QHow did the BTC price react initially to the geopolitical crisis, and what does its resilience at the $67,000 support level indicate?

ABTC did not crash but held firm at the $67,000 key support level with high trading volume ($1.74 billion in 24 hours), indicating strong buying interest and that long-term institutional holdings remained largely unchanged.

QWhat does the high Implied Volatility (IV) of 51.3% for BTC options expiring on March 27, 2026, suggest about market expectations?

AThe elevated IV indicates that the market is pricing in and hedging against the potential for wide price swings (high volatility) over the next few weeks due to the geopolitical crisis, making shorting volatility an unattractive strategy.

QWhat is the significance of the large discrepancy between the current BTC spot price (~$67,400) and the options market 'Max Pain' point at $76,000?

AThe 12%+ gap shows that the market was extremely bullish before the crisis, with heavy call option bets above $75k. The crisis temporarily suppressed the price, but the massive open interest suggests core bullish positions were not liquidated.

QHow does the Put/Call Ratio (PCR) analysis, showing a volume PCR of 1.37 against an open interest PCR of 0.75, reflect trader positioning?

AThis divergence shows that while the overall market structure is still net long (more calls held), there was a tactical, short-term surge in buying put options for downside protection immediately after the news broke, reflecting a 'long-term bullish, short-term cautious' stance.

Leituras Relacionadas

Must-Watch Events Next Week|CLARITY Act Could Face Senate Vote; SpaceX, Circle to Report Earnings (8.3-8.9)

**Summary: Key Events and Developments to Watch (August 3-9)** The upcoming week is marked by significant financial disclosures, key legislative deadlines, and notable product updates. **Major Financial Events:** Several companies are scheduled to release their Q2 2026 earnings. American Bitcoin (ABTC) will report on August 3, followed by SpaceX and Hut 8 Mining Corp. on August 4, and Circle on August 5. Notably, a significant portion of SpaceX shares (up to 12% of total shares) will be unlocked on August 6 following their earnings release. **Key Legislative Deadline:** The U.S. Senate faces an August 7 deadline to secure 60 votes for the CLARITY Act, a bipartisan bill aiming to establish a federal regulatory framework for cryptocurrencies. The Senate may hold a full vote on the bill during the week. **Economic Data:** The U.S. July Non-Farm Payrolls report will be released on August 7, providing crucial labor market data. **Technology & Product Updates:** * **Shutdowns:** DeFi portfolio tracker Zapper and wallet app Ctrl Wallet will cease operations on August 3. * **Upgrades:** LayerZero will deprecate its v1 relayers on August 3. XRP Ledger's new version 3.3.0, featuring five new functions, is expected next week. * **AI:** Elon Musk announced that the advanced Grok 4.6 AI model is set for release around August 7. * **Bitcoin:** The BIP-110 forced signaling for a potential Bitcoin network change is scheduled to begin around August 8. **Other Notable Events:** Chinese robotics firm Unitree Tech has set its preliminary price inquiry for its IPO for August 5. South Korean exchange Upbit will delist AQT and AERGO tokens on August 3.

marsbitHá 56m

Must-Watch Events Next Week|CLARITY Act Could Face Senate Vote; SpaceX, Circle to Report Earnings (8.3-8.9)

marsbitHá 56m

Stocks Are Plummeting More Sharply Than Cryptocurrencies. Where Has the Money Gone?

Stock Markets Plunge Deeper Than Cryptocurrencies: Where Did the Money Go? In late July, Seoul's Kospi index triggered circuit breakers for two consecutive days, plummeting over 40% from its June high. The collapse was led by heavyweight stocks like SK Hynix, whose record profits still disappointed investors, and devastating leveraged ETFs, with one major product losing over 83% of its value. This signaled a global, forced deleveraging targeting the most crowded trades. Interestingly, while stocks exhibited extreme volatility akin to crypto markets, Bitcoin rose nearly 15% in July after a prior steep drop. Analysis shows the money fleeing equities did not flow into Bitcoin. Instead, Bitcoin had already absorbed its sell-off in May-June, when U.S. spot Bitcoin ETFs saw historic outflows. The true safe-haven beneficiary was gold, whose price rose over 20% year-on-year, highlighting a decoupling between Bitcoin and gold as "digital gold." The sell-off was a targeted unwinding of leveraged positions in tech and semiconductors, accelerated by broker-dealer risk management and shifts in the AI narrative, including new competition from Chinese memory chipmakers. The retreat path was clear: from high-valuation tech stocks to cash and U.S. Treasuries, then to gold. For Bitcoin to attract sustained institutional inflows, conditions like eased global liquidity pressure, a "soft-landing" Fed rate cut, and U.S. regulatory clarity via legislation like the stalled CLARITY Act are needed. Currently, Bitcoin is not a safe haven but an already-cleared asset. Its low correlation with tech stocks, however, makes it a potential diversification play for institutional portfolios once the storm passes. The money isn't here yet, but the positioning is underway.

marsbitHá 56m

Stocks Are Plummeting More Sharply Than Cryptocurrencies. Where Has the Money Gone?

marsbitHá 56m

In Conversation with Ray Dalio: We Are Currently in an AI Bubble, with 1% of My Portfolio in Bitcoin

Ray Dalio, founder of Bridgewater Associates, warns in an interview that the current AI boom shows classic bubble characteristics, which could lead to significant economic downturns as seen in past cycles like 1929 or 2000. He explains that speculative enthusiasm, fueled by debt and overvaluation, often precedes a crash when rising rates or taxation force asset sales, causing widespread losses and recession. Dalio also outlines his "Big Cycle" theory, describing an approximate 80-year pattern where widening wealth gaps, massive government deficits, and shifting geopolitical power (like China's rise) create internal conflict and global instability. He emphasizes that we are in a late-cycle, transitional phase where traditional powers like the US and UK face decline. For personal wealth protection, Dalio advises diversification beyond cash into assets like stocks, bonds, real estate, and particularly gold, which he prefers over Bitcoin. While he holds about 1% of his portfolio in Bitcoin as a non-printable hard asset, he views gold as more secure from technological or governmental threats. Regarding AI's impact, Dalio believes it will disproportionately benefit capital owners, worsening inequality by replacing both physical and cognitive labor. He suggests that human intuition and emotional intelligence, combined with AI, will be key for future workers. On taxation, Dalio argues that wealth taxes are impractical and risk triggering asset sell-offs, reducing productive investment. He points to the UK as a cautionary example of debt, low productivity, and political strife. Geopolitically, Dalio foresees a more regionalized world, with the US showing weakness in prolonged conflicts like with Iran, akin to past imperial declines. The ideal outcome, he suggests, is coexisting powerful blocs (e.g., Americas, China-Asia Pacific) without major war.

marsbitHá 4h

In Conversation with Ray Dalio: We Are Currently in an AI Bubble, with 1% of My Portfolio in Bitcoin

marsbitHá 4h

Daily 7.2 Trillion KRW: Foreign Capital's Record Net Buying on Friday! Wall Street Says Headwinds for Korean Stock Fund Flows Have Subsided

South Korean stock market sees a dramatic shift in fund flows. On July 31, foreign investors made a record net purchase of approximately KRW 7.2 trillion in KOSPI stocks, marking a fundamental reversal from the persistent large-scale net outflows seen in previous months. This contributed to a significant narrowing of foreign net selling in July to KRW 9.8 trillion, down sharply from KRW 48.4 trillion in June and KRW 44.5 trillion in May. Simultaneously, domestic institutional pressure eased. South Korean pension funds and asset managers turned to a net buying position in July, purchasing KRW 1.0 trillion worth of KOSPI shares, contrasting with net sales in May and June. Market volatility is expected to be dampened by new financial regulations. Effective July 31, the Financial Services Commission tightened access for retail investors to single-stock leveraged ETFs by raising the minimum cash deposit requirement. Trading volumes for these products subsequently dropped to about 50% of their monthly average. Citigroup Research maintains its year-end KOSPI target of 10,000 points. The firm cites several supportive factors: the substantial easing of headwinds from capital outflows, a robust fundamental outlook for the semiconductor sector, historically low market valuations, strong economic fundamentals, and the potential for policy support from financial authorities if needed.

marsbitHá 4h

Daily 7.2 Trillion KRW: Foreign Capital's Record Net Buying on Friday! Wall Street Says Headwinds for Korean Stock Fund Flows Have Subsided

marsbitHá 4h

Trading

Spot

Artigos em Destaque

Como comprar EPIC

Bem-vindo à HTX.com!Tornámos a compra de Epic Chain (EPIC) simples e conveniente.Segue o nosso guia passo a passo para iniciar a tua jornada no mundo das criptos.Passo 1: cria a tua conta HTXUtiliza o teu e-mail ou número de telefone para te inscreveres numa conta gratuita na HTX.Desfruta de um processo de inscrição sem complicações e desbloqueia todas as funcionalidades.Obter a minha contaPasso 2: vai para Comprar Cripto e escolhe o teu método de pagamentoCartão de crédito/débito: usa o teu visa ou mastercard para comprar Epic Chain (EPIC) instantaneamente.Saldo: usa os fundos da tua conta HTX para transacionar sem problemas.Terceiros: adicionamos métodos de pagamento populares, como Google Pay e Apple Pay, para aumentar a conveniência.P2P: transaciona diretamente com outros utilizadores na HTX.Mercado de balcão (OTC): oferecemos serviços personalizados e taxas de câmbio competitivas para os traders.Passo 3: armazena teu Epic Chain (EPIC)Depois de comprar o teu Epic Chain (EPIC), armazena-o na tua conta HTX.Alternativamente, podes enviá-lo para outro lugar através de transferência blockchain ou usá-lo para transacionar outras criptomoedas.Passo 4: transaciona Epic Chain (EPIC)Transaciona facilmente Epic Chain (EPIC) no mercado à vista da HTX.Acede simplesmente à tua conta, seleciona o teu par de trading, executa as tuas transações e monitoriza em tempo real.Oferecemos uma experiência de fácil utilização tanto para principiantes como para traders experientes.

245 Visualizações TotaisPublicado em {updateTime}Atualizado em 2026.07.21

Como comprar EPIC

Discussões

Bem-vindo à Comunidade HTX. Aqui, pode manter-se informado sobre os mais recentes desenvolvimentos da plataforma e obter acesso a análises profissionais de mercado. As opiniões dos utilizadores sobre o preço de EPIC (EPIC) são apresentadas abaixo.

活动图片













