Last week, we highlighted a structurally fragile market, where rising unrealized losses, elevated loss realization, and persistent profit-taking by long-term holders continued to cap upside progress. While patient buyer demand kept price anchored above the True Market Mean, weak ETF flows, thin spot liquidity, muted futures positioning, and defensive options activity left the market highly sensitive to macro catalysts.
Since then, price was rejected near $92.9k and has drifted lower toward $85.6k, a move consistent with the time-driven sell pressure outlined in our prior report. In this edition, we examine how investor frustration is translating into loss realization, assess spot and futures sentiment, and conclude with our weekly options analysis.
On-Chain Insights
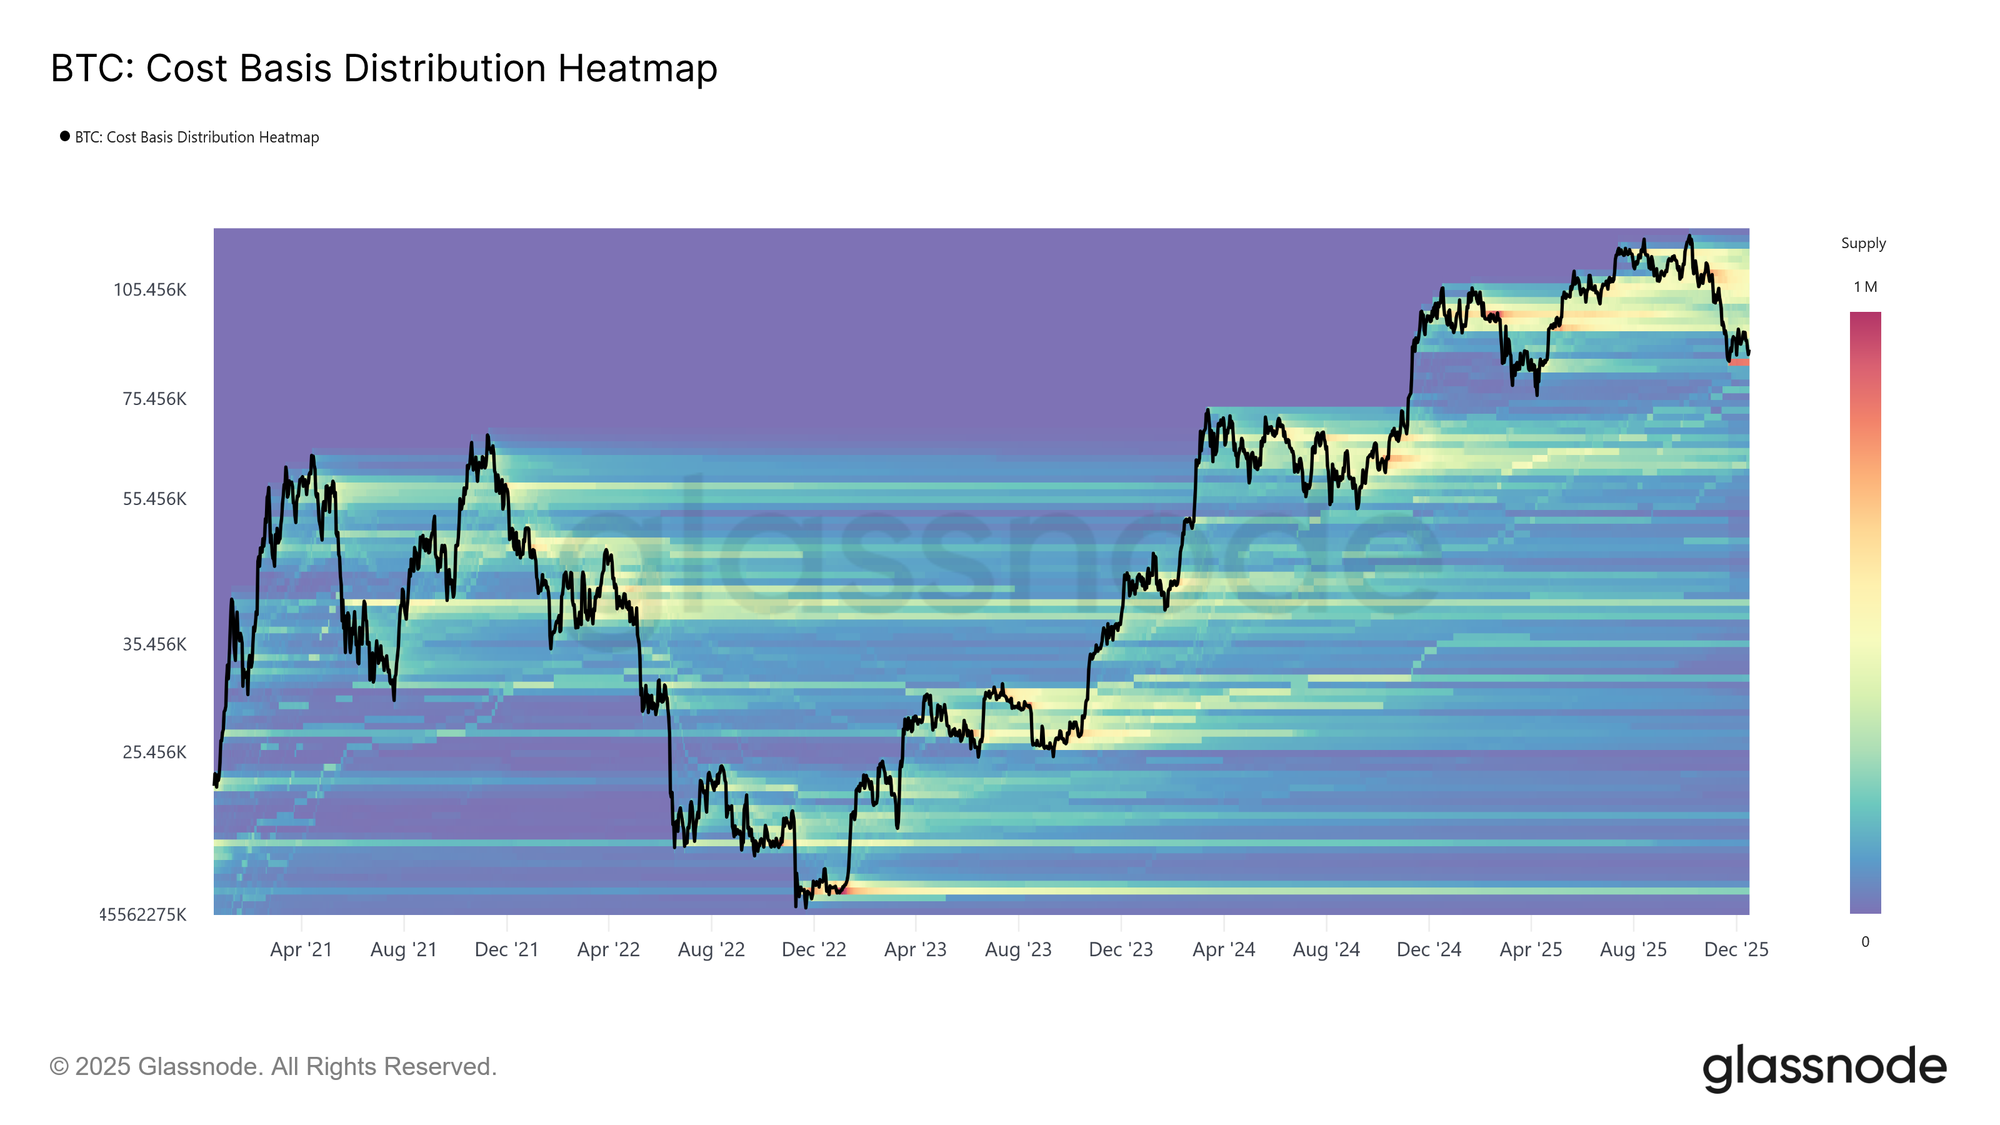
A Top-Heavy Overhang
Price has now returned to levels last seen nearly one year ago, despite experiencing two major rallies during that period. This has left behind a dense supply cluster accumulated by top buyers in the $93k–$120k range. The resulting supply distribution reflects a top-heavy market structure where, similar to early 2022, recovery attempts are increasingly capped by overhead sell pressure, particularly in the early stages of a bearish phase.
As long as price remains below this range and fails to reclaim key thresholds, most notably the Short-Term Holder Cost Basis at $101.5k, the risk of further corrective downside continues to loom over the market.
Weighing the Overhang
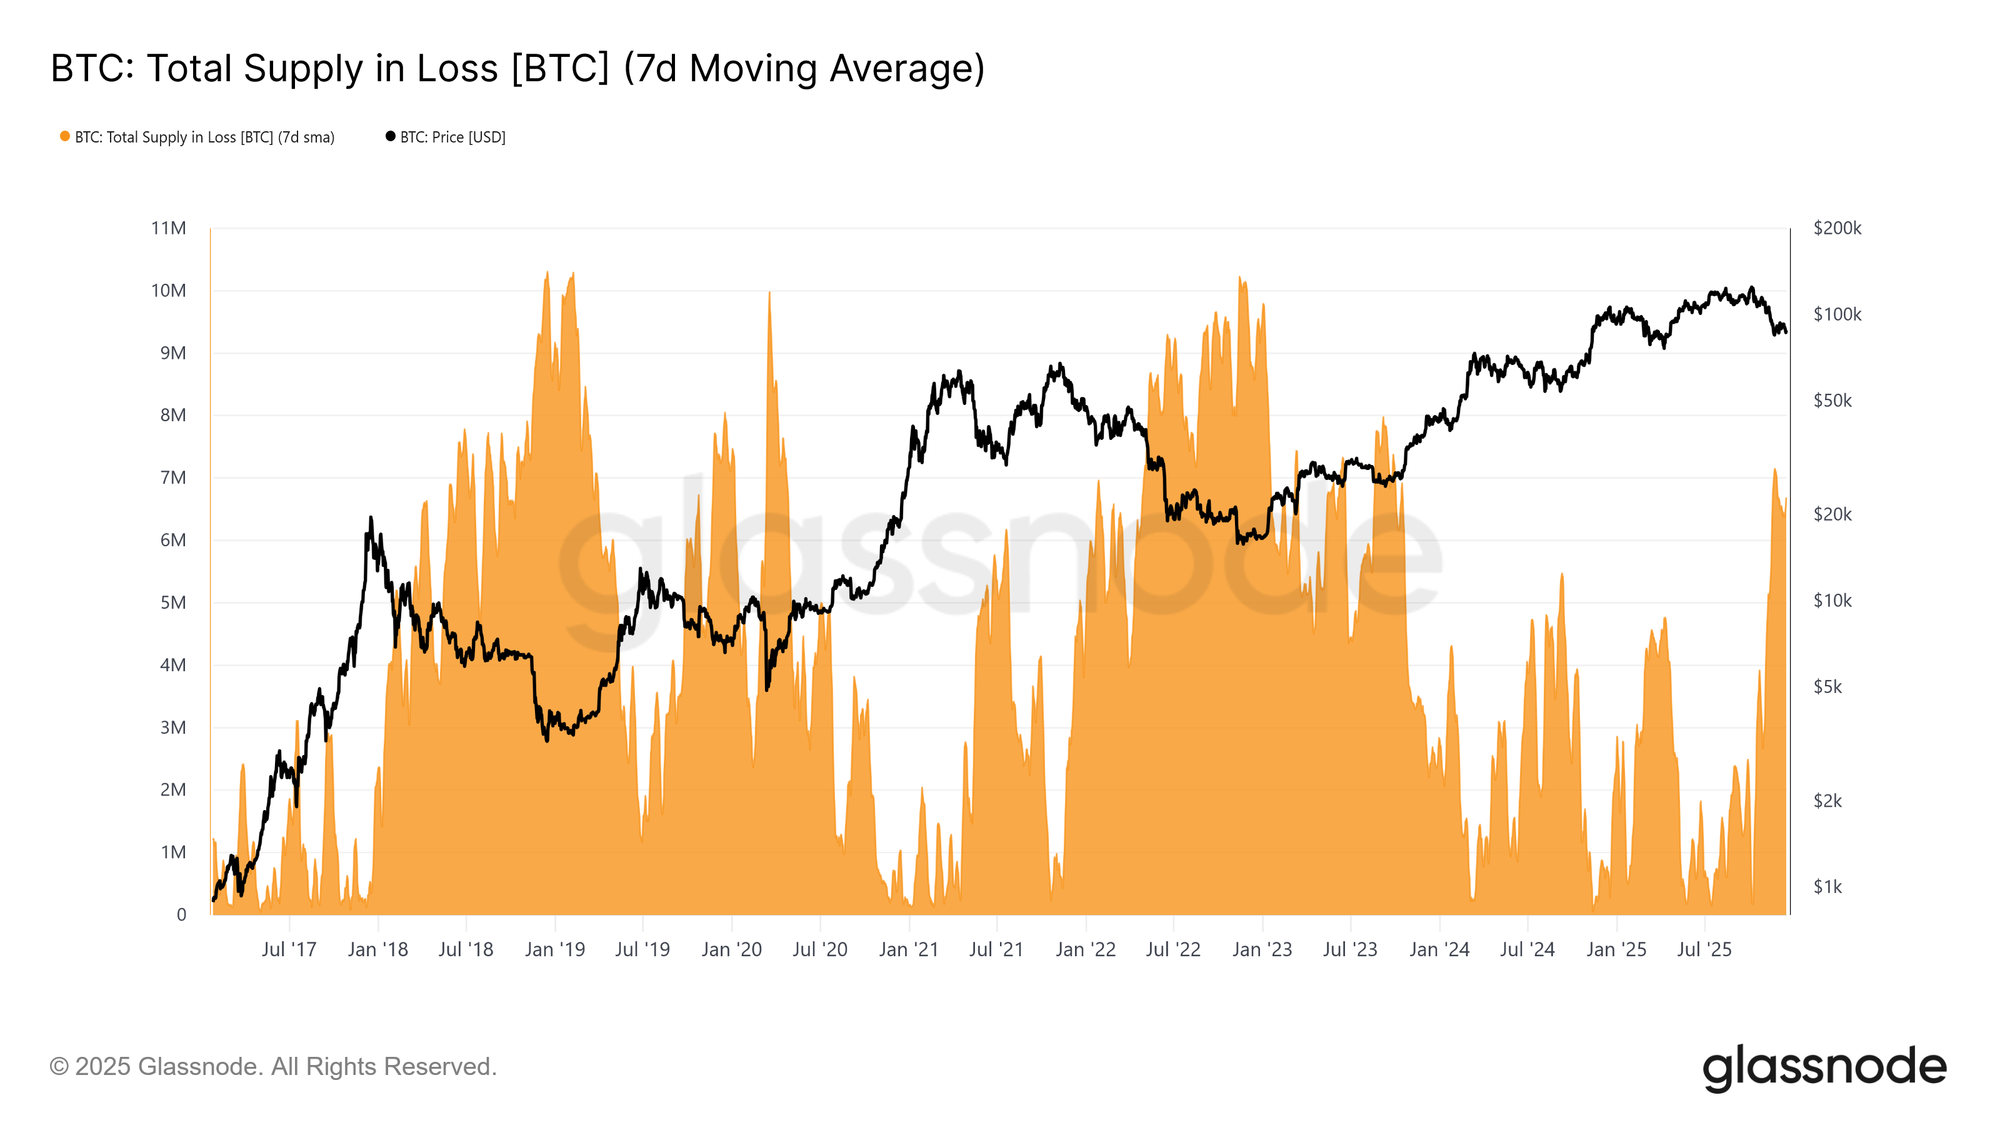
To better contextualize the weight of this overhead supply, we can first assess the volume of coins currently held at a loss. The supply in loss has risen to 6.7 million BTC (7D-SMA), marking the highest level of loss-bearing supply observed in this cycle.
Persisting within the 6–7 million BTC range since mid-November, this pattern closely mirrors early transitional phases of prior cycles, where mounting investor frustration preceded a shift toward more pronounced bearish conditions and intensified capitulation at lower prices.
Maturing Losses
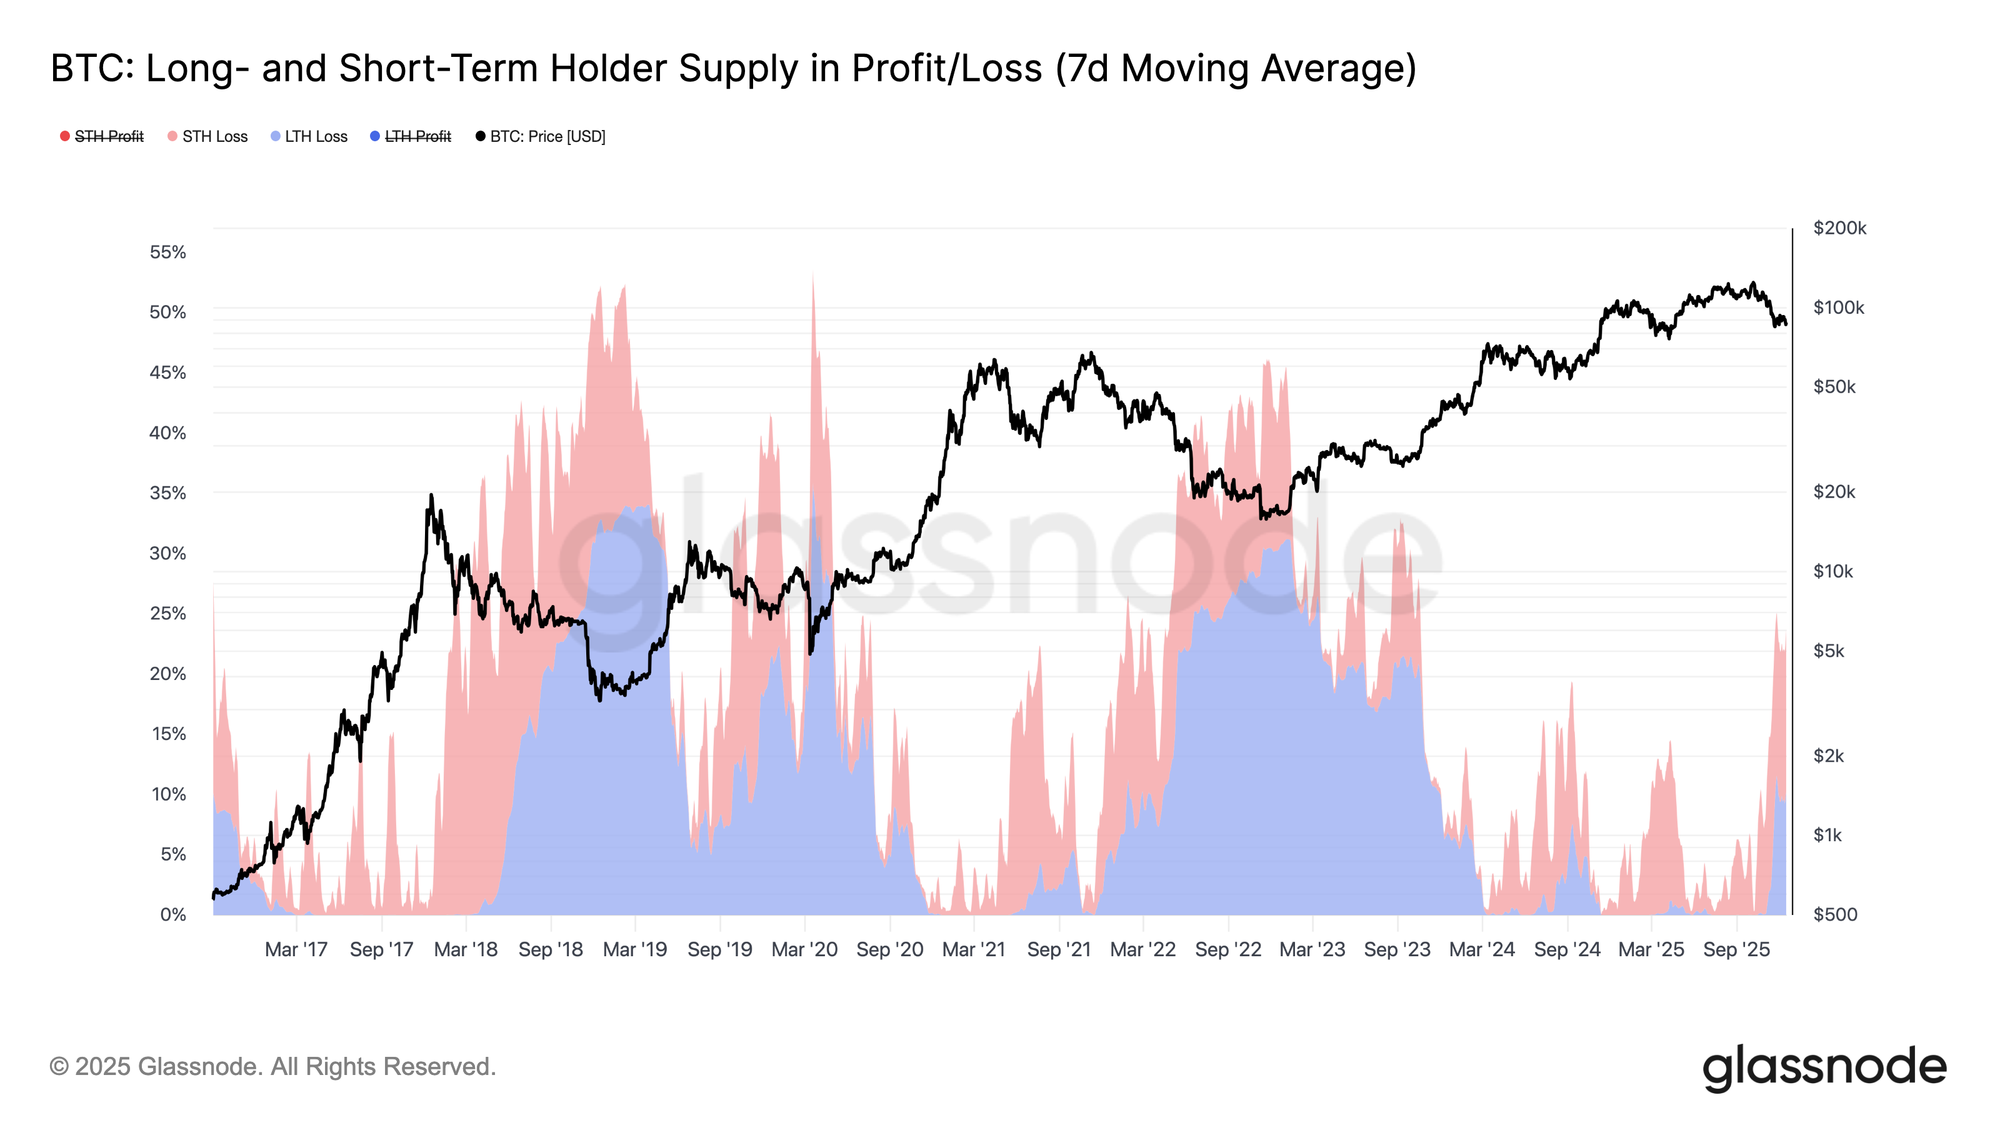
Building on the elevated share of supply held at a loss, time now emerges as the dominant source of market pressure. As shown in the chart below, of the 23.7% of circulating supply currently underwater, 10.2% is held by long-term holders and 13.5% by short-term holders. This distribution suggests that, much like in prior cycle transitions into deeper bearish regimes, loss-bearing supply accumulated by recent buyers is gradually maturing into the long-term holder cohort.
As this underwater supply endures a prolonged time-based stress test, investors with weaker conviction may increasingly capitulate at a loss, adding further sell-side pressure to the market.
Loss Sellers Emerge
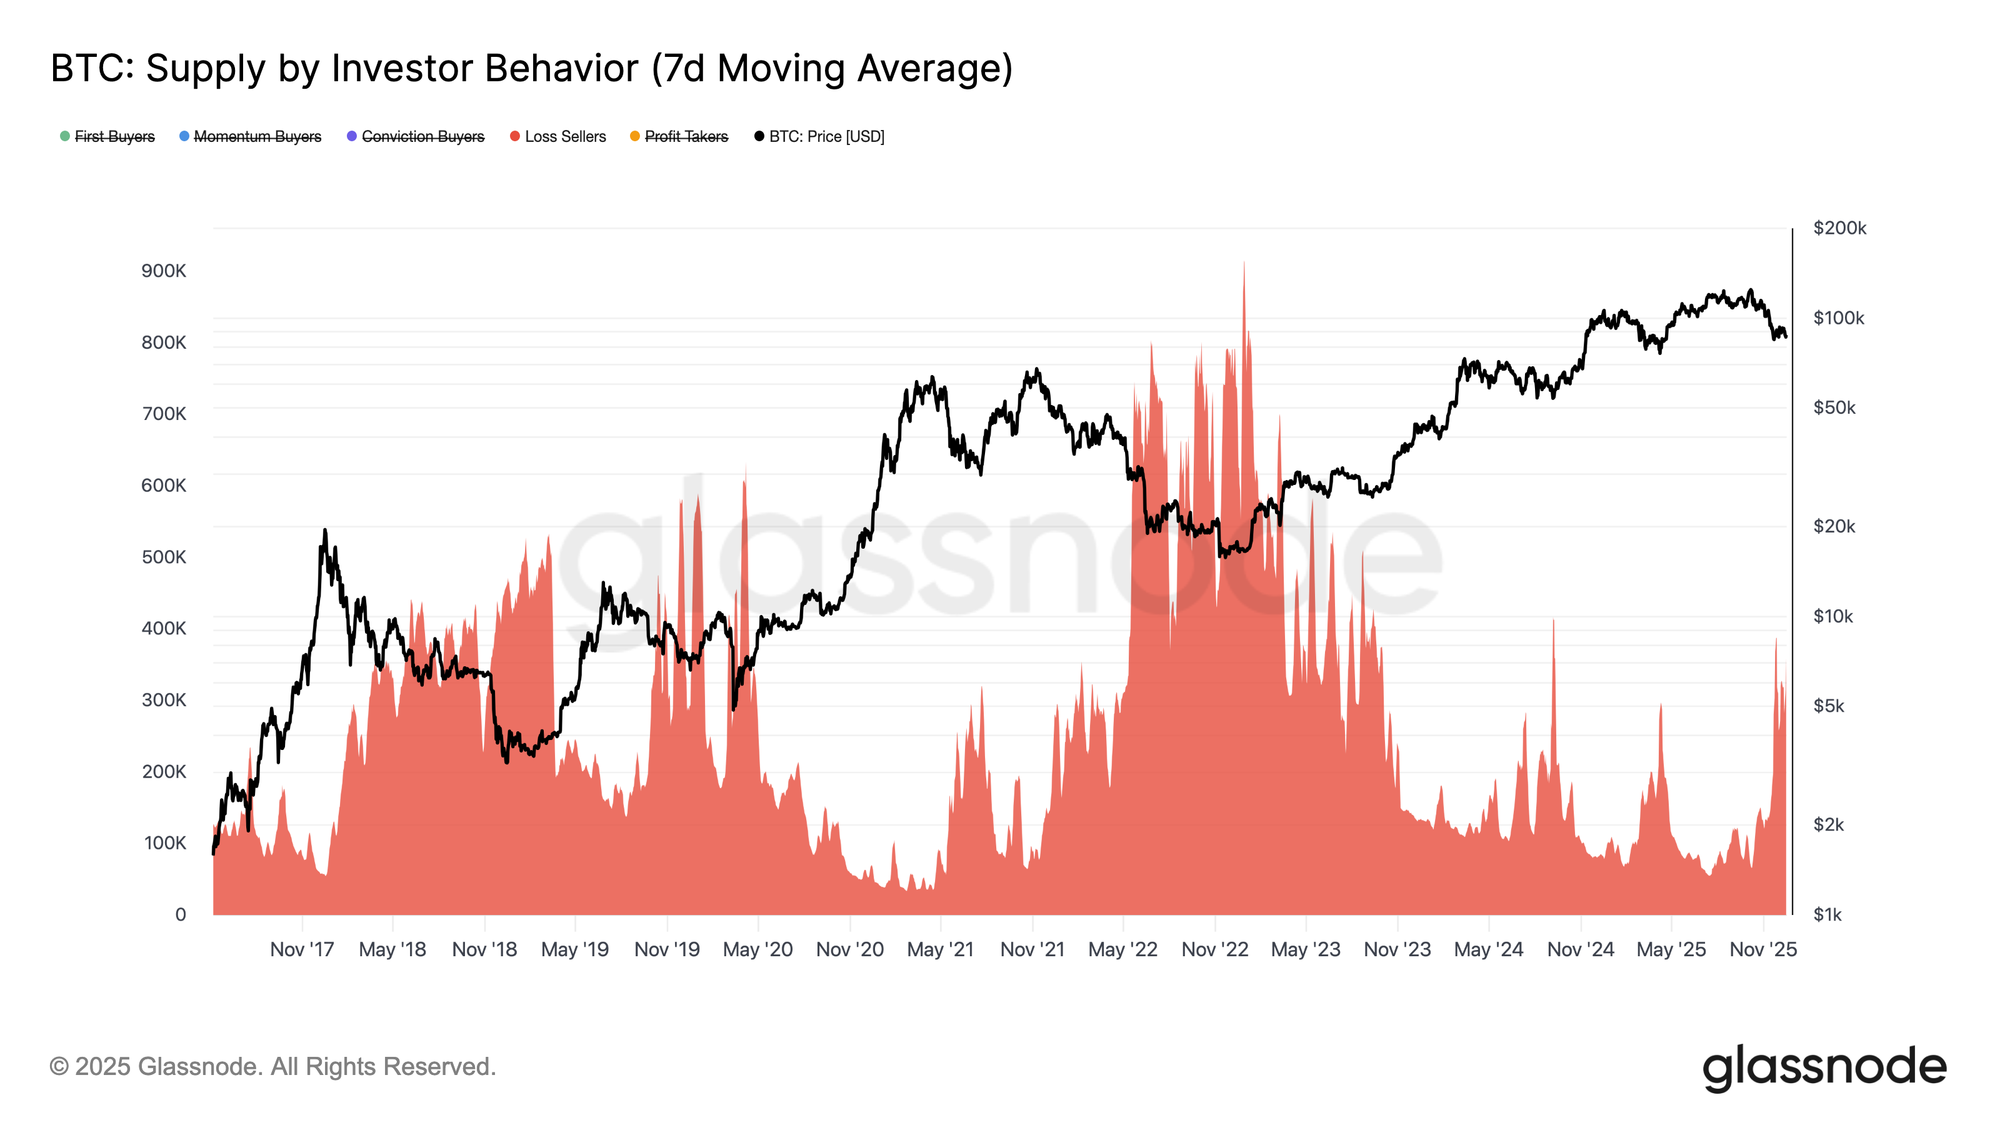
Extending this time-driven pressure, the maturation of loss-bearing supply from short-term holders into longer-term cohorts is now expressing itself through rising loss realization across the market. To better trace how bearish conditions are shaping investor behavior, we turn to the Supply by Investor Behavior indicator. This framework classifies token supply not simply by age, but by how participants interact with price, revealing who is buying, who is selling, and under what conditions.
To achieve this, supply is segmented into behavior-based cohorts: conviction buyers who accumulate into weakness, momentum buyers who enter during uptrends, first-time buyers, profit takers, and loss sellers who exit at a loss. The metric tracks the cumulative supply held by each cohort over time, excluding exchanges and smart contracts to isolate investor behavior.
Currently, supply attributed to Loss Sellers has climbed to roughly 360k BTC. As a result, any further downside, particularly a break below the True Market Mean at $81.3k, risks expanding this cohort further, adding incremental sell-side pressure to an already fragile market structure.
Off-Chain Insights
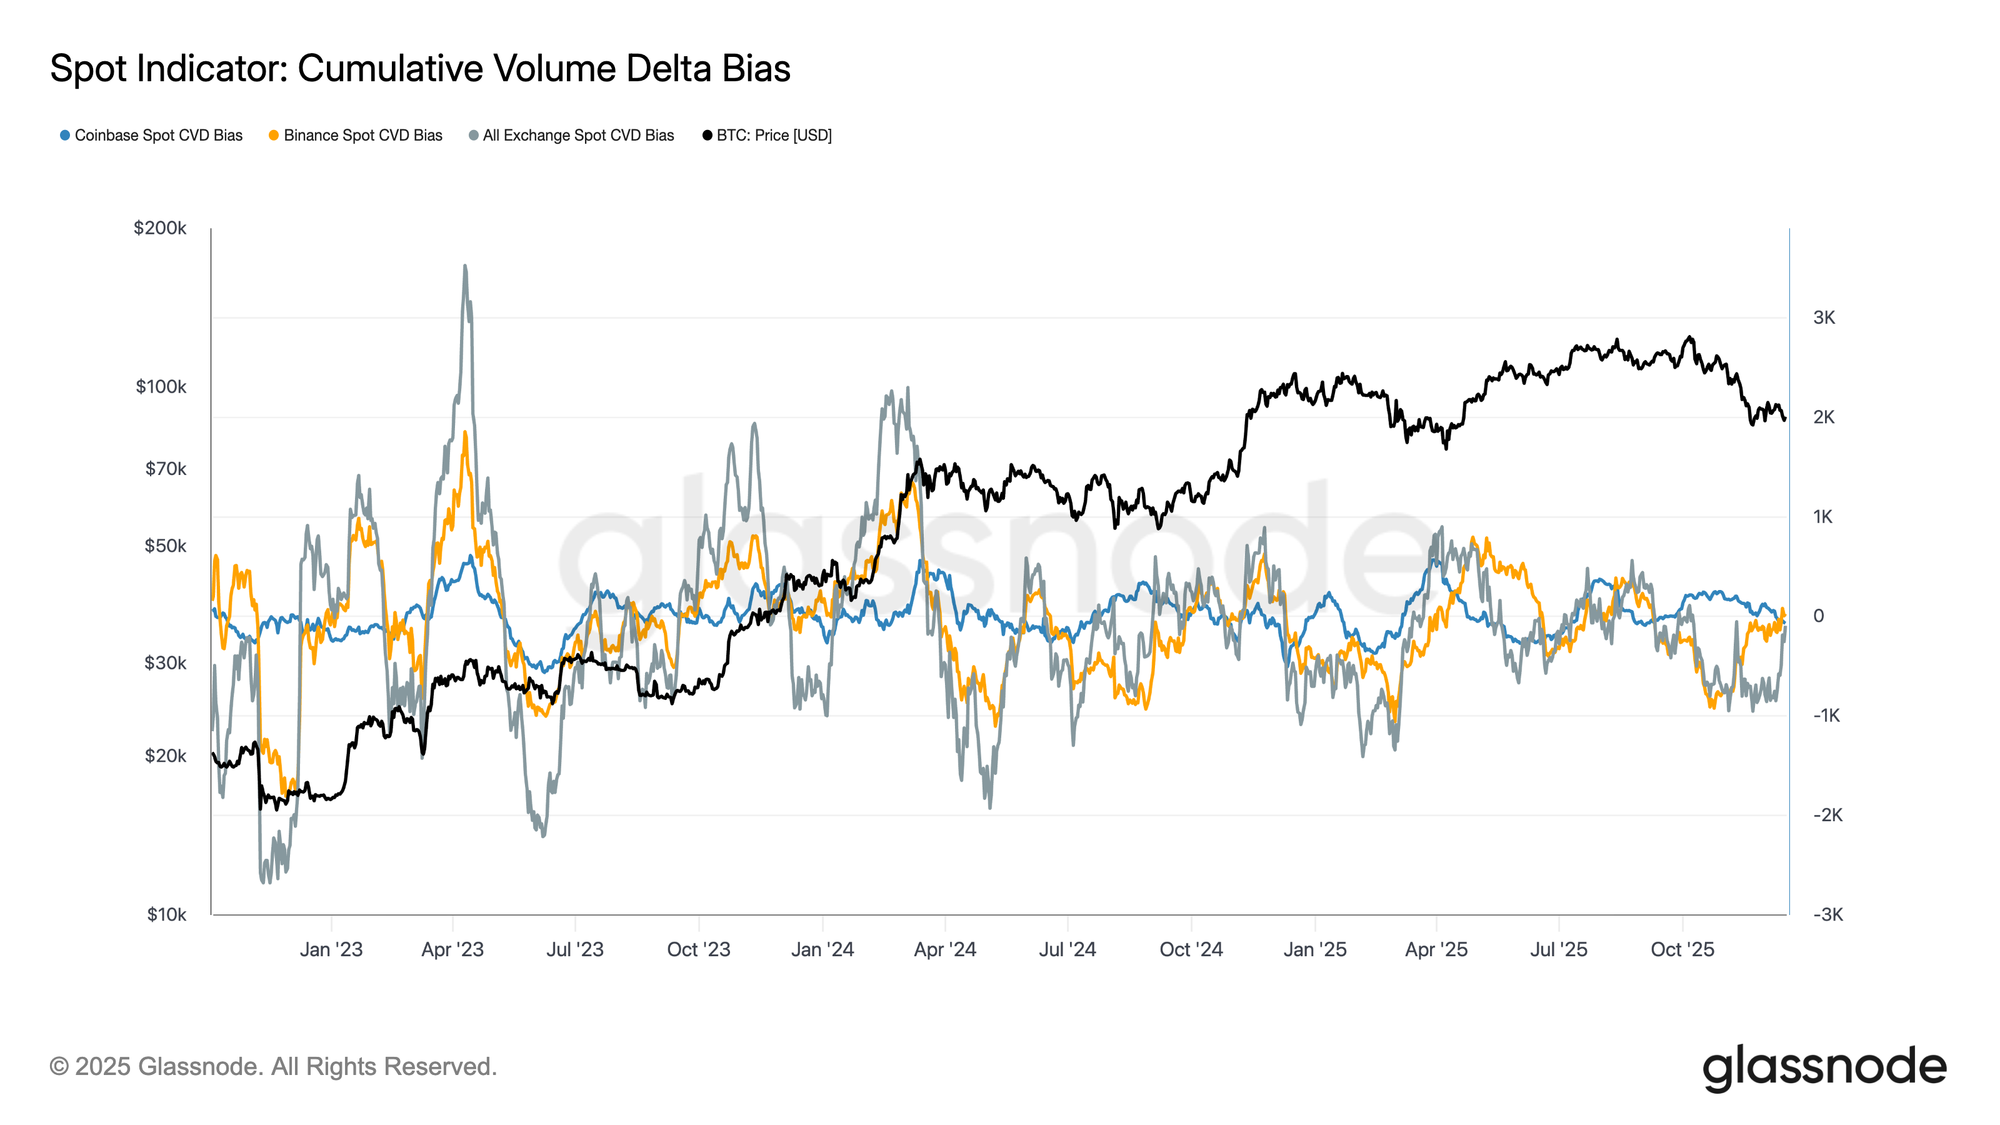
Spot Demand Lacks Persistence
Spot market flows continue to reflect an uneven demand profile across major venues. Cumulative Volume Delta bias shows periodic bursts of buy-side activity, but these moves have failed to develop into sustained accumulation, particularly during recent price pullbacks. Coinbase spot CVD remains relatively constructive, indicating steadier participation from US-based investors, while Binance and aggregate exchange flows remain choppy and largely directionless.
This dispersion points to selective engagement rather than coordinated spot demand. Recent declines have not triggered a decisive expansion in positive CVD, suggesting that dip-buying remains tactical and short-term in nature. In the absence of sustained spot accumulation across venues, price action continues to rely more heavily on derivatives positioning and liquidity conditions rather than organic spot-led demand.
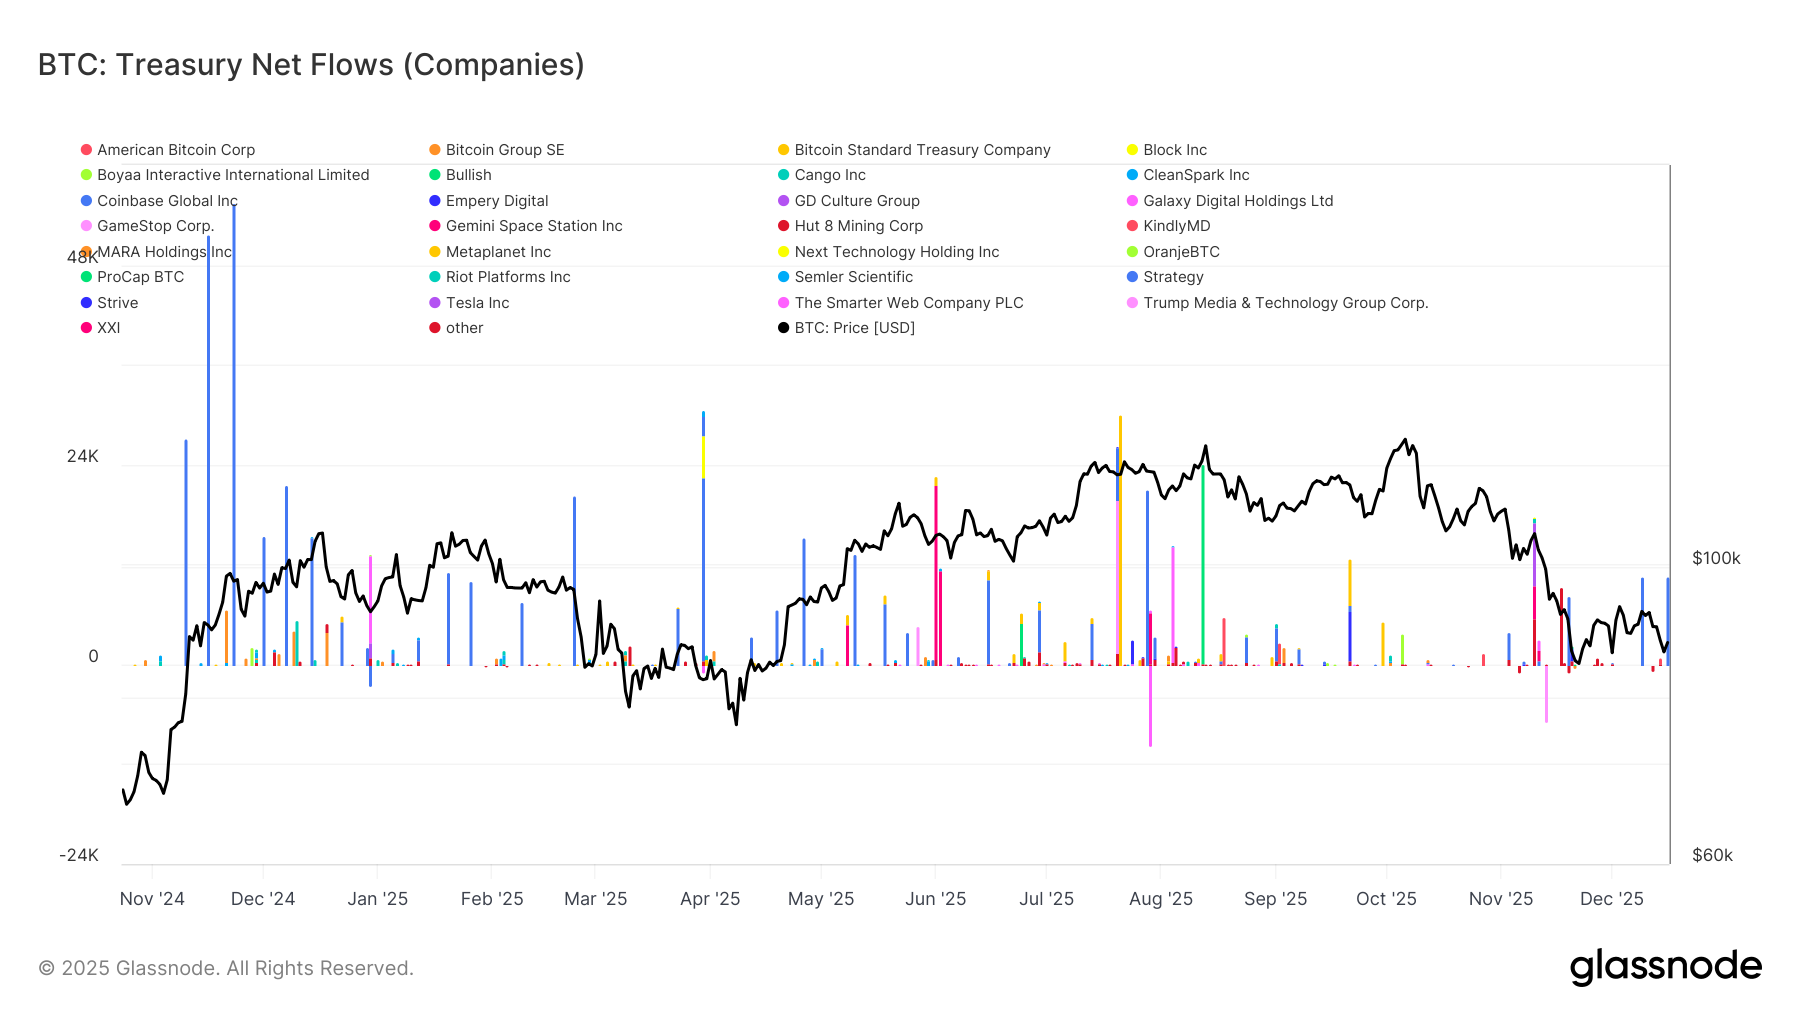
Treasury Flows Remain Episodic
Corporate Bitcoin treasury activity continues to be dominated by discrete, company-specific events rather than a sustained accumulation trend. Net flows show sporadic large inflows from a small subset of firms, interspersed with long periods of minimal activity, indicating that corporate demand remains opportunistic rather than systematic. These bursts often coincide with favourable price conditions or strategic balance sheet decisions, but they have not formed a consistent bid capable of shaping broader market structure.
Importantly, recent price weakness has not triggered a coordinated increase in treasury accumulation, suggesting that most corporates remain disciplined and price-sensitive. As a result, corporate treasuries are contributing to headline flow volatility but are not yet acting as a reliable, cycle-wide source of structural demand.
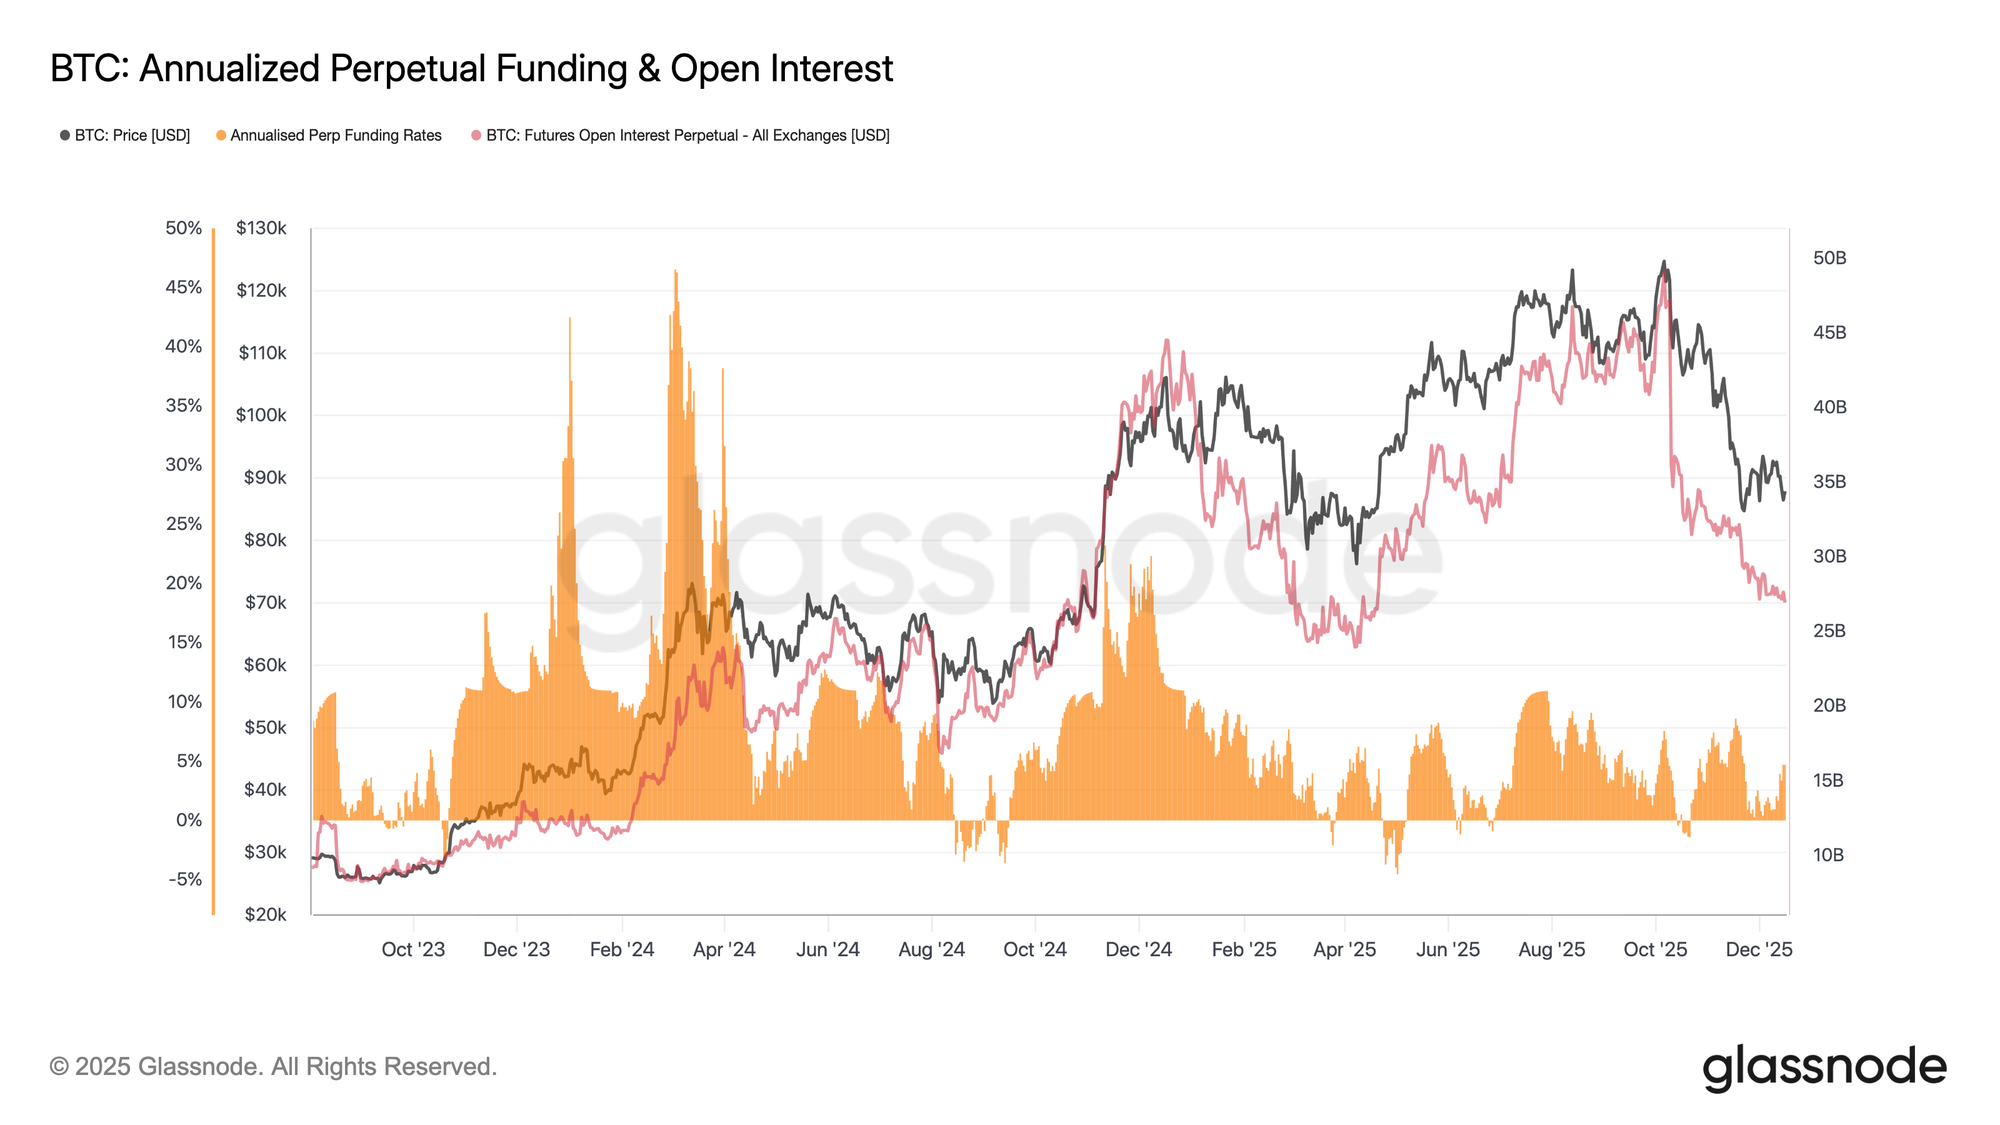
Futures Positioning Continues to De-Risk
Alongside subdued spot activity, perpetual futures markets remain characterized by muted risk appetite. Open interest has continued to trend lower from cycle highs, signalling ongoing position reduction rather than fresh leverage deployment. This unwind has occurred alongside relatively contained funding rates, which have oscillated around neutral levels for much of the recent decline.
Importantly, the absence of persistently elevated funding suggests that the drawdown has not been driven by excessive long positioning or overcrowded leverage. Instead, futures markets appear to be in a consolidation phase, with traders prioritizing balance sheet management over directional conviction.
With leverage already reduced and funding restrained, futures positioning is no longer a primary source of downside pressure. However, the lack of renewed open interest growth also highlights limited speculative appetite to support a sustained upside move at present.
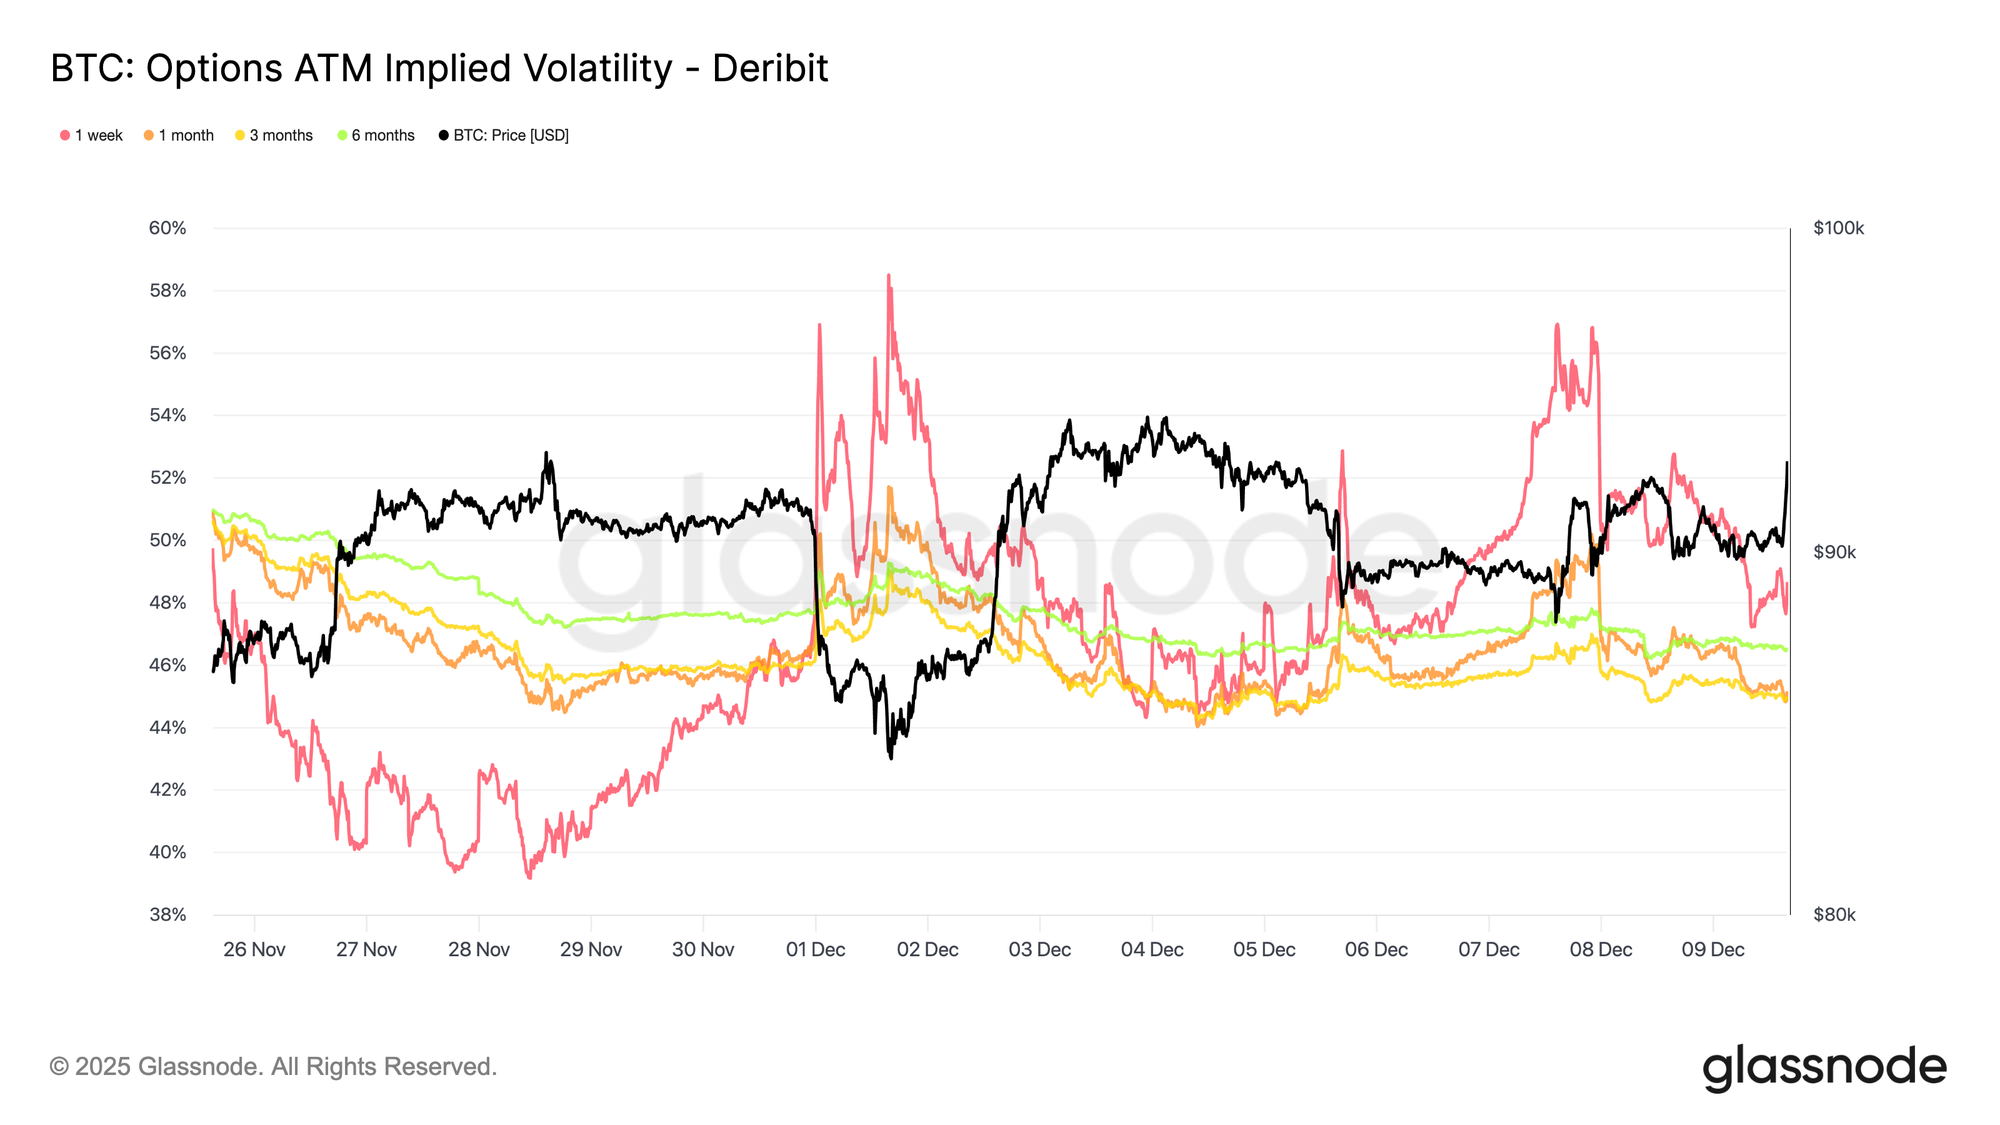
Front-End Volatility Fades
Following the derivatives de-risking, implied volatility has continued to compress at the front end after the FOMC, while longer-dated maturities have remained comparatively stable despite a modest decline. This configuration suggests traders are actively reducing exposure to near-term uncertainty rather than reassessing the broader volatility regime. Short-dated implied volatility is most sensitive to event risk, and when it falls, it typically reflects a deliberate decision to step back from immediate catalysts.
The current calm is therefore not accidental. Volatility is being sold into the market, pointing to positioning effects rather than disengagement or a lack of liquidity.
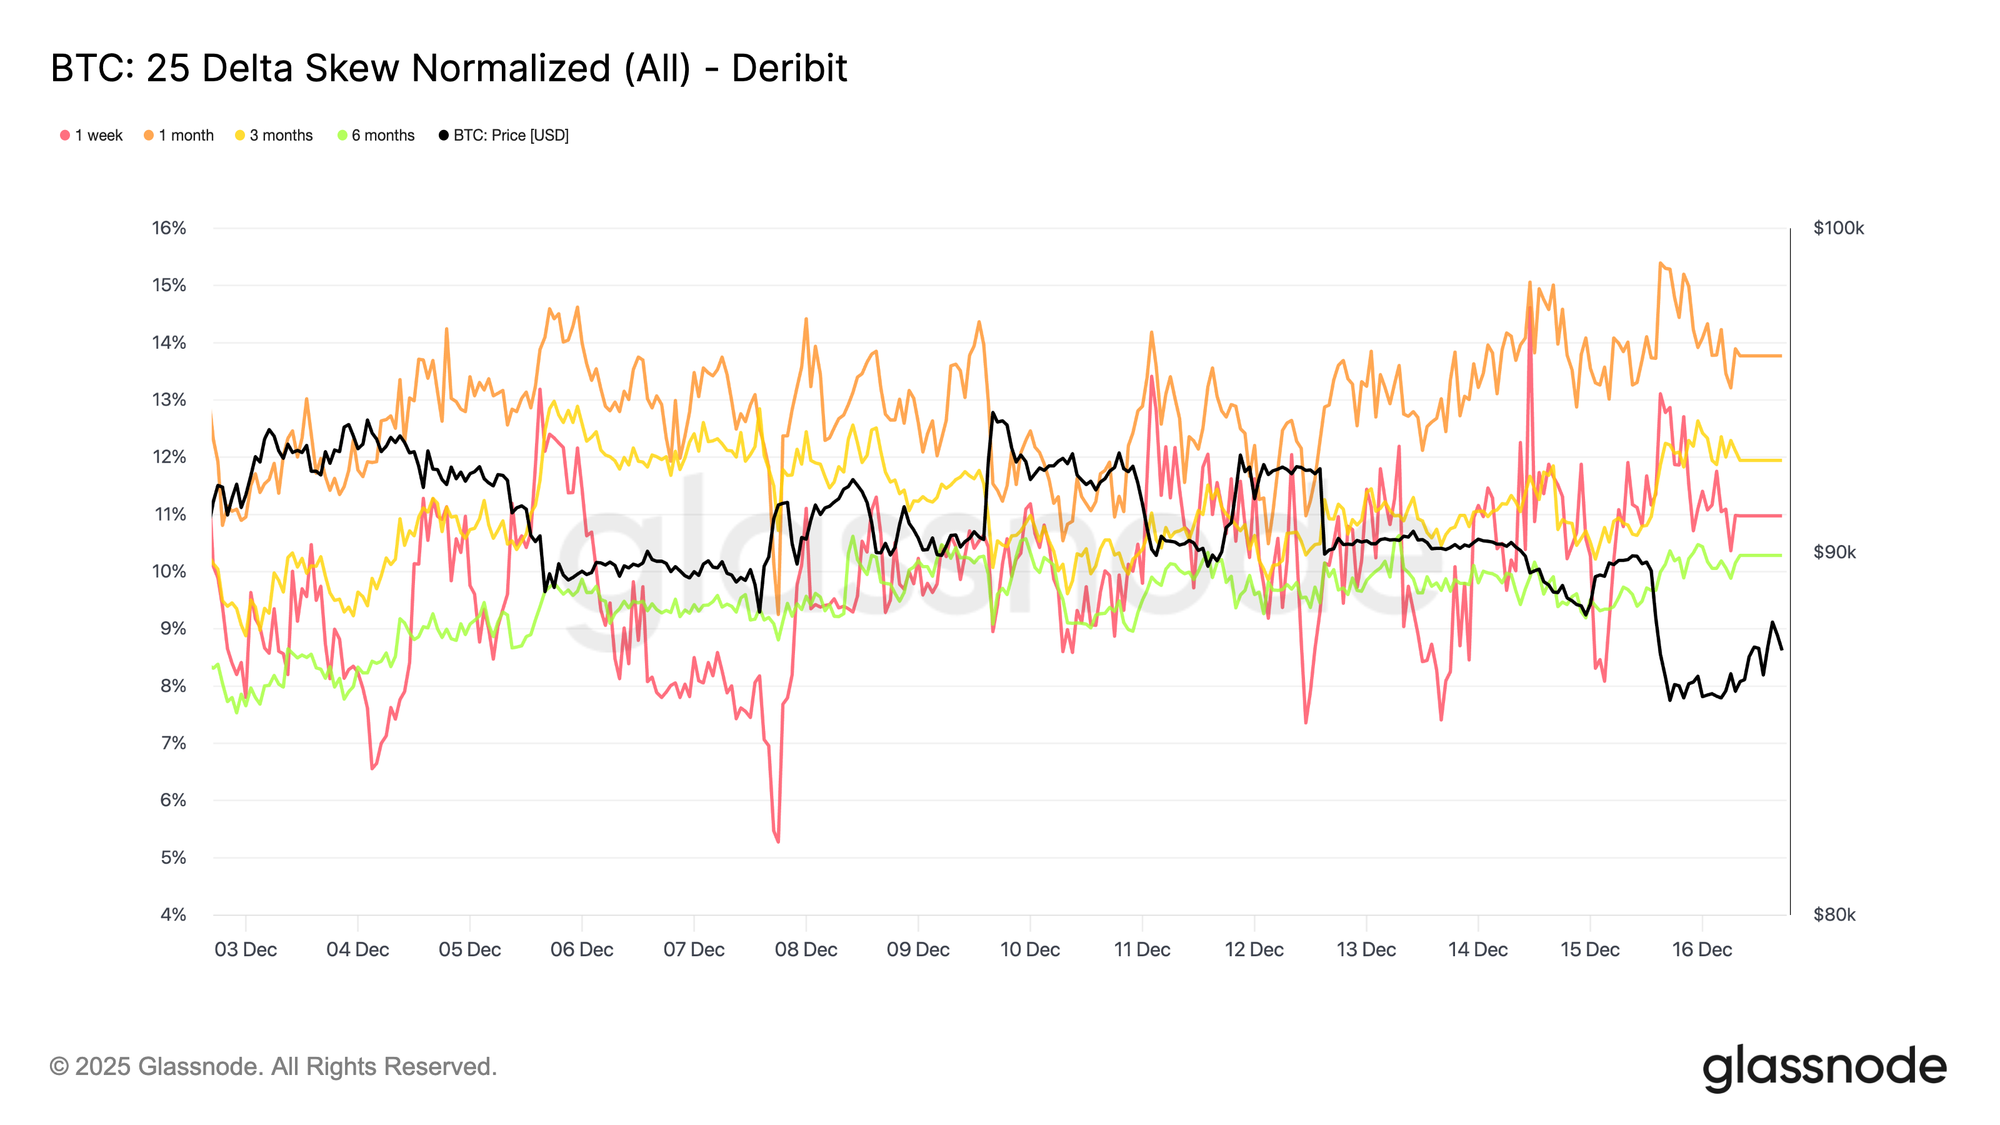
Downside Risk Holds
In line with softer front-end volatility, the 25-delta skew has remained broadly stable across maturities, holding in put territory even as implied volatility has compressed at the front end. This indicates that downside puts continue to trade at a premium to calls, but that premium is not widening. In effect, traders are maintaining downside protection rather than increasing it.
Set against falling short-dated implied volatility, this stability suggests that concern around sharp downside moves has eased without disappearing entirely. The market is stepping back from defensive escalation, while stopping short of rotating into outright bullish positioning.
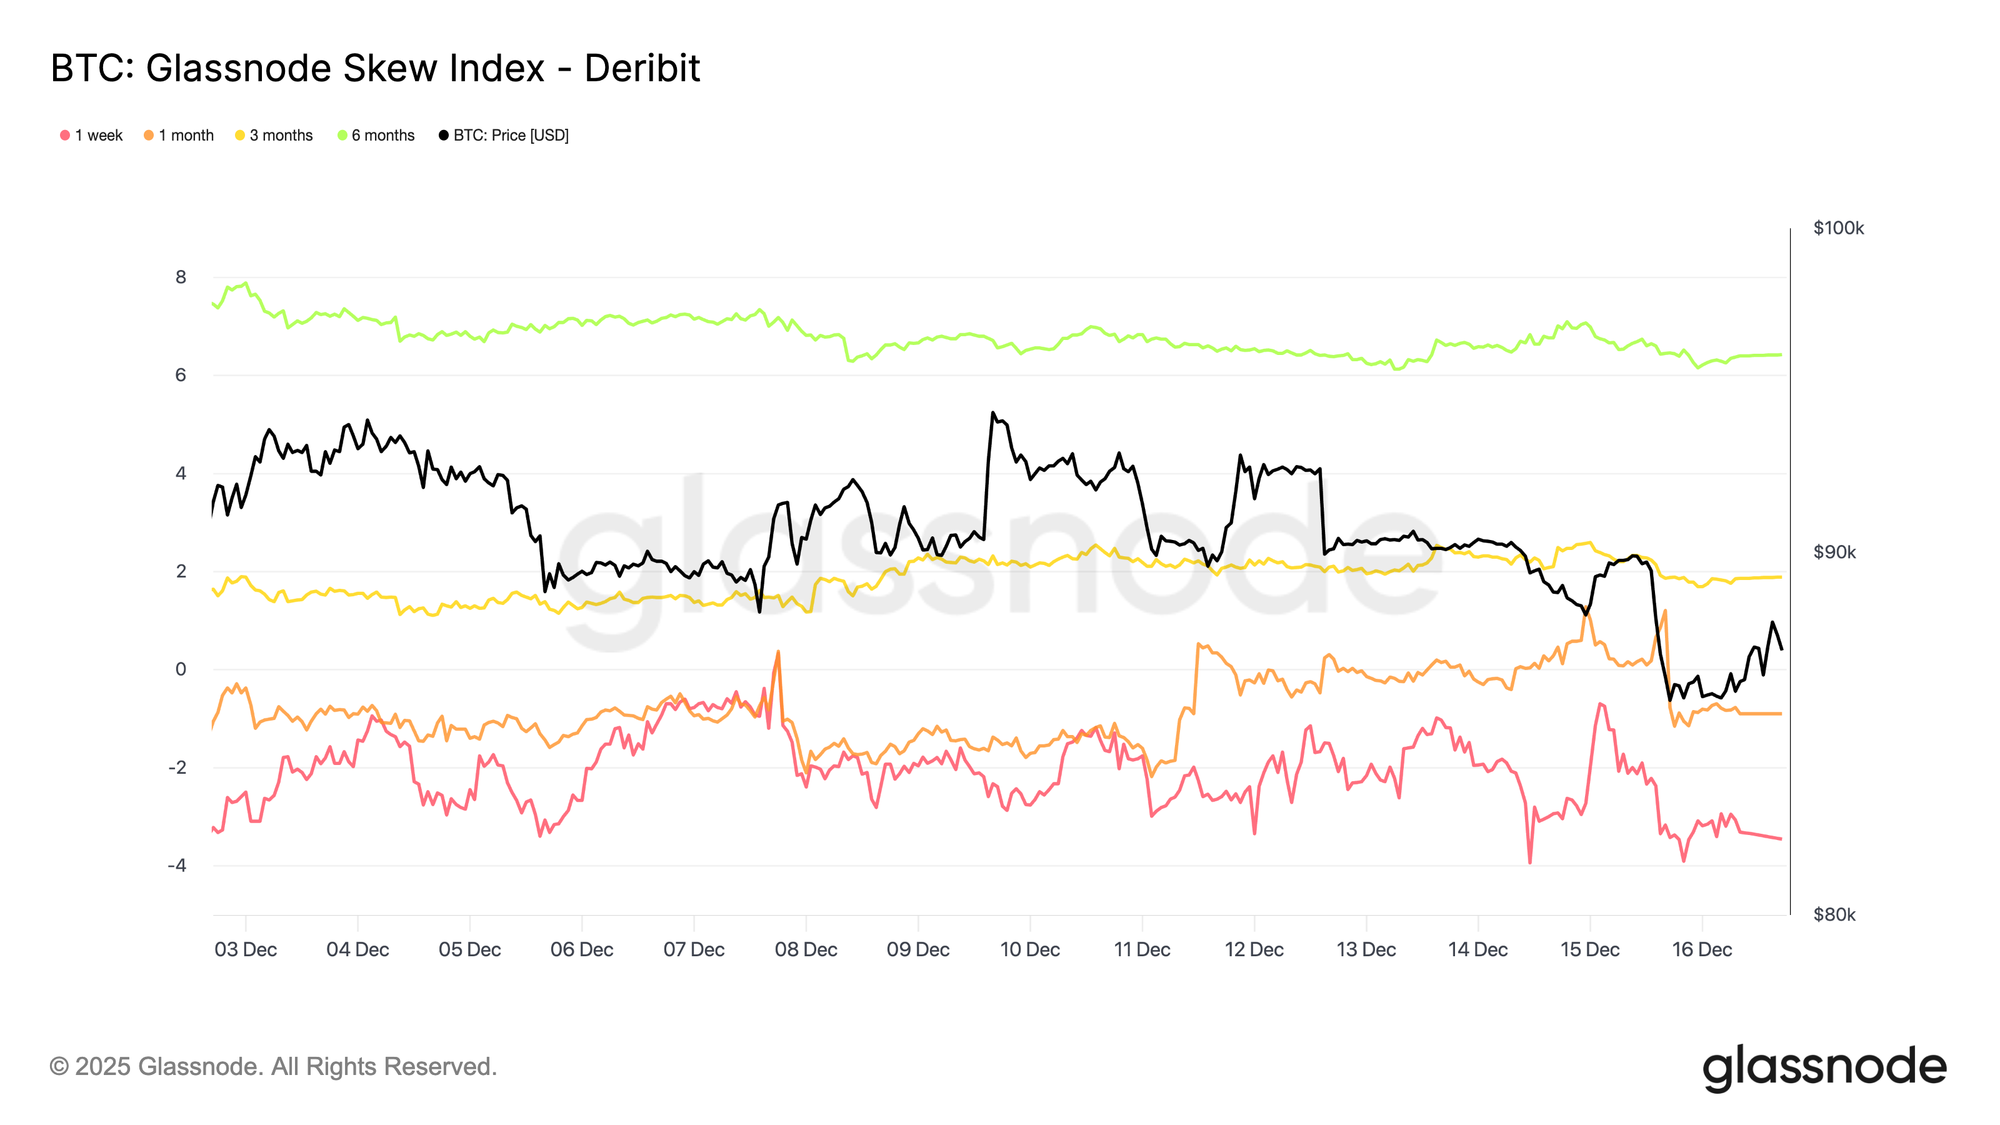
Skew Signals Split Horizons
Looking further along the curve, while 25-delta skew indicates that downside protection remains priced across maturities, the skew index adds context on how that risk is distributed. At short maturities, the index remains negative, consistent with the 25-delta skew and confirming that downside risk continues to command a premium in the near term. Further out, however, the skew index turns positive, indicating relatively higher pricing for upside exposure at longer horizons.
Read together, these measures suggest that caution persists in the short term, while longer-dated positioning reflects growing interest in upside scenarios rather than an increase in downside hedging. Risk is being maintained near term and rebalanced further out the curve, rather than shifting decisively in one direction.
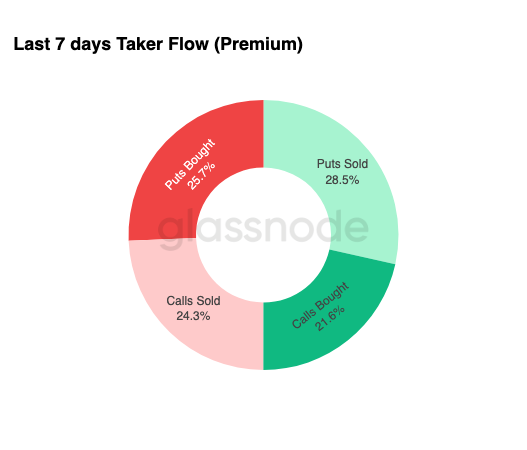
Flows Favour Premium Harvesting
Consistent with the stabilized skew profile, options flow shows how traders are expressing this environment in practice. Over the past week, taker flow has been dominated by puts sold, followed closely by puts bought, indicating active premium monetization alongside continued hedging. Taker flow reflects aggressive execution rather than passive positioning, making it a useful signal of current intent. Put selling is typically associated with yield generation and confidence that downside moves will remain contained, while the presence of put buying shows that protection has not been fully abandoned.
Taken together, flows suggest traders are less focused on positioning for a breakout and more comfortable harvesting premium in a balanced, range-driven market rather than pricing an imminent tail-risk event.
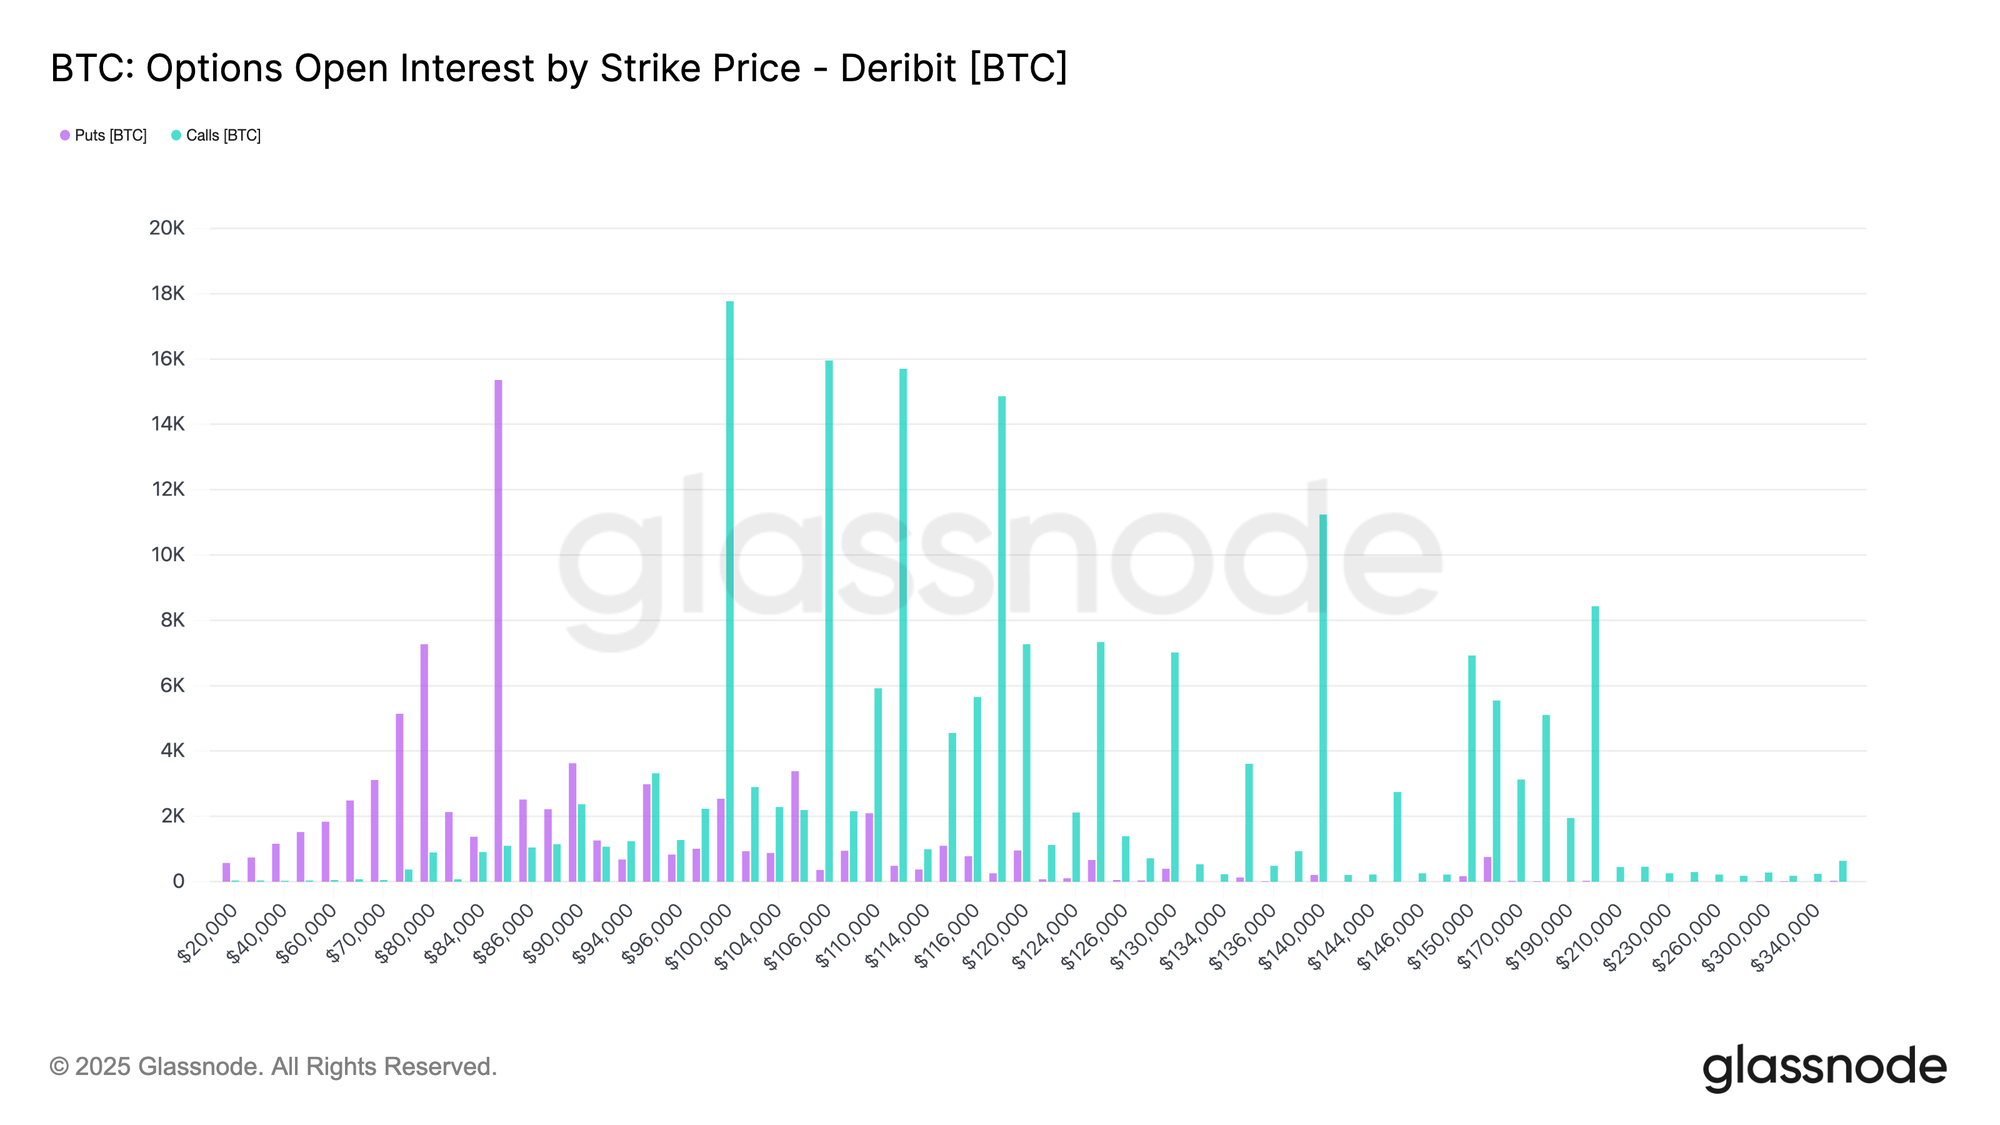
Expiry Pins the Market
At the far end of the options picture, open interest shows that risk is heavily concentrated in two late-December expiries, with a meaningful portion rolling off on December 19, followed by a much larger concentration on December 26. Large expiries matter because they compress positioning and hedging activity into specific dates, amplifying their influence on short-term price dynamics.
At current levels, this concentration leaves dealers long gamma on both sides of the market, incentivizing them to sell rallies and buy dips to remain hedged. This behaviour mechanically reinforces range-bound price action and suppresses volatility as expiry approaches.
The effect intensifies into the largest expiry of the year on December 26. Once that expiry passes and associated hedges roll off, the price gravity created by this positioning naturally weakens, allowing market structure to reset and new dynamics to emerge.
Conclusion
The market continues to trade within a fragile, time-sensitive structure, shaped by heavy overhead supply, rising loss realization, and fading demand persistence. Price rejection near $93k and the subsequent drift toward $85.6k reflect the dense supply accumulated between $93k–$120k, where prior top buyers continue to cap recovery attempts. As long as price remains below the 0.75 quantile (~$95k) and fails to reclaim the Short-Term Holder Cost Basis at $101.5k, upside progress is likely to remain constrained.
Despite this pressure, patient demand has so far defended the True Market Mean near $81.3k, preventing a deeper breakdown. Spot demand remains selective, corporate treasury flows episodic, and futures positioning continues to de-risk rather than rebuild conviction. Options markets reinforce this range-bound regime, with front-end volatility compressing, downside risk remaining priced but stable, and expiry-driven positioning pinning price action into late December.
In sum, Bitcoin remains caught between structural support near $81k and persistent sell pressure overhead. A meaningful shift will require either seller exhaustion above $95k or a renewed influx of liquidity capable of absorbing supply and reclaiming key cost-basis levels.
Disclaimer: This report does not provide any investment advice. All data is provided for informational and educational purposes only. No investment decision shall be based on the information provided here, and you are solely responsible for your own investment decisions.
Exchange balances presented are derived from Glassnode’s comprehensive database of address labels, which are amassed through both officially published exchange information and proprietary clustering algorithms. While we strive to ensure the utmost accuracy in representing exchange balances, it is important to note that these figures might not always encapsulate the entirety of an exchange’s reserves, particularly when exchanges refrain from disclosing their official addresses. We urge users to exercise caution and discretion when utilizing these metrics. Glassnode shall not be held responsible for any discrepancies or potential inaccuracies.
Please read our Transparency Notice when using exchange data.