Trapped Below Market Mean

insights.glassnodePublicado em 2026-06-03Última atualização em 2026-06-03

Resumo

The market encountered strong resistance at the Short-Term Holder Cost Basis and True Market Mean near $78k-$79k, a textbook rejection in the ongoing bear market. The failure to break through this zone, driven by aggressive profit-taking from recent buyers overwhelming demand, shifts the mid-term bias downward. Immediate support is now watched near the -1 standard deviation band around $68k. On-chain data confirmed the rejection, showing short-term holder profit-taking spiking as price approached $80k. A key accumulation cluster between $65k-$70k provides a foundation, potentially supporting a bounce, but it could also become the next major support if sell pressure persists. Off-chain, spot selling pressure is easing and institutional flows show early signs of stabilization, though full conviction is lacking. Derivatives markets show a record net short bias and declining implied volatility, indicating a defensive, range-bound environment. The 80k strike is a key pivot; a break above could trigger a short squeeze. Overall, the market remains trapped below resistance, awaiting a clear expansion in spot demand or institutional inflows for a decisive directional move.

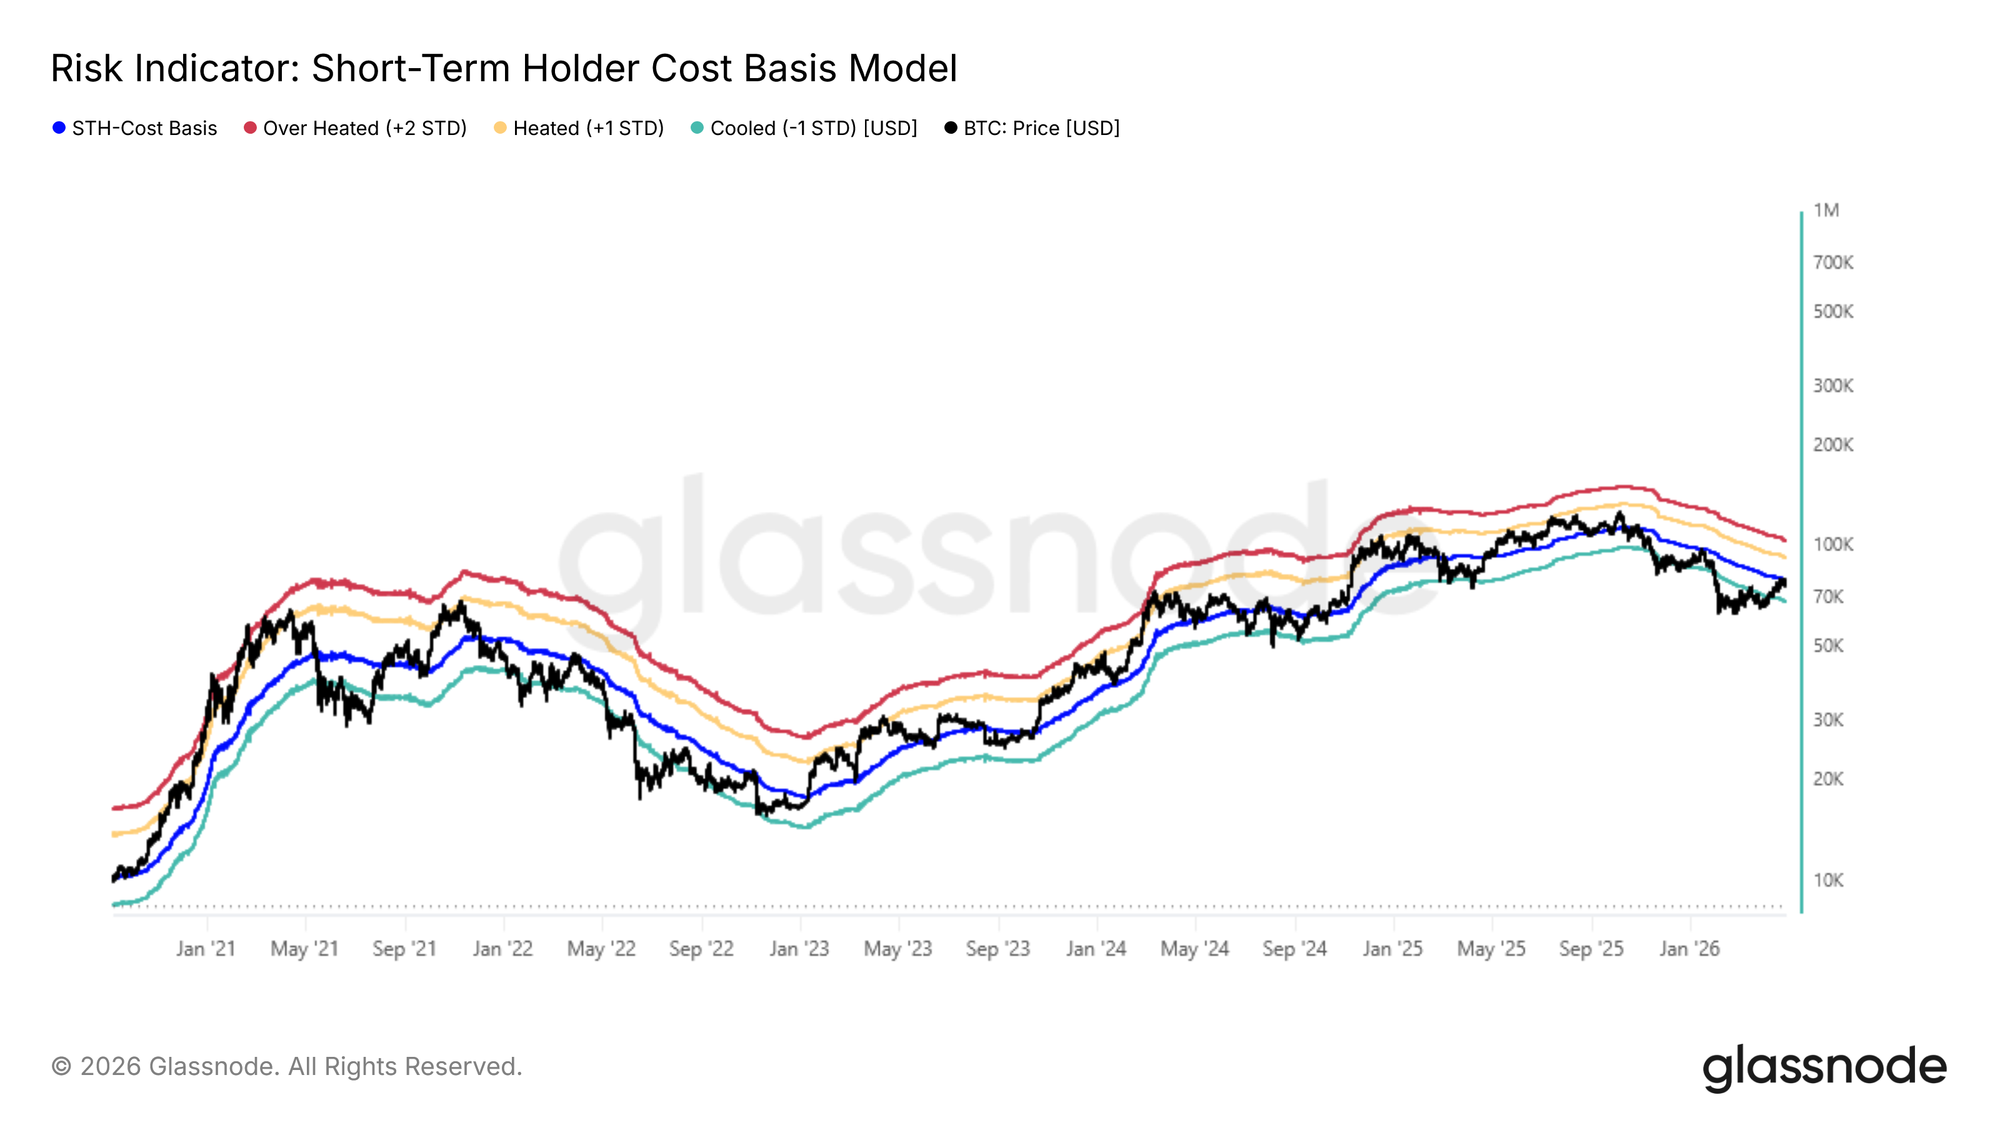
Last week, this report flagged the Short-Term Holder Cost Basis and the True Market Mean as the most probable resistance zone for the ongoing bear market rally, with profit realization by recent buyers already spiking to levels historically consistent with local top formation. Price subsequently found rejection precisely within this zone, failing to sustain above the True Market Mean at $78k and the Short-Term Holder Cost Basis at $79k. This behavior is a textbook pattern in bear markets, where price approaches the breakeven level of the most price-sensitive cohort, the incentive to exit positions overwhelms incoming demand, exhausting upside momentum.

With this rejection confirming overhead resistance, the mid-term bias tilts toward further downward pressure, and attention now shifts to the -1 standard deviation band near $68k as the most immediate structural support level to monitor.
Live Chart

Anatomy of the Rejection

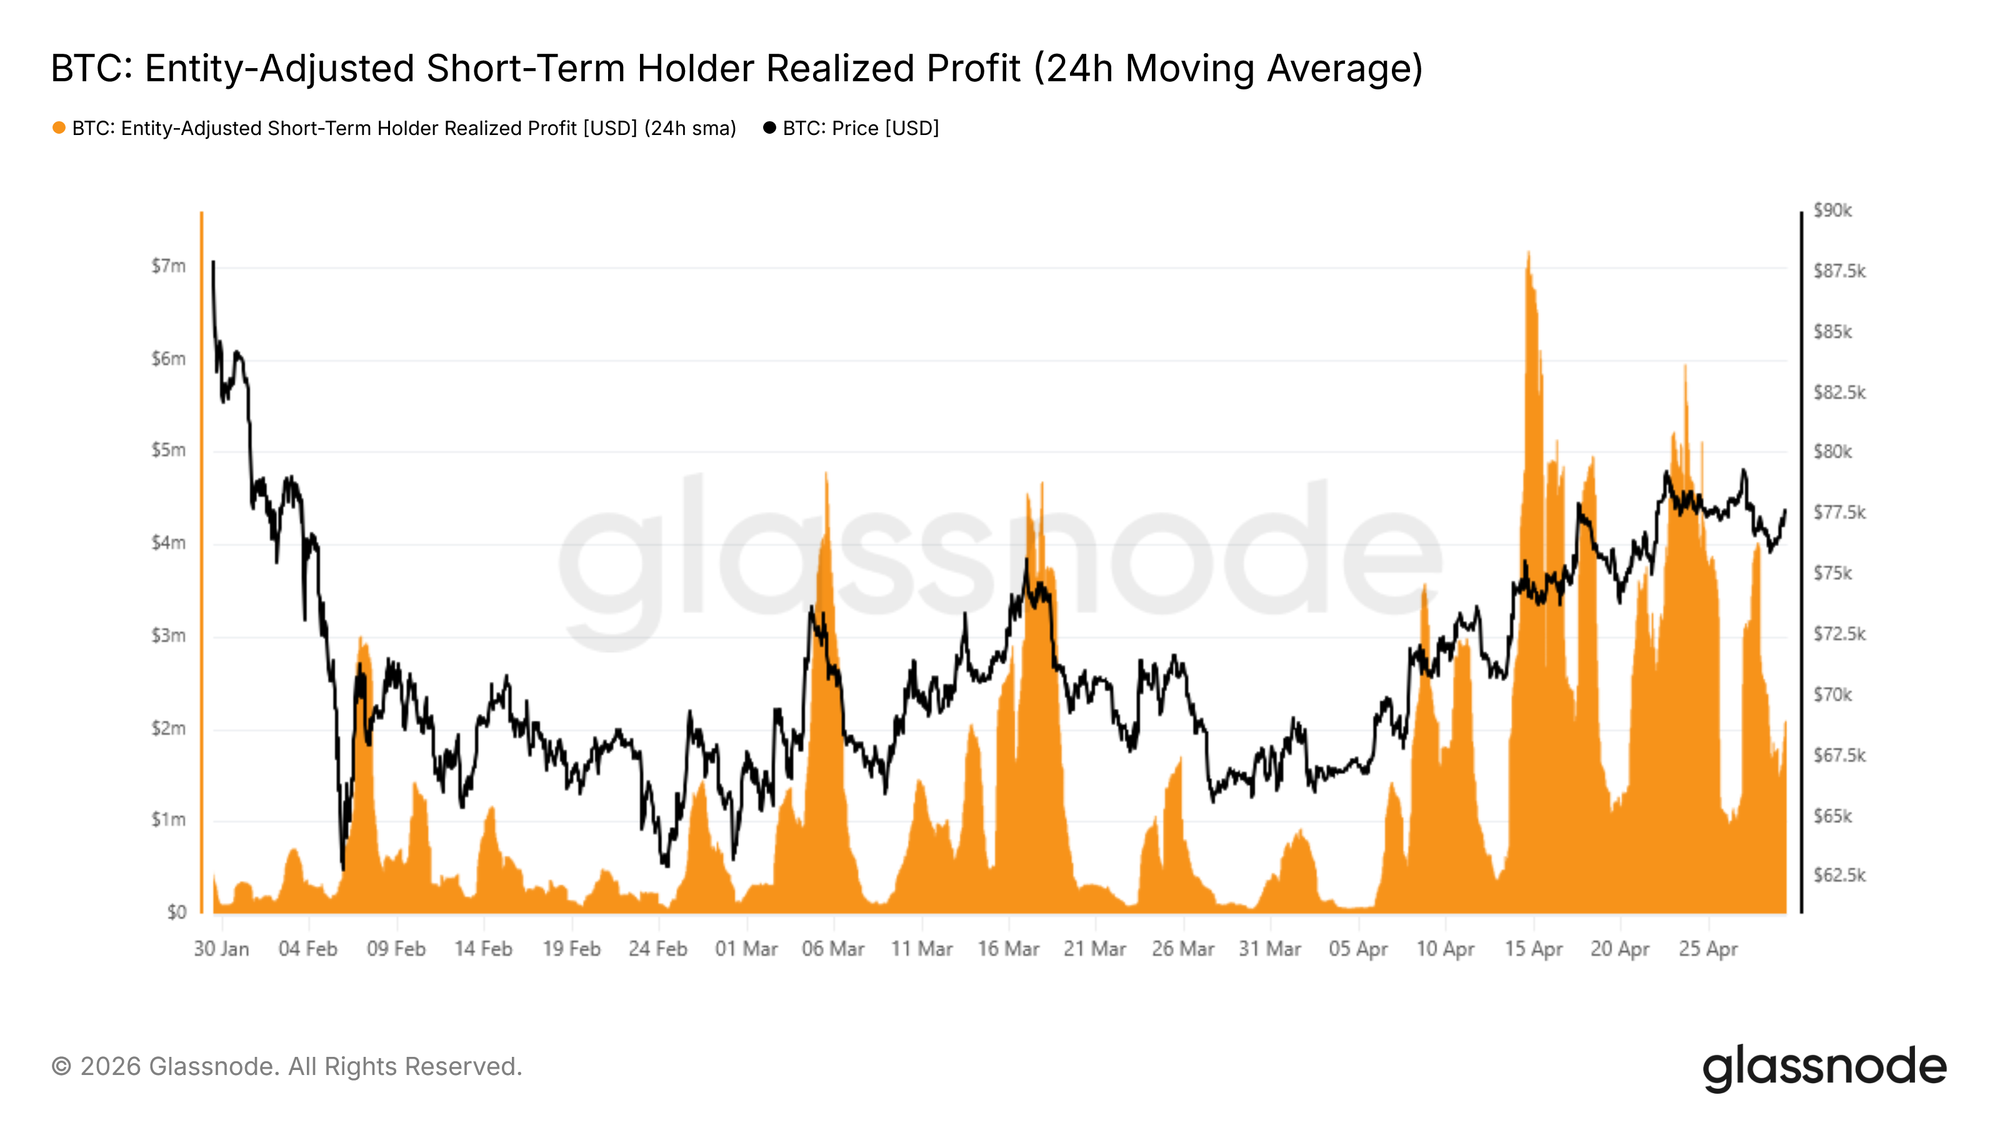
The rejection at the Short-Term Holder Cost Basis was not merely a price observation; on-chain spending data captures precisely how it unfolded. The 24-hour SMA of Short-Term Holder Realized Profit serves as a real-time gauge of how aggressively recent buyers are converting unrealized gains into exits.

As price approached $80k, this metric ramped to approximately $4M per hour, roughly four times the base level that had established itself since mid-April, confirming that short-term holders seized the rally as a distribution opportunity. The buy side simply lacked sufficient liquidity to absorb this wave of profit realization, capping momentum and triggering the subsequent rejection.

This metric is most useful when analyzed across two dimensions simultaneously: the baseline, which acts as a proxy for the broader trajectory of buy-side liquidity, and the peaks, which have consistently served as reliable local top indicators throughout the current bear market cycle.
Live Chart

Two Scenarios, One Cluster

The rejection at the True Market Mean and Short-Term Holder Cost Basis zone reinforces the broader structural weakness that has characterized this bear market. However, the picture is not unambiguously bearish.

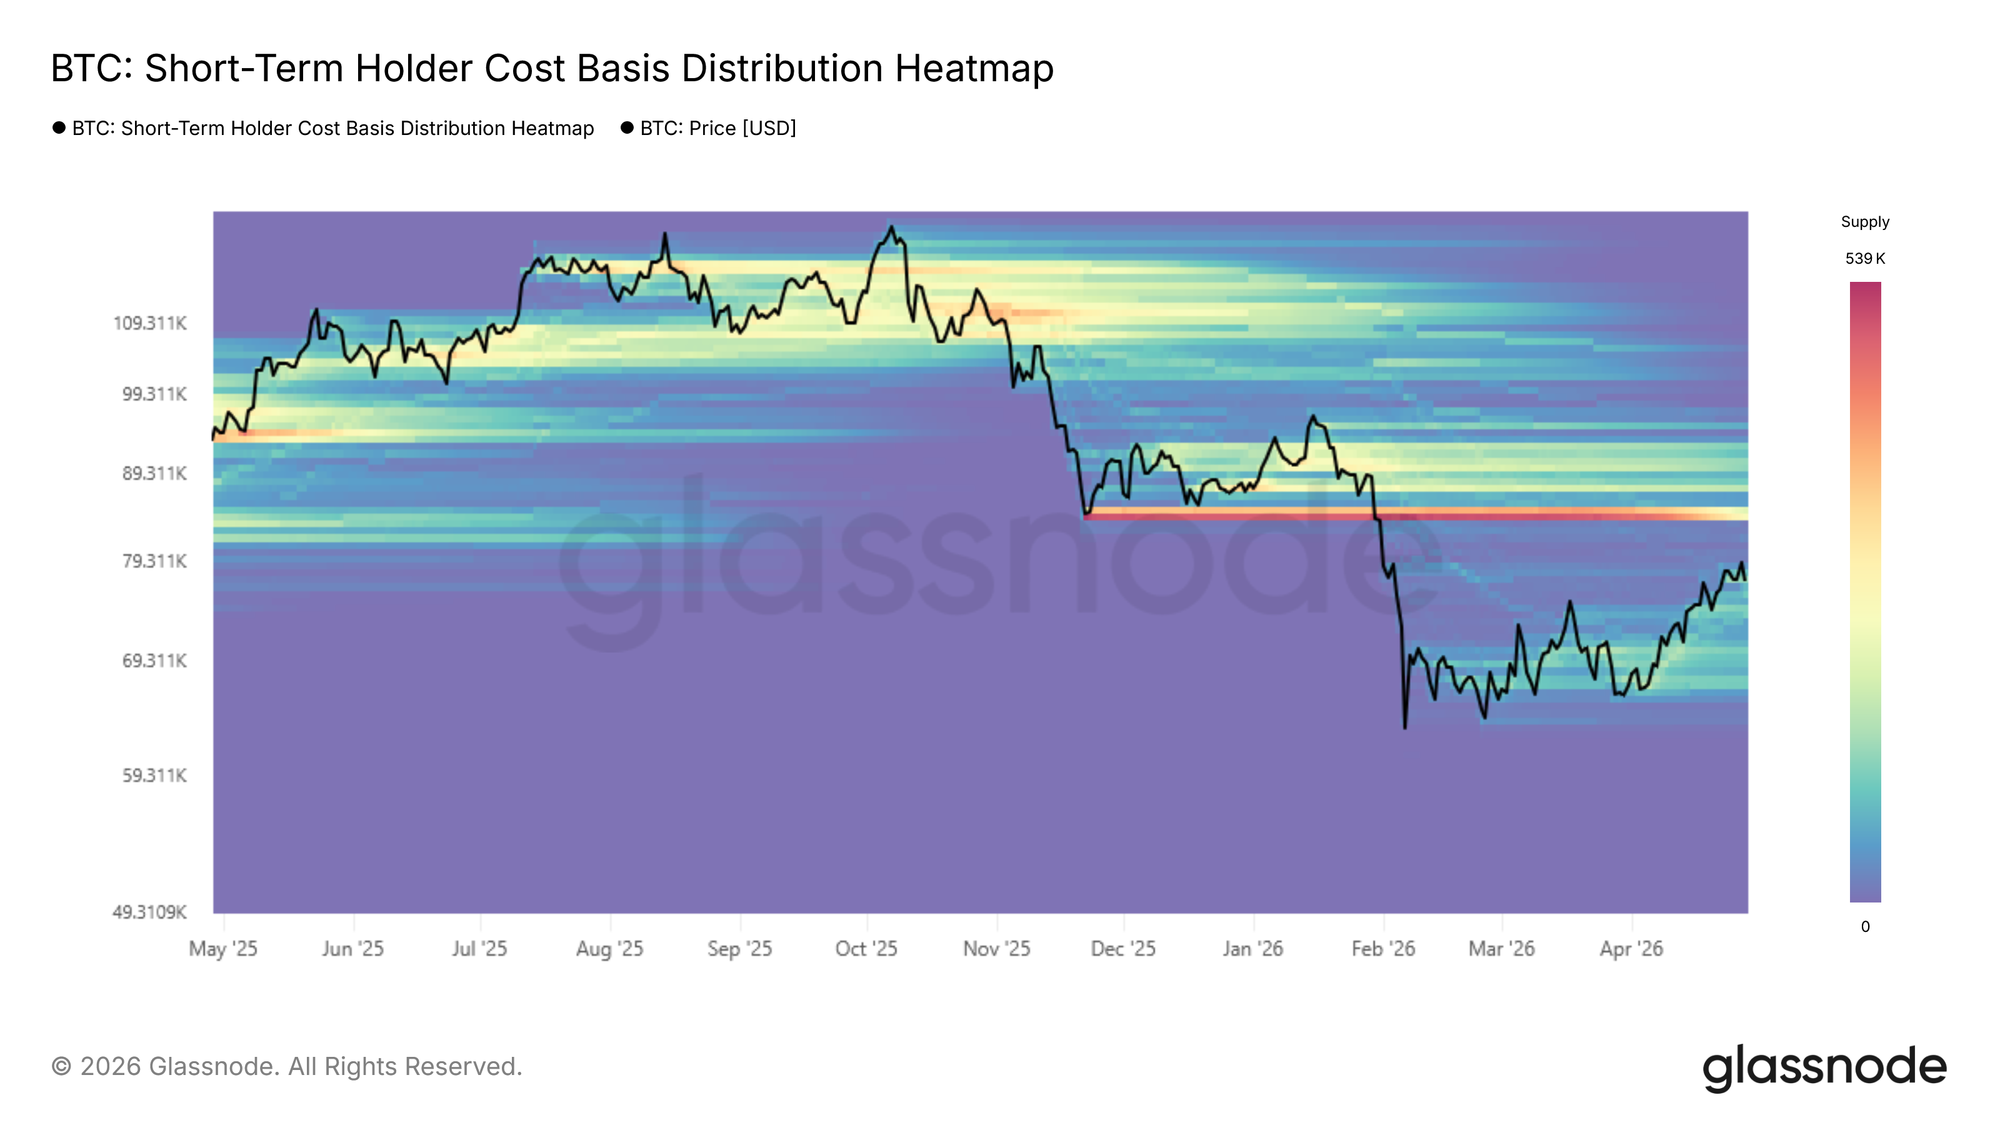
A dense accumulation cluster built over the past two months between $65k and $70k reflects a meaningful degree of buyer conviction at these levels, providing a foundation that could support a short-term bounce toward the lower band of the overhead supply cluster near $84k.

Conversely, should the market fail to absorb the persistent sell pressure emanating from the True Market Mean zone, this same $65k–$70k accumulation cluster, and more specifically the -1 standard deviation band of the Short-Term Holder Cost Basis near $68k, would serve as the primary support reference in the short to mid-term. The path forward therefore hinges on whether buyers within this range can sustain enough conviction to overcome the overhead distribution pressure.
Live Chart

Off-Chain Insights

Selling Pressure Eases, Buyers Re-Emerge

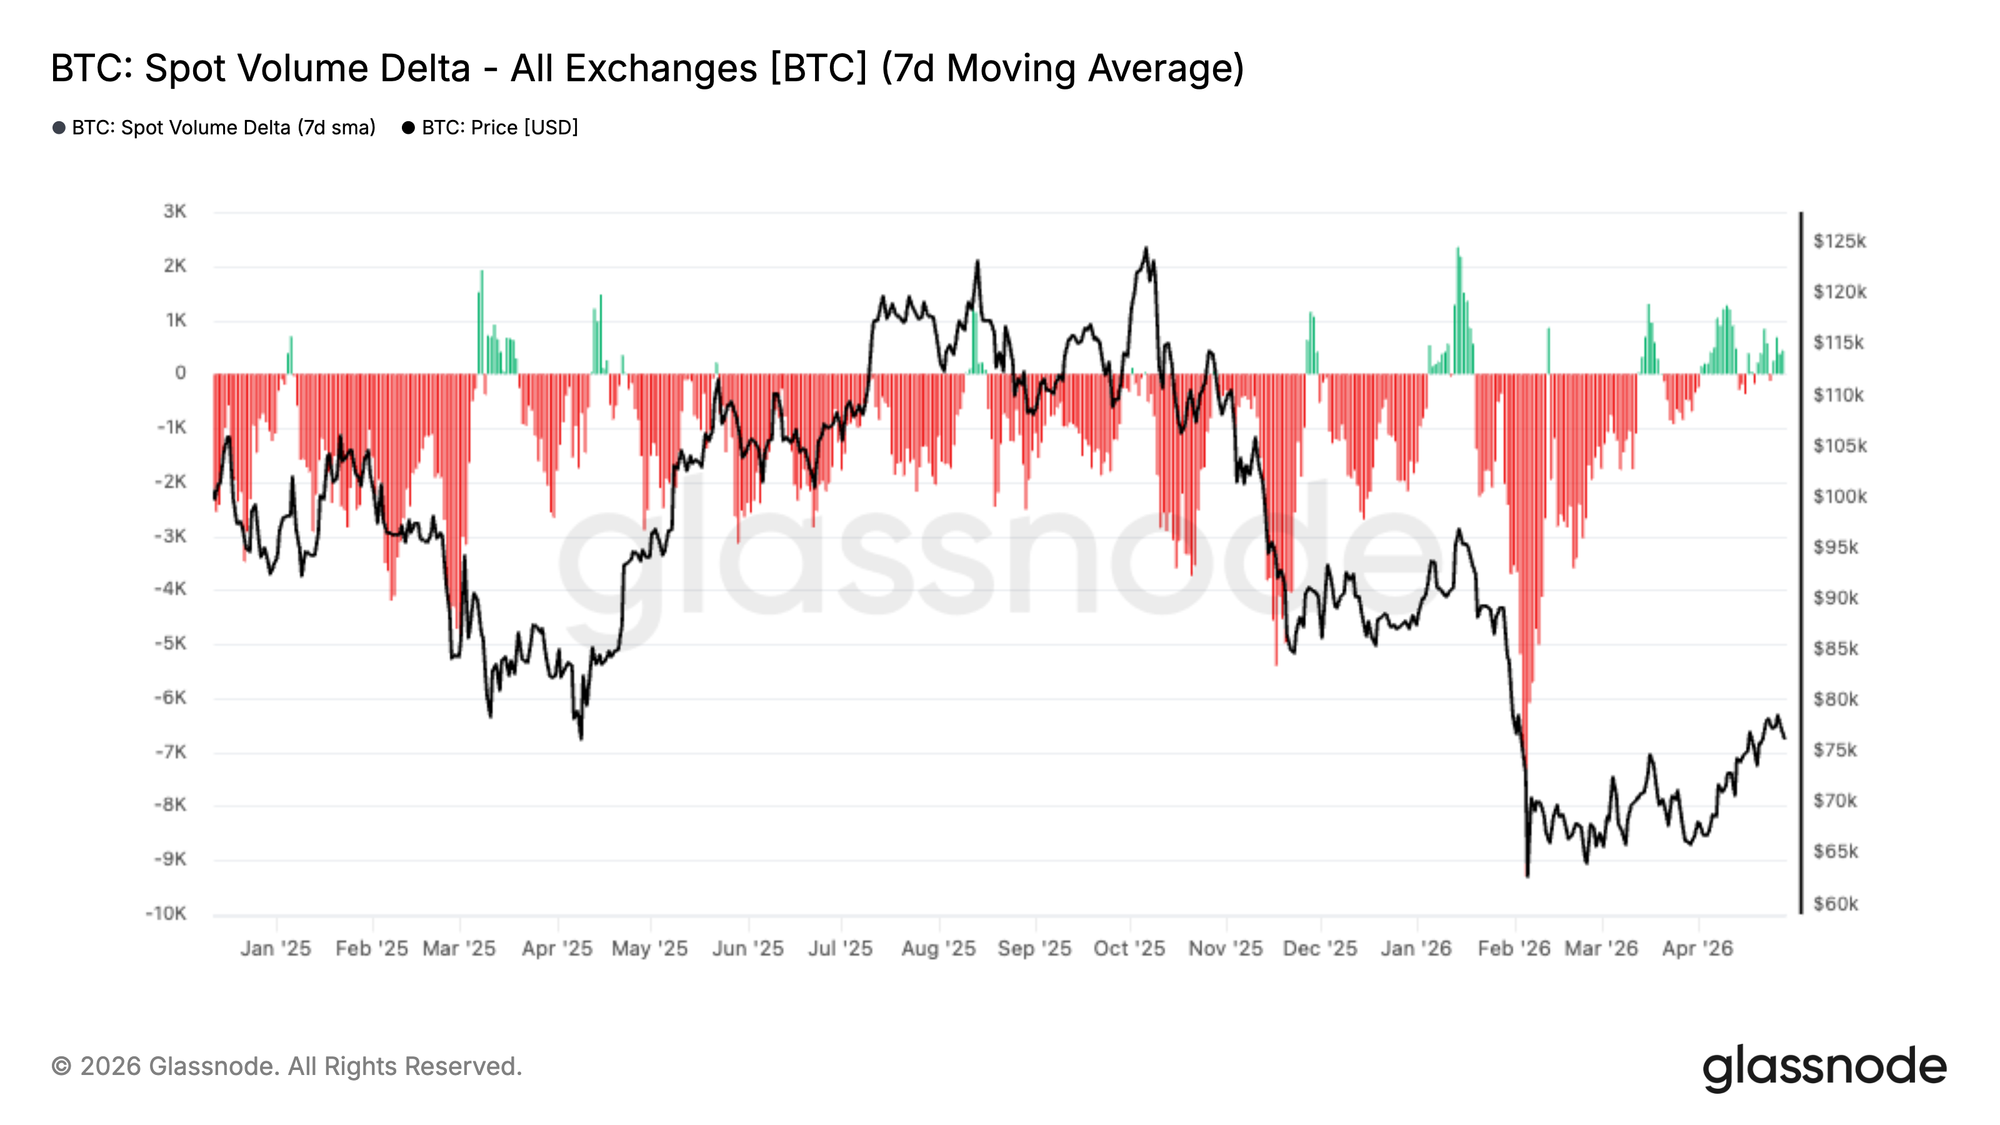
Spot Volume Delta has spent much of the past few months in deeply negative territory, reflecting sustained net selling pressure across exchanges. This persistent sell-side dominance aligned with the broader correction, particularly during the sharp drawdown into the ~$60–70K range.

However, recent data shows a clear shift. The 7-day average is now recovering toward neutral, with intermittent bursts of positive delta beginning to appear. This suggests that sell pressure is easing, while buyers are starting to step back in at current levels.

From a market structure perspective, this transition is important. While not yet indicative of strong accumulation, the move toward balance signals improving spot demand and reduced urgency from sellers. For a more durable recovery, continued expansion into positive territory will be required, confirming that buyers are regaining control of the tape.
Live Chart

Institutional Flows Rebuild

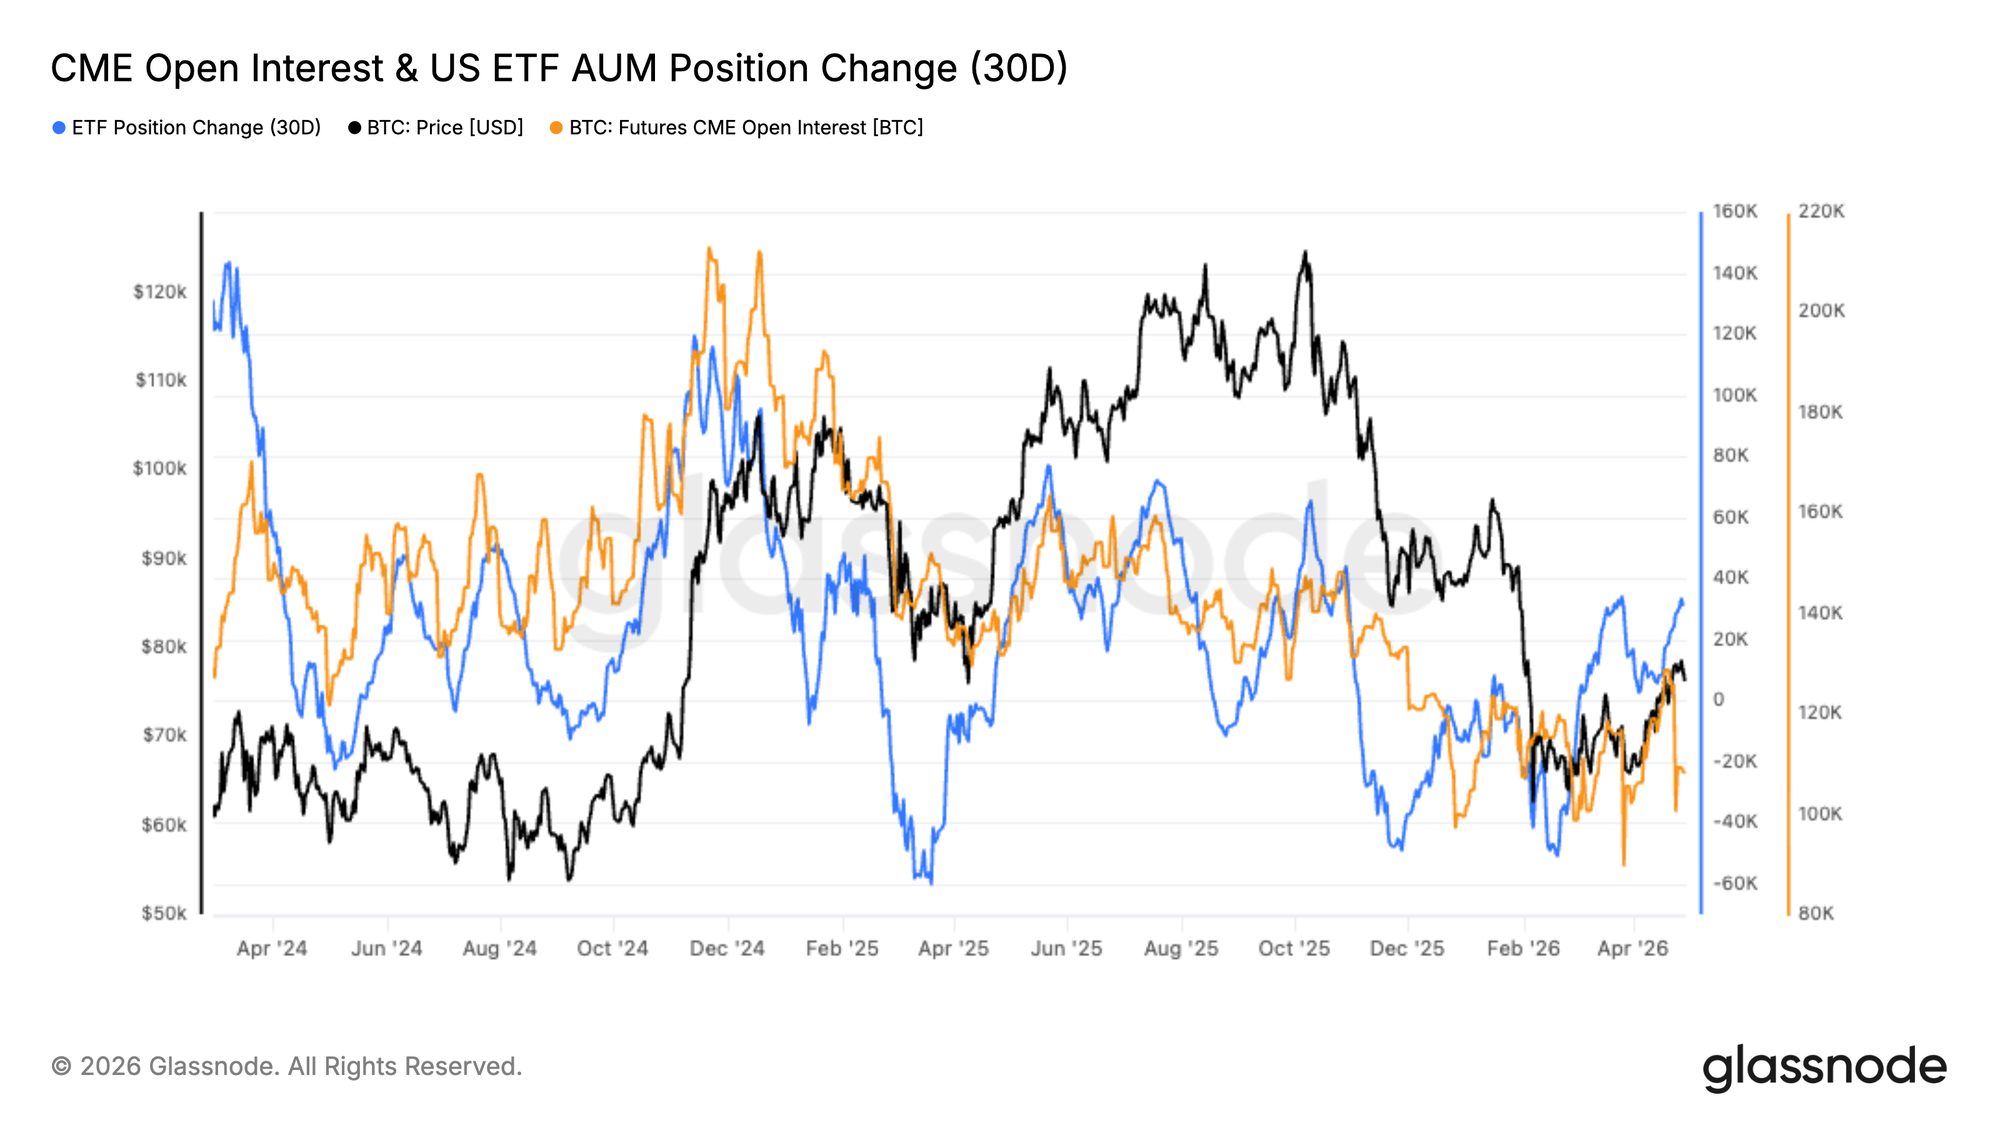
Institutional positioning is beginning to stabilise, with both CME Open Interest and US Spot ETF AUM showing early signs of recovery after a period of outflows. ETF position change has rebounded from deeply negative levels, while CME open interest appears to be basing, suggesting early re-engagement.

Earlier declines reflected broad risk-off positioning, with capital exiting both futures and ETF channels during the correction. The recent uptick points to a shift toward cautious re-accumulation, rather than aggressive positioning.

Sustained inflows will be needed to support a stronger trend. For now, the data signals early-stage institutional re-entry, but not yet full conviction.
Live Chart

Deepest Short Bias on Record

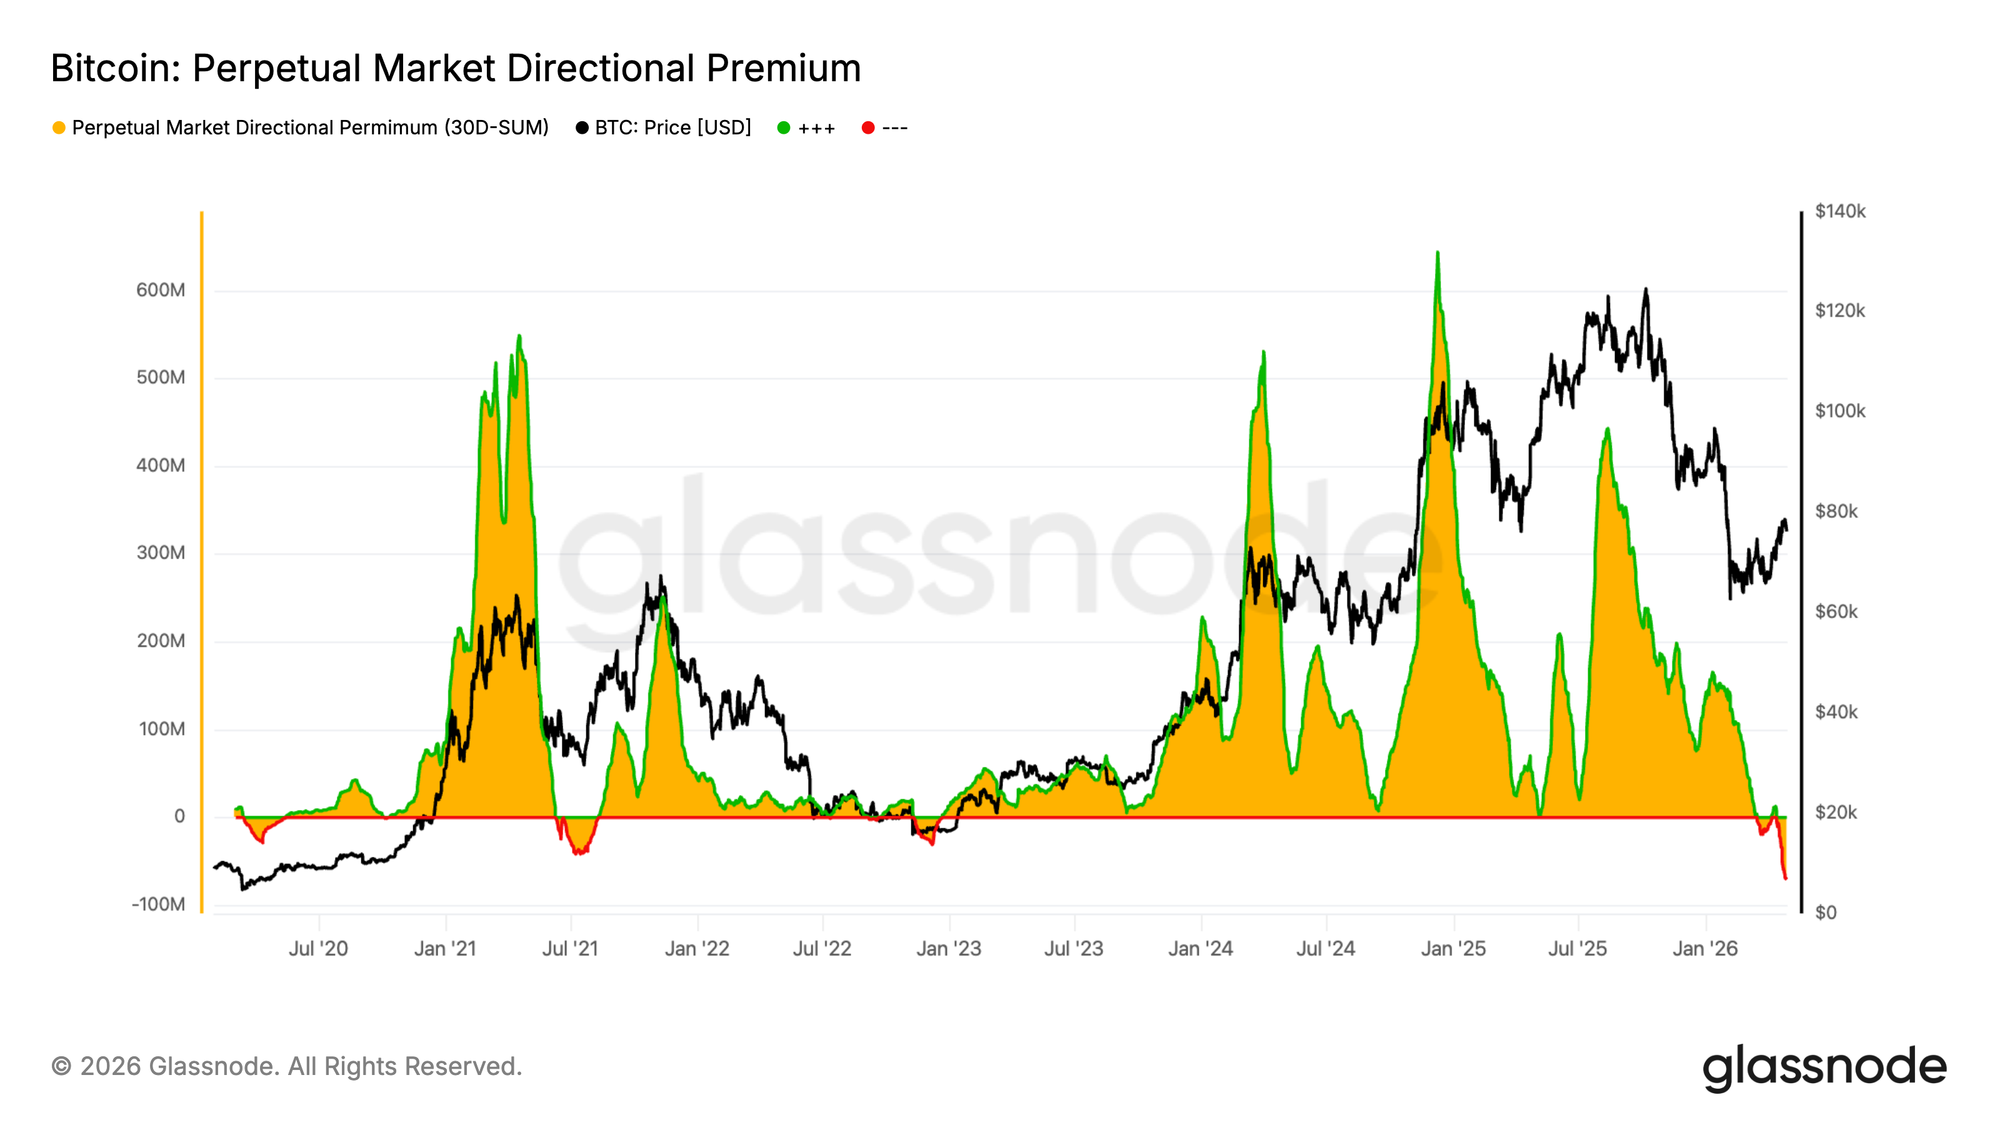
The Perpetual Market Directional Premium has dropped to its most negative level on record, marking the deepest sustained short bias in this dataset. Unlike prior cycles, where dips below zero were brief and tied to capitulation, this move reflects a more persistent defensive stance.

The extreme discount is driven by a combination of factors. Recent price weakness has triggered increased hedging and outright shorting in perp markets, while the unwind of previously crowded longs has accelerated the move via liquidations. At the same time, muted spot demand and softer ETF flows have reduced the natural bid, allowing derivatives to dominate short-term price action.

Historically, such extremes emerge during periods of elevated uncertainty and often precede inflection points. While near-term uncertainty remains, the market is increasingly positioned for a squeeze should sentiment or spot demand improve.
Live Chart

Implied Volatility Drifts Lower Across the Curve

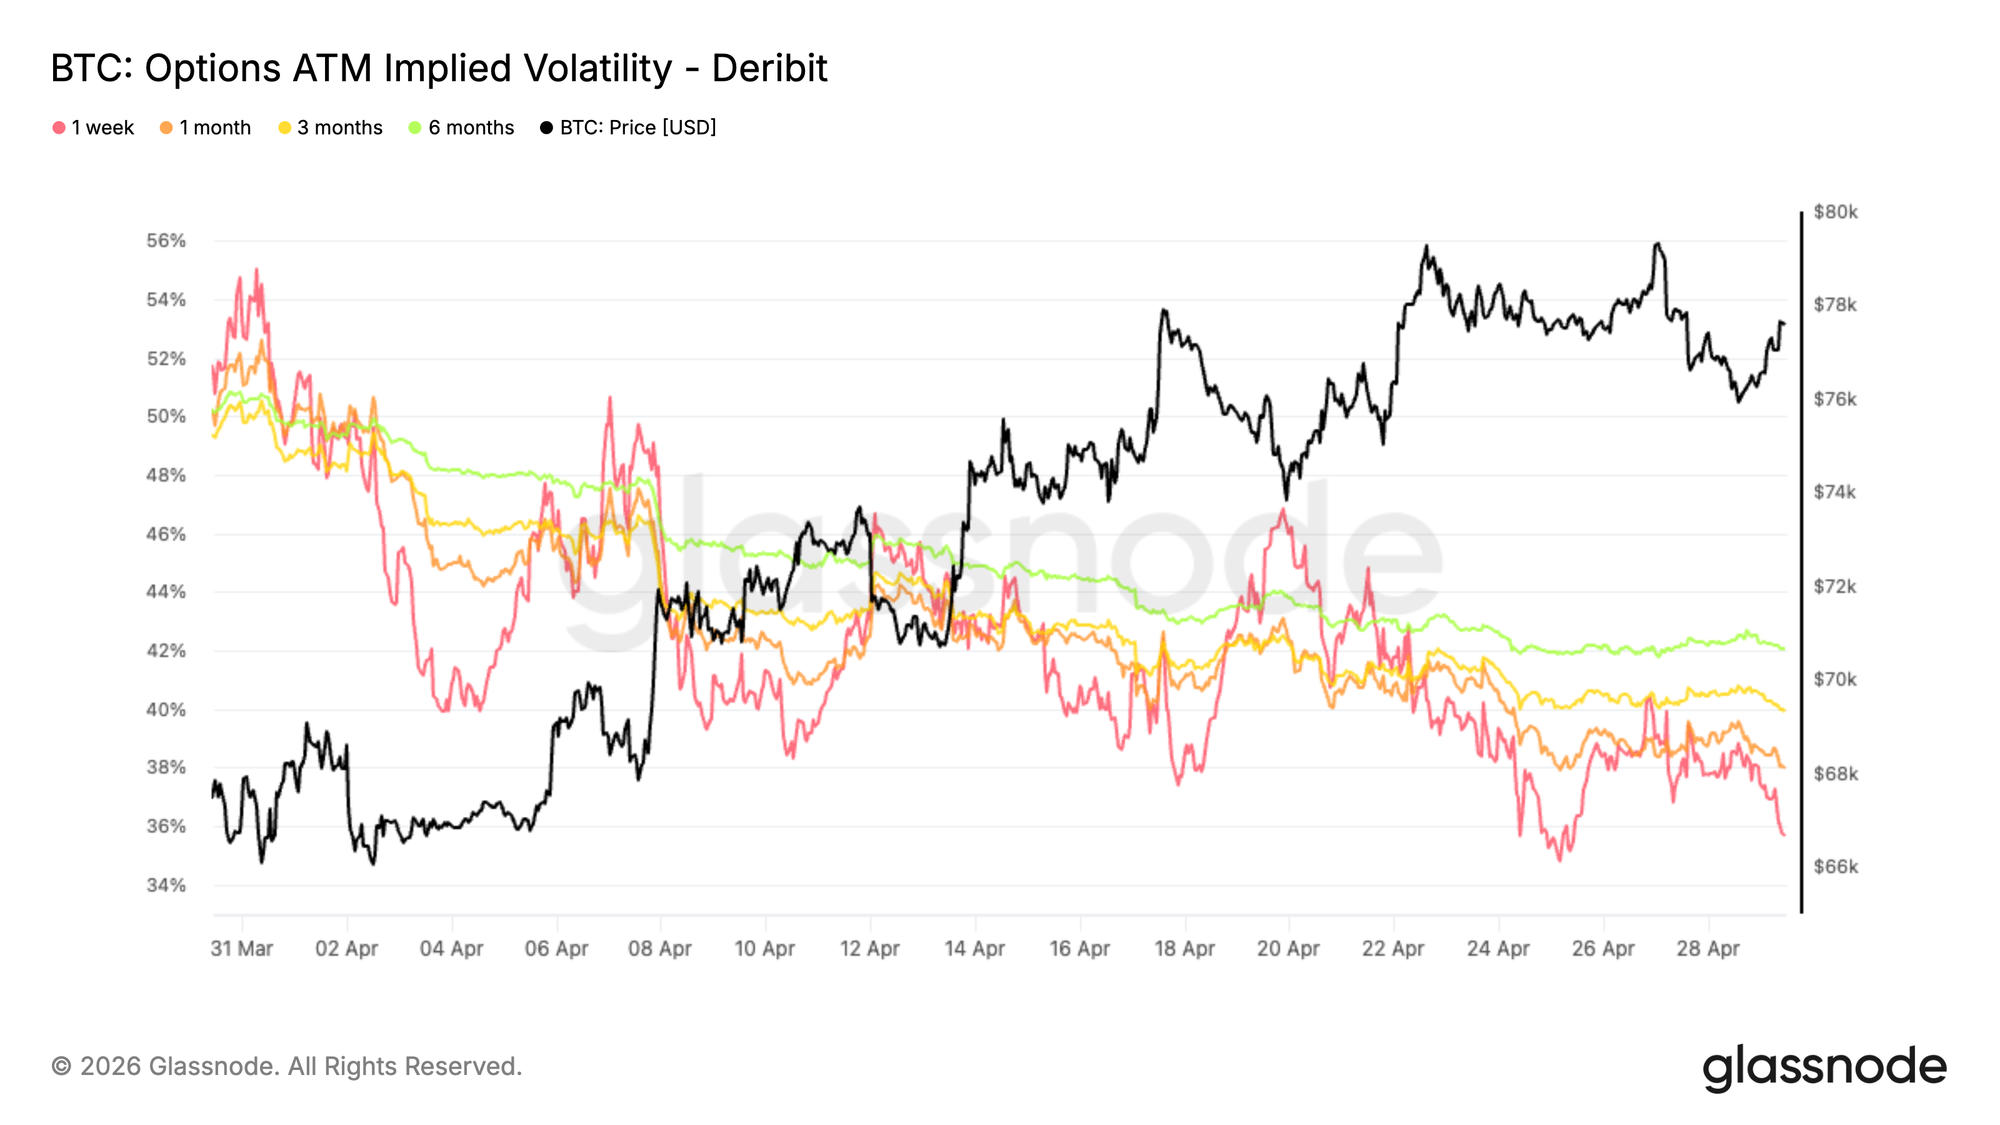
Looking back on April, starting with implied volatility, the dominant move has been a broad compression across maturities.

Volatility has declined by around 16 percentage points on the 1 week at the money, and roughly 8 points on the 6 month tenor. Other maturities sit within that range, with an average decline of about 10 volatility points.

The curve remains in contango, meaning longer dated options still trade at a premium to short dated ones, but at a lower level. This reflects a market pricing in a more stable environment ahead.

Lower implied volatility reduces the cost of optionality, particularly on the upside. At the same time, demand for protection appears to have eased. Traders are no longer willing to pay elevated premiums for volatility exposure, aligning with the recent price recovery and pointing to a normalization in expectations rather than a build up of conviction.
Live Chart

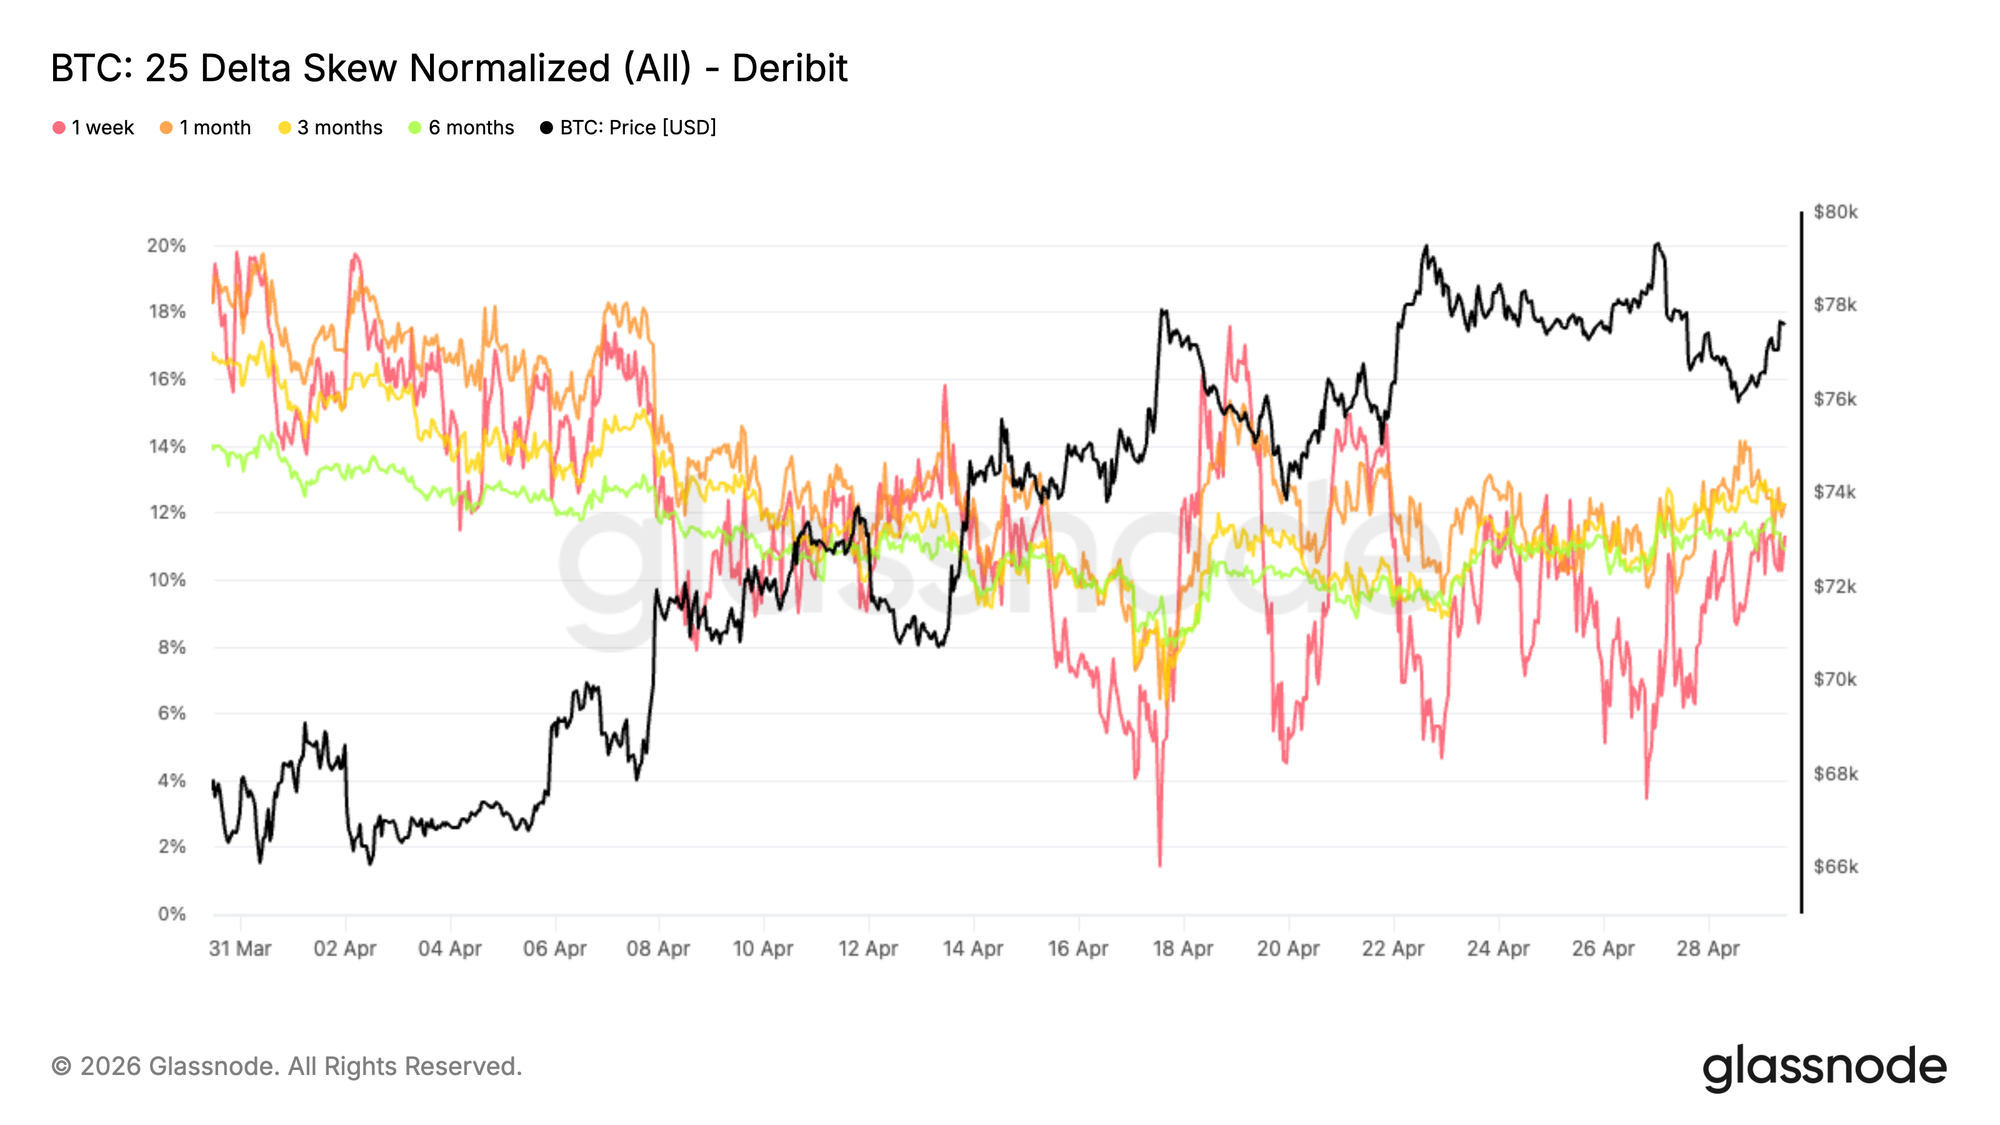
Following the compression in implied volatility, skew shows how demand evolved through April. The broader trend has been a steady decline in put premium, with the 1 month skew moving from around 18 percent to 12 percent. This reflects a clear reduction in demand for downside protection as conditions stabilized.

On the short end, the 1 week skew has been more reactive, with several spikes toward neutrality between 2 and 4 percent at multiple points throughout April. These moves were largely tactical, as pullbacks were used to buy calls and sell downside, temporarily flattening the skew.

More recently, as price approaches the 80K resistance, put demand has picked up again, pushing skew back toward the 11 to 12 percent range across maturities. Protection remains in place, with the market adjusting tactically in the short term while maintaining a cautious stance further out the curve.
Live Chart

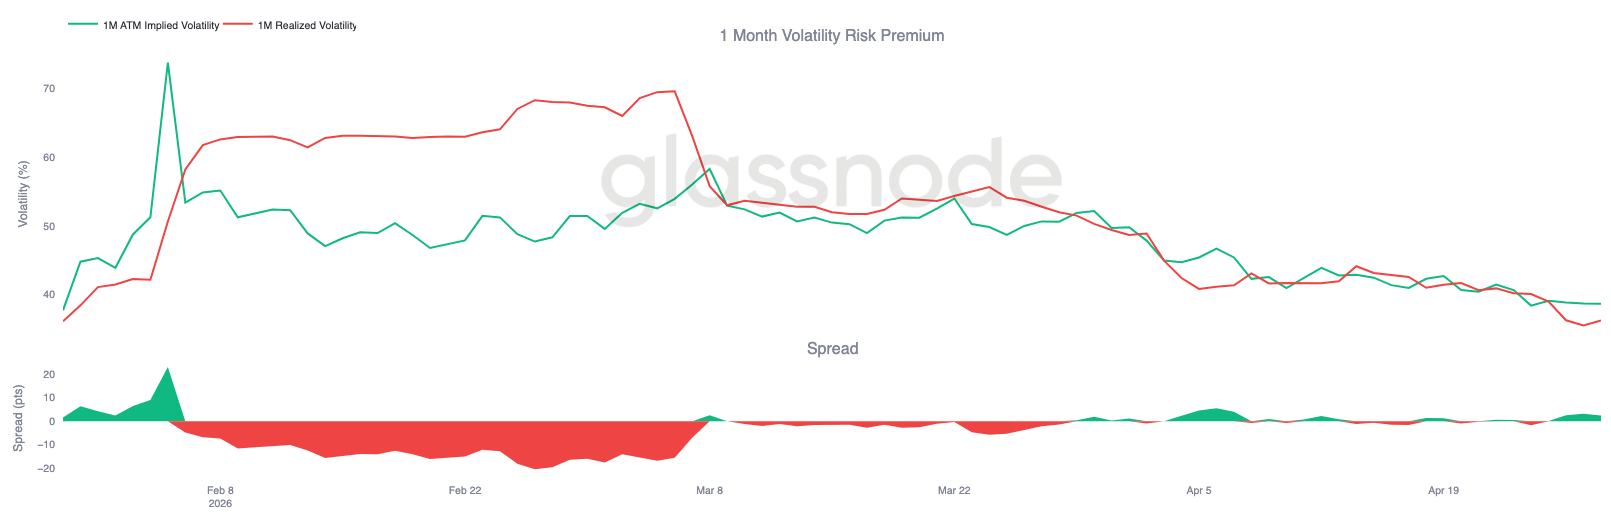
Realized Volatility Confirms the Shift Lower

As implied volatility continues to compress, realized volatility is moving in the same direction and reinforcing the trend. BTC has seen a steady decline in realized volatility. This alignment between implied and realized volatility matters, as it reduces the need for a meaningful volatility premium to compensate for uncertainty.

When realized volatility falls, it naturally pulls implied volatility lower, as the need to price in large price swings diminishes. This creates a feedback loop where cheaper options reduce the urgency to hedge, leading to less hedging-driven price movement.

The 1 month realized volatility sits around 36, while implied is near 38, leaving only a small premium for volatility sellers to earn for holding the risk.

The current environment reflects a transition away from stress toward a more balanced regime. Volatility is no longer being bid aggressively, and the market appears comfortable with a narrower range of expected price movement.
Live Chart

80K Strike Premium Builds Into a Key Pivot

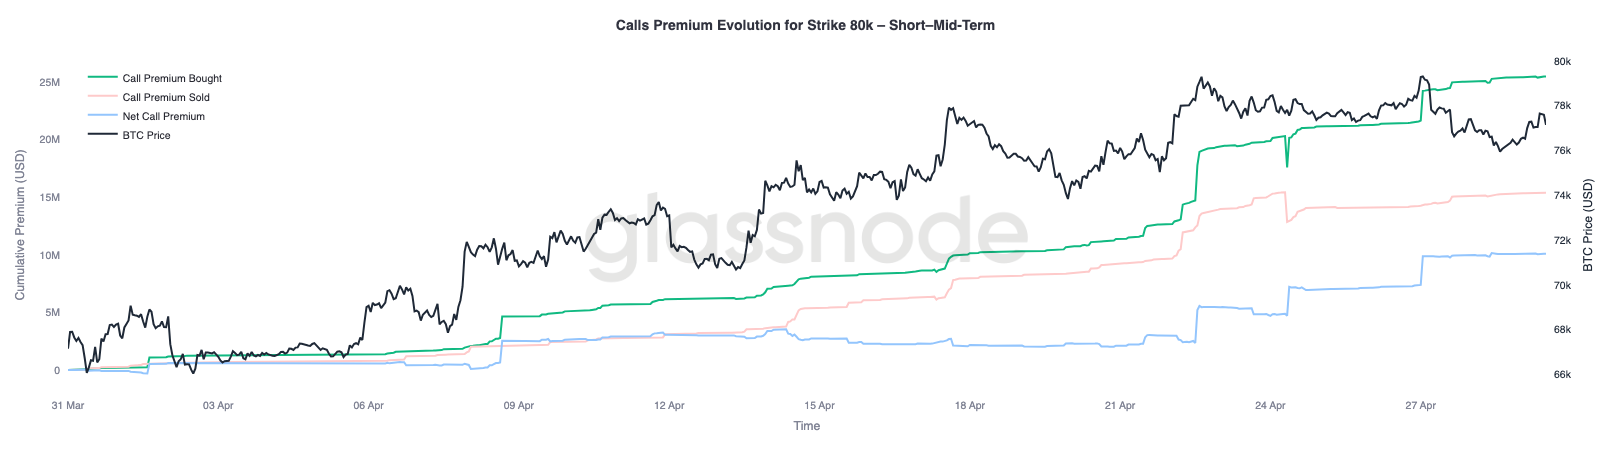
With volatility and skew both easing, positioning becomes the next layer to monitor, with the 80K level emerging as the next key focus.

Short and mid term maturities at the 80K strike are seeing sustained buying, indicating growing interest in upside exposure around this level. This suggests traders are positioning for a test of resistance rather than fading it.

At the same time, two key short gamma zones stand out, with 76K on the downside and 82K on the upside. These levels can act as areas where hedging flows amplify price action, especially in a low liquidity environment.

A break above 80K would bring spot closer to the 82K zone, where short gamma could force dealers to buy into strength, reinforcing the move. Positioning remains cautious, but increasingly exposed to a sharper upside reaction if resistance is cleared.
Live Chart

Conclusion

In sum, the market remains trapped below key resistance, with the True Market Mean continuing to cap upside attempts while support clusters near $65k–$70k provide a tentative floor. Spot selling pressure is beginning to ease and early signs of institutional re-engagement are emerging, but demand has yet to show the strength required for a sustained breakout.

At the same time, derivatives positioning has swung decisively bearish, with record net short exposure and elevated protection demand reflecting a defensive mindset. This leaves the market finely balanced. While the weight of positioning leans cautious, it also introduces the potential for sharp upside dislocations should flows turn.

Until a clear expansion in spot demand or institutional inflows materialises, the most likely outcome remains a choppy, range-bound environment. The next directional move will likely be driven not by positioning alone, but by whether real capital steps in to absorb supply and reclaim higher levels.


Disclaimer: This report does not provide any investment advice. All data is provided for informational and educational purposes only. No investment decision shall be based on the information provided here, and you are solely responsible for your own investment decisions.

Exchange balances presented are derived from Glassnode’s comprehensive database of address labels, which are amassed through both officially published exchange information and proprietary clustering algorithms. While we strive to ensure the utmost accuracy in representing exchange balances, it is important to note that these figures might not always encapsulate the entirety of an exchange’s reserves, particularly when exchanges refrain from disclosing their official addresses. We urge users to exercise caution and discretion when utilizing these metrics. Glassnode shall not be held responsible for any discrepancies or potential inaccuracies.


Perguntas relacionadas

QWhat were the key resistance levels that price failed to sustain above, leading to the recent rejection?

AThe price found rejection precisely within the zone of the True Market Mean at $78k and the Short-Term Holder Cost Basis at $79k, failing to sustain above these levels.

QWhat is the most immediate structural support level to monitor according to the report?

AFollowing the rejection, the mid-term bias tilts toward further downward pressure, and the most immediate structural support level to monitor is the -1 standard deviation band of the Short-Term Holder Cost Basis near $68k.

QHow did on-chain data confirm the nature of the rejection at the key resistance zone?

AOn-chain spending data, specifically the 24-hour SMA of Short-Term Holder Realized Profit, ramped to approximately $4M per hour as price approached $80k. This was roughly four times the base level, confirming that short-term holders used the rally as a distribution opportunity, and buy-side liquidity was insufficient to absorb this profit realization.

QWhat does the report indicate about the current state of institutional flows?

AThe report indicates that institutional positioning is beginning to stabilize, with early signs of recovery in CME Open Interest and US Spot ETF AUM. ETF position change has rebounded from negative levels, suggesting cautious re-accumulation and early-stage institutional re-entry, but not yet full conviction. Sustained inflows are needed for a stronger trend.

QWhat is the significance of the current record level of the Perpetual Market Directional Premium?

AThe Perpetual Market Directional Premium has dropped to its most negative level on record, marking the deepest sustained short bias. This reflects a persistent defensive stance driven by hedging, shorting, and the unwind of crowded longs. Historically, such extremes often precede inflection points, positioning the market for a potential squeeze if sentiment or spot demand improves.

Leituras Relacionadas

7 Months After the Collapse of Huiwang, Southeast Asia's Escrow Platforms Undergo a Major Reshuffle

Following the collapse of Huione Pay—dubbed the "Alipay of Southeast Asia"—seven months ago, the region's underground financial guarantee platform sector is undergoing a significant reshuffle. This power vacuum has been swiftly filled by emerging platforms such as XinBi, Tiger/Navigator, JinBei (renamed JinBo), Dali/Tiancheng, and FullyLight. These platforms, operating largely via Telegram and offering services like escrow for illicit transactions, have absorbed the vast user base and markets left behind by Huione. While positioning themselves as "trust intermediaries," their primary clientele consists of networks involved in online scams, money laundering, illegal gambling, and even human trafficking. For instance, the Tiger/Navigator platform explicitly provides "escrow" services for kidnapping-for-ransom operations ("强押车交易"). Data underscores the immense scale: Huione alone processed over $103 billion in cryptocurrency payments and facilitated over $31 billion through its escrow market before its downfall, linking it to Cambodia's notorious Prince Group. Since its collapse, competitors have seen explosive growth. For example, the XinBi platform has accumulated over $1.6 billion in total USDT revenue, while platforms like NewPay, OkPay (under Dali), and FullyLight Wallet collectively processed over $4.8 billion in USDT in a single year. This ecosystem thrives in regions like Cambodia and Myanmar, where regulatory gaps allow these platforms to act as critical financial infrastructure for sprawling cybercrime industries, from scam compounds to online casinos. The article concludes that the moniker "Southeast Asian Alipay" is a misnomer, obscuring the platforms' fundamental role in enabling serious criminal enterprises rather than representing legitimate financial innovation.

Odaily星球日报Há 32m

7 Months After the Collapse of Huiwang, Southeast Asia's Escrow Platforms Undergo a Major Reshuffle

Odaily星球日报Há 32m

The Changing Landscape: What Are Crypto VCs Experiencing?

Title: The Shifting Landscape of Crypto Venture Capital The era of dedicated crypto venture capital funds is undergoing a significant transformation. Once essential for navigating the sector's complexity and high risk, these specialized funds are now facing an identity crisis as the market matures. This shift mirrors historical patterns in other specialized investment classes like cleantech and SPACs, where initial information advantages dissipate as technologies become mainstream and integrated into existing industry frameworks. The article argues that crypto is reaching a critical inflection point, transitioning from a "building phase" to an "integration phase." Major players like Stripe, BlackRock, and Visa now engage with crypto not for its novel mechanics but as a foundational financial infrastructure. Their needs—regulatory compliance, banking partnerships, distribution channels—align with traditional fintech, a domain easily understood by large, generalist funds like Sequoia and Founders Fund. This evolution creates a "barbell effect" within the VC landscape. On one end are massive, diversified platforms that can incorporate crypto as one vertical among many. On the other are small, nimble funds focused on niche, experimental projects. The middle ground—medium-sized dedicated crypto funds—is being squeezed out. Their typical fund size makes it impossible to generate sufficient returns solely from early-stage crypto bets, yet they cannot compete with giants for later-stage deals. Consequently, leading crypto-native firms like Paradigm and Framework Ventures are expanding into AI, robotics, and other sectors, driven partly by LP pressure for better returns amid a broader VC DPI crisis. Others, like Dragonfly and a16z, have narrowed their crypto focus predominantly to financial infrastructure like stablecoins, reframing the sector's core narrative. For crypto entrepreneurs, this consolidation presents challenges. While generalist funds offer larger checks and broader resources, crypto projects now compete fiercely with AI for attention and capital within these firms. Furthermore, the long-term, non-commercial foundational work that built the ecosystem—funded by dedicated crypto VCs—is less likely to attract generalist capital focused on direct returns. The conclusion is that "crypto investor" as a standalone category is becoming obsolete, akin to "internet investor." Crypto is becoming a baseline infrastructure layer. The future will see a barbell structure: large-scale growth financing handled by generalist funds, while pioneering, speculative projects are funded by small, specialized vehicles. The dedicated crypto funds of the 2017-2021 boom, which incubated core infrastructure, are giving way to this new, bifurcated reality.

Foresight NewsHá 49m

The Changing Landscape: What Are Crypto VCs Experiencing?

Foresight NewsHá 49m

As Consensus Accelerates, What Are Young Investors Betting On?

Title: As Consensus Forms Faster, What Are Young Investors Betting On? In the rapid evolution of tech investment, a new generation of young investors is navigating a landscape where AI, robotics, commercial aerospace, and quantum computing are advancing simultaneously. Traditional investment logic based on financial models is giving way to a need for deep technical understanding and the ability to act before industry consensus forms. An analysis of trends from the "WAIC FUTURE TECH" list of young investment leaders reveals key shifts in focus. The first major trend is the movement of AI from the digital screen into the physical world. Investment is shifting from large language models and chatbots towards embodied AI, robotics, AI hardware, and edge computing. While demonstrations generate excitement, the real challenge lies in achieving scalable, reliable, and cost-effective delivery in complex real-world environments like factories and logistics. Success depends not just on algorithms but on the integration of sensors, actuators, and control systems. Second, the competitive focus for large models is moving beyond raw capability toward building an "intelligence flywheel." The goal is to create self-reinforcing systems where user interaction generates data, improving the model, which in turn enhances the user experience and attracts more engagement. Companies that successfully embed AI into workflows to create these closed-loop systems can build lasting value that isn't easily erased by the next model upgrade. Third, facing a potential bottleneck in high-quality human-generated data, investors are looking at new underlying technologies. Reinforcement learning and self-play, as demonstrated by AlphaGo Zero, offer paths for AI to generate its own experience. Scientific foundation models, which aim to build general AI capabilities for fields like life sciences and materials discovery, represent a non-consensus direction that could unlock new frontiers of knowledge and data. Finally, in deep-tech areas like quantum computing, commercial aerospace, and space-based infrastructure, patient capital is essential. These fields have long, uncertain development and validation cycles involving complex engineering, supply chains, and regulations. Investment here requires a long-term view, focusing on foundational team capabilities and the eventual emergence of market demand, even if commercial returns are distant. Collectively, these trends illustrate how young investors are adapting to a new era. They are learning to make earlier, technically-informed judgments, balance hype with real-world viability, and provide the patient capital needed to build the deep-tech foundations of the future.

marsbitHá 1h

As Consensus Accelerates, What Are Young Investors Betting On?

marsbitHá 1h

Trading

Spot
活动图片