The 'True and False Prosperity' of Perpetual Contracts: Have You Seen Through It?

比推Publicado em 2026-02-11Última atualização em 2026-02-11

Resumo

The article "Perpetual Contracts: Real or Illusory Boom?" examines the explosive growth of perpetual futures (perps) markets, arguing that trading volume alone is a misleading metric. While perps have become dominant—growing from 44% to 75% of DEX spot volume since February 2025—this surge doesn't necessarily reflect meaningful capital deployment. Key insights include: - Total perp volume doubled to $14 trillion in just six months, even as crypto market cap fell 40%. - Open Interest (OI), which measures unrealized risk exposure, only grew ~50% in that period, indicating much of the volume is from rapid capital recycling rather than new committed capital. - The OI/Volume ratio (a measure of capital efficiency) rose from 0.33x to 0.49x over the past year, but with significant volatility, including a sharp drop after a major liquidation event in October. - Protocol-level analysis shows Hyperliquid leads in capital efficiency (OI/Vol >45%) and fee generation (~3.2 bps take rate), while others like Aster prioritize capital retention over fees. The conclusion: True market health is best read by combining volume with OI and fee data. Sustainable platforms will be those that optimize for "conviction" (long-term capital) rather than just incentivized volume.

Author: Prathik Desai

Original Title: Reading Perps Beyond Volume

Compiled and Edited by: BitpushNews


Just when you think finance is getting boring, it always has a way of surprising you. Lately, it seems like everyone is restructuring the financial system in ways few foresaw, even those from the entertainment and media industries.

Take Jimmy Donaldson (aka "MrBeast" on YouTube) for example. He not only has a snack empire but also acquired a banking app recently, aiming to promote financial literacy and money management among teenagers and young adults. Why? Perhaps nothing is more direct than monetizing his 466 million subscriber base with financial products.

This summer, the CME Group, the world's largest derivatives exchange, will launch single-stock futures, allowing users to trade futures on over 50 top U.S. stocks including Alphabet, NVIDIA, Tesla, and Meta.

These restructurings show us how people's ways of engaging with finance are changing. And nothing illustrates this better than the explosion of the Perpetual Markets (Perps) market over the past few years.

Perpetual Futures (or Perps) are a type of financial derivative contract that allows market participants to speculate on the price of an asset without an expiration date. Perps also allow people to express views on assets quickly and cheaply. They are more captivating than traditional markets because they offer instant access and leverage. Unlike traditional markets, they don't require broker onboarding processes, jurisdictional paperwork, or follow "traditional" market hours.

Furthermore, on-chain perpetual markets allow any asset (whether traditional or crypto) to be traded in a permissionless, highly leveraged manner. This makes speculation fun, especially when humans can't resist博弈 the trajectory of volatile assets outside traditional trading hours. This allows risk to be priced in real-time.

Think about what happened two weeks ago. When traditional and crypto markets crashed simultaneously, traders flocked to Hyperliquid, driving perpetual gold and silver trading into a frenzy. On January 31st, Hyperliquid alone accounted for 2% of the global daily trading volume in its Silver perpetual contract market, which had been live for less than a month.

This explains why dashboards of perpetual contract trading volume are increasingly dominating crypto communities and forums. Volume is an absolute value. It looks large, refreshes every few minutes, and is perfect for leaderboards. But it misses a key nuance: volume might reflect movement that lacks meaning. A market's high volume could be due to depth, but it could also be due to rewards and incentives encouraging higher frequency activity. This activity is often recursive and not very meaningful.

This week, I delved into other metrics of the perpetual trading market. When used in conjunction with volume, these metrics add more dimensions and tell a completely different story than volume alone.

Let's begin.

A Few Data Points

The user-friendly interface of perpetual markets makes them a low-barrier, default interface for expressing views across various markets and global assets. The wide selection of highly leveraged derivative trading on both traditional and crypto assets on a single platform has led to perpetual contract volumes surpassing spot trading volumes on decentralized exchanges. From 44% in February 2025, the share of perpetual contract volume has soared to around 75% today (relative to spot volume).

This growth has been particularly pronounced in the past few months:

  • As of July 31, 2025, the four-year cumulative perpetual trading volume across all platforms was $6.91 trillion.

  • In just the past six months, this volume has doubled, reaching $14 trillion.
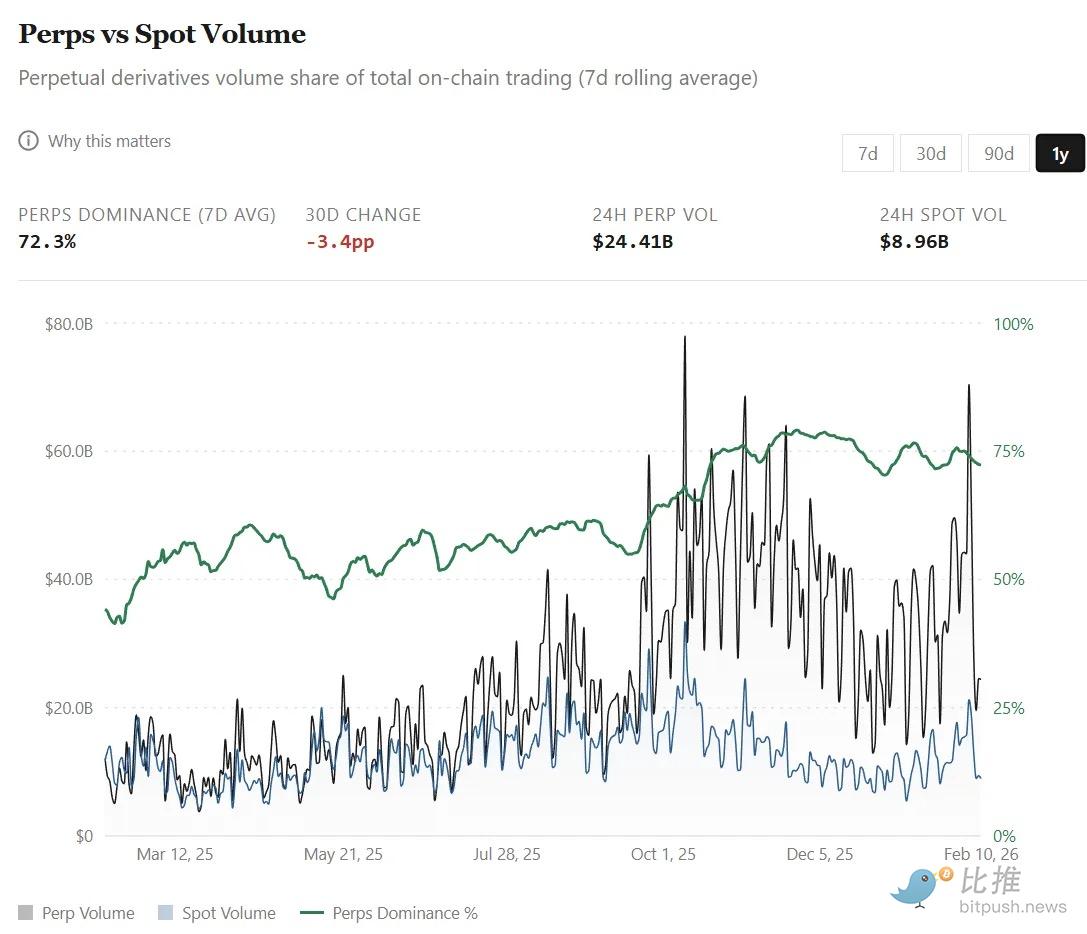
All this growth occurred against the backdrop of the total cryptocurrency market capitalization shrinking by nearly 40% between August 1, 2025, and February 9, 2026. This activity suggests traders are increasingly leaning towards derivative trading, hedging, and short-term positioning, especially when spot markets become highly volatile and bearish.

But there's a catch. With such massive activity, it's easy to misread volume metrics. Especially because perpetual trading isn't just about buying and holding assets long-term; it involves repeatedly adjusting bet sizes using leverage over shorter time frames.

So, when market turnover speeds up, a question inevitably arises: Do record-breaking volumes reflect more capital flowing in, or the same capital cycling faster?

This is where observing Open Interest (OI) becomes meaningful. If volume reflects capital flow, then OI measures outstanding risk exposure. On perpetual exchanges, OI refers to the total dollar value of active, unsettled long and short contracts held by traders.
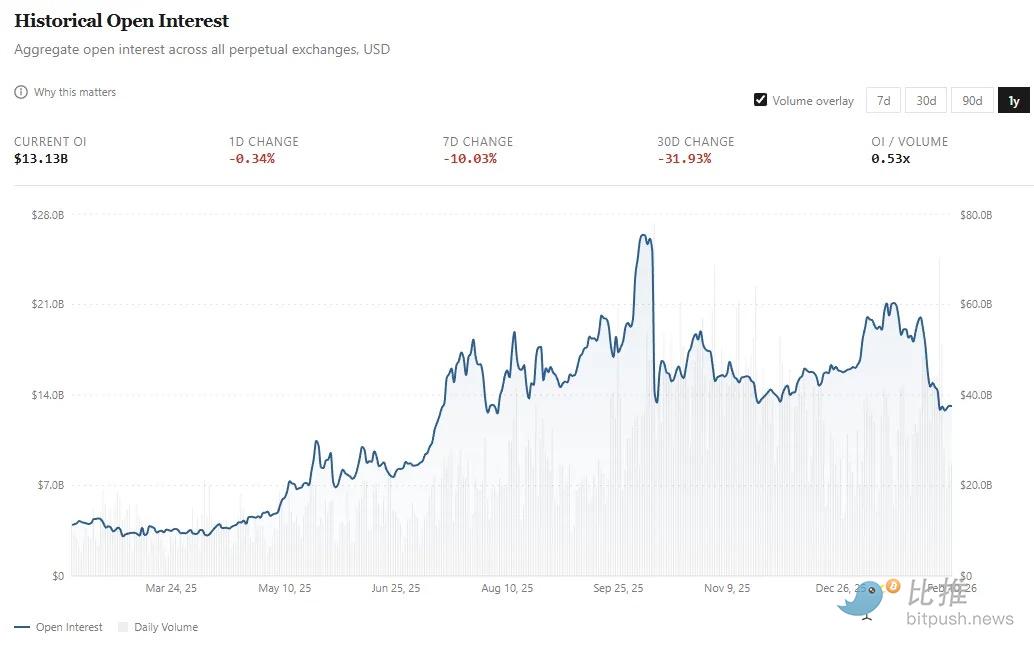
If perpetual trading is being adopted by the mass market, we would hope to see not only larger capital flows but also proportionally growing outstanding exposure.

  • Last February, OI averaged around $4 billion;

  • Now that number has more than tripled, to around $13 billion. In fact, the average for the entire month of January was around $18 billion before dropping about 30% in the first week of February.

While perpetual trading volume doubled in the past five months, OI grew by about 50% (from $13B to ~$18B, then back to ~$13B). To better understand this, I looked at the trend of Capital Efficiency (i.e., OI as a percentage of daily volume) over the past year.
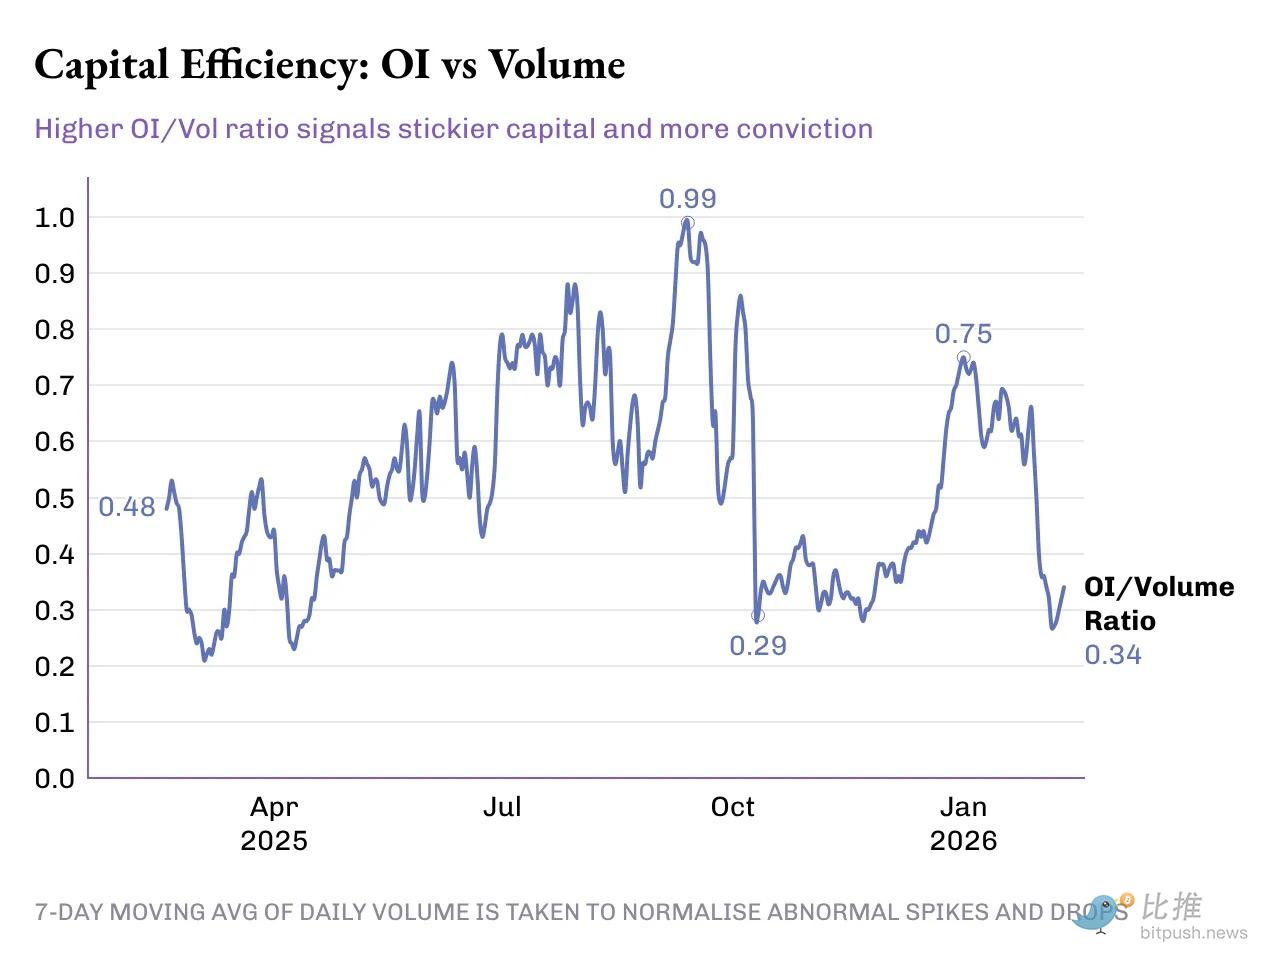
The OI/Volume ratio jumped 50% from 0.33x last year to 0.49x today. But this progress wasn't smooth; the 50 basis point growth in this ratio went through multiple peaks and troughs:

  1. Phase 1 (Feb-May 2025): Dormancy. The OI/Volume ratio averaged ~0.46x, with average OI of ~$4.8B and average daily volume of ~$11.5B.

  2. Phase 2 (June - Mid-Oct): Leap. The ratio averaged ~0.72x. During this period, average OI rose to $14.8B, and average daily volume was $23B. This marked not only record volume but also increased risk exposure and greater capital commitment to these derivatives.

  3. Phase 3: Market Reversal. This phase began around the massive liquidation on October 10th, which wiped out over $19B in leveraged positions within 24 hours. From mid-October to late December, the OI/Volume ratio fell to ~0.38x, driven primarily by volume growth while open interest largely stagnated. October, November, and December saw the highest three-month trading volumes of 2025, averaging over $1.2 trillion per month. Over the same period, OI averaged around $15B, slightly below the previous three-month average.

Protocol Level

Here, I want to add more dimensions at the protocol level for perpetual markets. This helps us understand how efficiently perpetual exchanges convert trading activity into "sticky capital" and revenue.

As of February 10th, here's how the top 5 perpetual exchanges by 24-hour volume performed:

  • Hyperliquid: Its OI to 7-day average daily volume ratio exceeds 45%, able to convert a large share of volume into lasting positions. This indicates that for every $10 traded on the platform, $4.5 is投入 (invested) in active positions. This is important because high OI rates lead to narrower spreads, deeper liquidity, and confidence in scaling trades without slippage.

    • Hyperliquid's fee revenue reinforces this story. Its Take Rate is ~3.2 basis points (bps), converting the largest share of 24-hour volume into fee income.

  • Aster: Currently ranked second, it maintains a decent capital efficiency (OI/Vol) of 34%, despite having almost half the volume of Hyperliquid. However, its monetization capability is notable – with a lower take rate (~1.6 bps), Aster clearly prioritizes capital retention on its platform over fee revenue maximization.
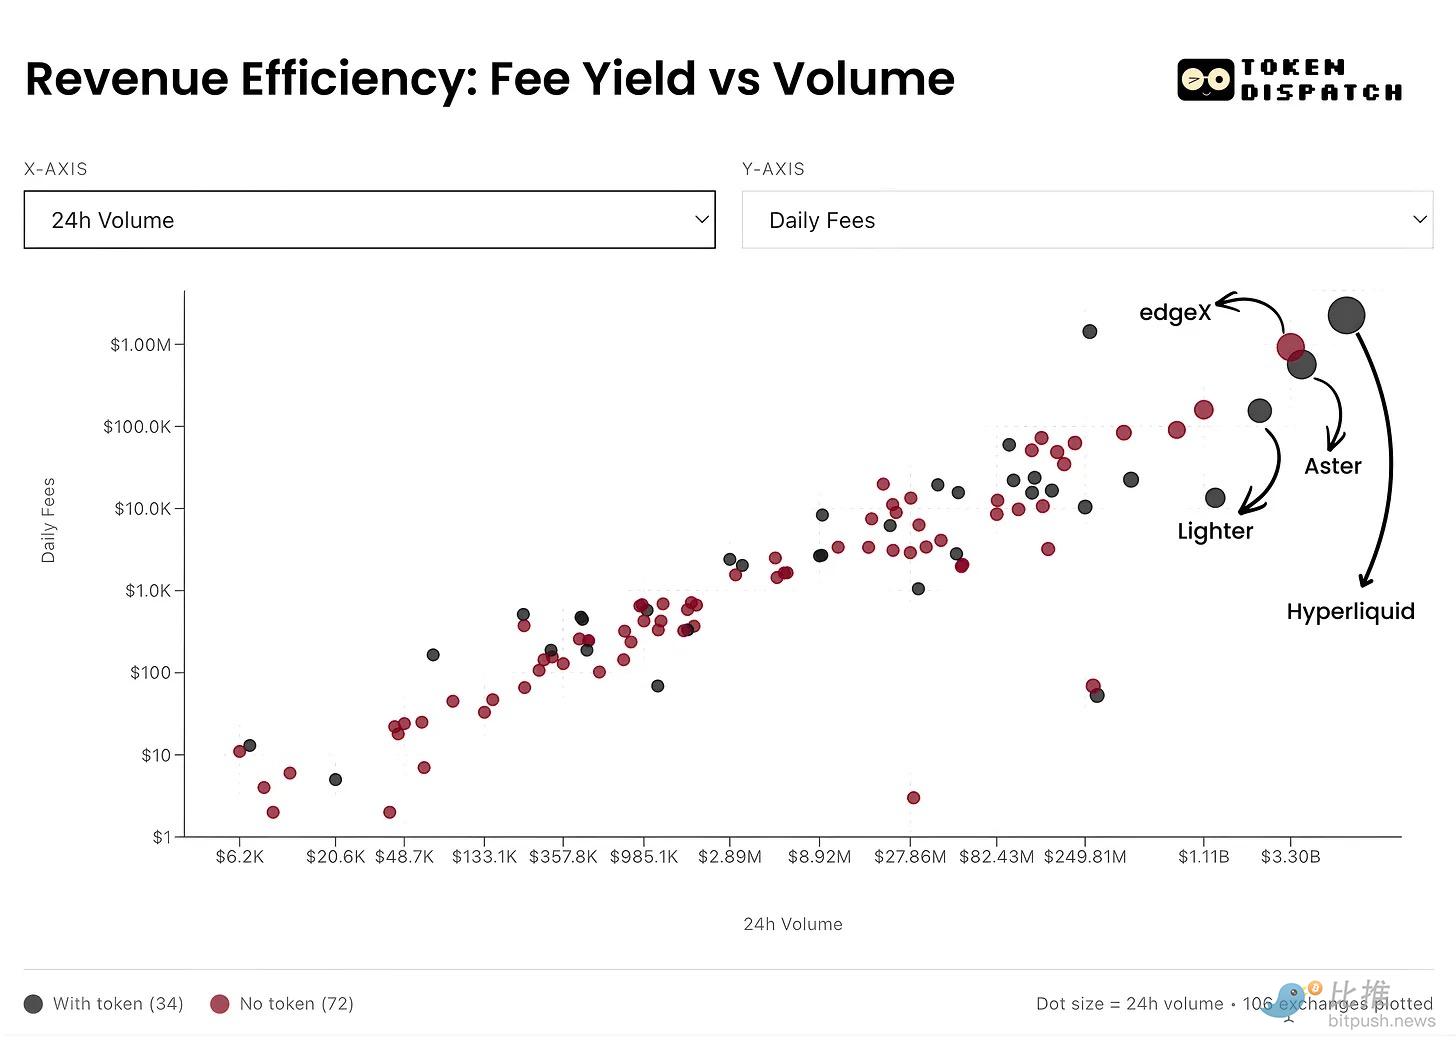

  • edgeX & Lighter: Both perform similarly on the capital efficiency ladder, with OI/Vol at 21%. However, edgeX's fee monetization is comparable to Hyperliquid's at 2.8 bps.

Summary

It's remarkable that the perpetual contract market today is no longer a simple growth story; it requires a nuanced reading of multiple metrics. At the macro level, volume has exploded: the growth in cumulative perpetual trading volume in six months exceeded the total of the previous four years. But the picture only becomes clear when OI and volume are read together.

A clearer victory lies in the growth of the OI/Volume ratio. This is a direct signal that "patient capital" is willing to trust and bet on the various products and markets emerging on perpetual trading exchanges.

What's even more值得关注 (worth watching) in the future is how individual players will evolve from here and what they choose to optimize. Over time, exchanges that can optimize for "Conviction" and achieve sustainable monetization will be far more important than those that merely rely on rewards and incentives to dominate volume leaderboards.


Twitter:https://twitter.com/BitpushNewsCN

Bitpush TG Discussion Group:https://t.me/BitPushCommunity

Bitpush TG Subscription: https://t.me/bitpush

Original article link:https://www.bitpush.news/articles/7611212

Perguntas relacionadas

QWhat are perpetual futures (Perps) and how do they differ from traditional futures contracts?

APerpetual futures (Perps) are financial derivative contracts that allow market participants to speculate on the price of an asset without an expiration date. Unlike traditional futures, they do not require broker onboarding, jurisdictional paperwork, and are not bound by traditional market hours. They also provide instant access and leverage, enabling fast and cheap expression of views on assets.

QAccording to the article, what key metric should be observed alongside trading volume to better understand the health of the perpetuals market?

AThe article states that Open Interest (OI) should be observed alongside trading volume. While volume reflects capital flow, OI measures the amount of outstanding, unsettled risk exposure (the total dollar value of active long and short contracts).

QWhat significant event in October 2025 caused a major shift in the OI/Volume ratio, and what was the consequence?

AA massive liquidation event on October 10, 2025, wiped out over $19 billion in leveraged positions within 24 hours. This event marked the start of a phase where the OI/Volume ratio dropped to ~0.38x, driven by growth in trading volume while open interest largely stagnated.

QWhich perpetual exchange, as of February 10th, had the highest capital efficiency (OI/Volume ratio) and what was its approximate ratio?

AAs of February 10th, Hyperliquid had the highest capital efficiency with an OI to 7-day average daily volume ratio of over 45%.

QWhat does the article suggest is a more important long-term goal for perpetual exchanges than simply topping volume leaderboards?

AThe article suggests that a more important long-term goal is for exchanges to optimize for 'trading conviction' and achieve sustainable monetization, rather than just relying on rewards and incentives to dominate volume rankings.

Leituras Relacionadas

Six Years Later, UNI Finally Welcomes Its Own "Buyback Bull"

After years of debate, Uniswap's UNI token has finally entered a 'buyback bull' phase following the long-awaited activation of its fee-switch mechanism. The UNIfication proposal, executed in December 2025, redirected a portion of protocol fees from select pools and Unichain sequencer revenue into a treasury (TokenJar) dedicated to buying back and permanently burning UNI. Initial market reaction was muted due to modest early burn rates. A significant shift occurred in July 2026 with the launch of Robinhood Chain. Uniswap's immediate deployment there skyrocketed trading volume, making it a top fee-generator. Subsequently, governance votes extended the fee mechanism to v4 pools and Robinhood Chain, causing protocol revenue to nearly triple. Daily funds directed to UNI burns rose sharply, with Robinhood Chain contributing over half. This transitioned UNI's narrative from a governance token to a cash-flow asset backed by a perpetual automatic buyer. UNI's price, which had languished around $2.30 in early June, nearly doubled to approach $4.60 by late July. Analysts credit this to the tangible cash flow from fees rather than mere speculation. Unlike many newer projects where buybacks are offset by large investor unlocks, UNI's six-year history has resulted in a widely distributed and relatively clean supply, allowing the buyback pressure to effectively impact the secondary market. The key test will be whether trading activity, particularly on Robinhood Chain, sustains after its initial gas subsidies expire.

marsbitHá 3m

Six Years Later, UNI Finally Welcomes Its Own "Buyback Bull"

marsbitHá 3m

Only 153 Venture Capital Firms Invested in July: Is the Crypto VC Industry Experiencing a 'Mass Extinction'?

In July 2026, only 153 unique venture capital firms participated in disclosed crypto funding rounds, marking the lowest monthly count since November 2020. This figure represents an 87% decline from the peak of 1,177 firms in 2022. Overall, the first seven months of 2026 saw crypto projects raise approximately $11.78 billion across 481 rounds. This crypto VC contraction contrasts sharply with the broader venture capital landscape, where global VC investment reached a record $560.4 billion in H1 2026, heavily fueled by major AI company financings. This shift in capital allocation has drawn funds away from the crypto sector. Within crypto, funding is highly concentrated. Trading platforms, prediction markets, and payment sectors absorbed 53% of the total capital. While early-stage deals remain frequent, the largest sums flow to a few late-stage rounds and mergers & acquisitions, which surged to $7.23 billion in Q2 2026. The market is consolidating around top funds like a16z crypto and Dragonfly, which successfully raised new multi-billion dollar funds, while many smaller firms have retreated. Analysts describe this as a "great extinction" for crypto VCs, where capital is becoming more selective, favoring proven business models and assets over early-stage speculation. This raises the bar for project quality, funding efficiency, and viable exit paths.

marsbitHá 23m

Only 153 Venture Capital Firms Invested in July: Is the Crypto VC Industry Experiencing a 'Mass Extinction'?

marsbitHá 23m

Strategy's Loss in the Second Quarter Reaches $8.22 Billion Amid Bitcoin Decline

Strategy, the largest corporate holder of Bitcoin, reported a net loss of $8.22 billion for the second quarter. This loss was primarily driven by an $8.32 billion unrealized loss on its Bitcoin holdings due to a decline in the asset's price during the period. Despite these paper losses, the company increased its Bitcoin holdings to 843,775 BTC, a 25% growth since the start of the year. As part of a new monetization strategy, Strategy sold approximately $218.4 million worth of Bitcoin, mainly to fund dividends for preferred shareholders, with $216 million of that sold after Q2 ended. The company also built a $3.75 billion cash reserve, which it claims is sufficient to cover over two years of dividend and interest payments, aiming to insulate itself from Bitcoin's volatility while meeting obligations. Following the earnings release, Strategy's stock (MSTR) rose 4.7% in regular trading but corrected slightly after-hours. This pattern reflects how the company's accounting results are heavily tied to Bitcoin's price swings, even as its long-term strategy remains unchanged. The report indicates that Strategy is maintaining its core strategy of accumulating Bitcoin while building a financial buffer. This quarterly loss follows a recognizable pattern, with the company posting significant unrealized losses in previous quarters (e.g., $12.4 billion in Q4 2025 and ~$12.5 billion in Q1 2026) due to fair-value accounting. A key technical shift is its new monetization program, which introduces periodic selling pressure on the market, transitioning Strategy from a pure accumulator to a participant that occasionally adds supply. A critical question remains: how long can the cash reserve cover dividend obligations if a Bitcoin price downturn persists beyond two years?

cryptonews.ruHá 43m

Strategy's Loss in the Second Quarter Reaches $8.22 Billion Amid Bitcoin Decline

cryptonews.ruHá 43m

Will Terrorist Durov Ban Russian Officials?

Telegram founder Pavel Durov publicly reacted to being labeled a "terrorist" by Russian authorities, stating the designation came after he refused demands for mass surveillance and censorship on the platform. In a Telegram post, he highlighted that this status formally bans him from "publishing information online." Durov concluded with a statement widely circulated: Russian officials "clearly don't understand who can ban whom on the internet." This remark suggests Durov could potentially restrict official Russian government and officials' channels on Telegram, which continue to operate on the platform despite its formal blocking in Russia. The situation parallels previous, slow-moving state directives, like switching officials to domestic cars, contrasted with the current push to migrate all government communication to the Russian-made messenger MAX by 2030. However, reports indicate many officials still use Telegram via workarounds, fearing surveillance on MAX, while alternatives like BiP and KakaoTalk recently became inaccessible in Russia without a VPN. Durov has not specified any immediate actions against state channels. His statement is an initial response, with further developments depending on the authorities' reaction. The dynamic differs from 2020 when Russian regulators lifted a block on Telegram; now, Durov implies control from within the platform itself over the official accounts that persisted through that earlier blockade.

cryptonews.ruHá 43m

Will Terrorist Durov Ban Russian Officials?

cryptonews.ruHá 43m

Trading

Spot
活动图片