The Most Crowded Short in History Is Paving the Way for a Bull Market in U.S. Bonds

marsbitPublicado em 2026-01-20Última atualização em 2026-01-20

Resumo

An experienced macro trader presents a contrarian thesis that 2026 will be the "year of the bond," with long-duration U.S. Treasuries (TLT/TMF) poised to outperform stocks. The core argument is built on several pillars: gold's 200% rally historically signals deflationary risk, not sustained inflation; the U.S. faces a crushing $1.2 trillion annual interest bill, creating a fiscal doom loop; Treasury issuance is dangerously short-term, amplifying refinancing risk; and long bond short interest is at extreme, crowded levels. Additional factors include cooling inflation, weak economic indicators, deflationary trade war risks, and the high probability of Fed intervention (QE/Yield Curve Control) to lower long-term yields if stress emerges. The trade offers asymmetric upside: TLT yields ~4.5% while waiting, and a 200bps drop in yields could trigger a 35-45%+ price surge, accelerated by a short squeeze. The author has allocated 60% of their portfolio to this thesis, betting on a policy and macro regime shift.

Author: Common Sense Investor (CSI)

Compiled by: Deep Tide TechFlow

Deep Tide Guide: With the dramatic changes in the macroeconomic environment in 2026, market logic is undergoing a profound shift. Veteran macro trader Common Sense Investor (CSI) presents a contrarian view: 2026 will be the year bonds outperform stocks.

Based on the U.S. government's heavy interest payment pressure, the deflationary signals released by gold, the extremely crowded bond short positions, and the imminent trade conflicts, the author believes that long-duration U.S. Treasuries (such as TLT) are at an inflection point with an "asymmetric game" advantage.

At a time when the market generally considers bonds "uninvestable," this article, through rigorous macro mathematical deduction, reveals why long bonds could become the highest-returning asset in 2026.

The main text is as follows:

Why I Am Overweight TLT and TMF — and Why Stocks Will Underperform in 2026

I do not write these words lightly: 2026 is destined to be the year bonds outperform stocks. This is not because bonds are "safe," but because macro mathematics, positioning, and policy constraints are converging in an unprecedented way—and this situation rarely ends with "Higher for Longer."

I have put my money where my mouth is.

TLT (20+ Year Treasury ETF) and TMF (3x Leveraged Long 20+ Year Treasury ETF) currently make up about 60% of my investment portfolio. This article compiles data from my recent posts, adds new macro context, and outlines a bullish scenario for long-duration bonds, especially TLT.

Core Arguments at a Glance:

  • Gold's Movement: Gold's historical performance does not signal sustained inflation—it signals deflation/deflation risk.

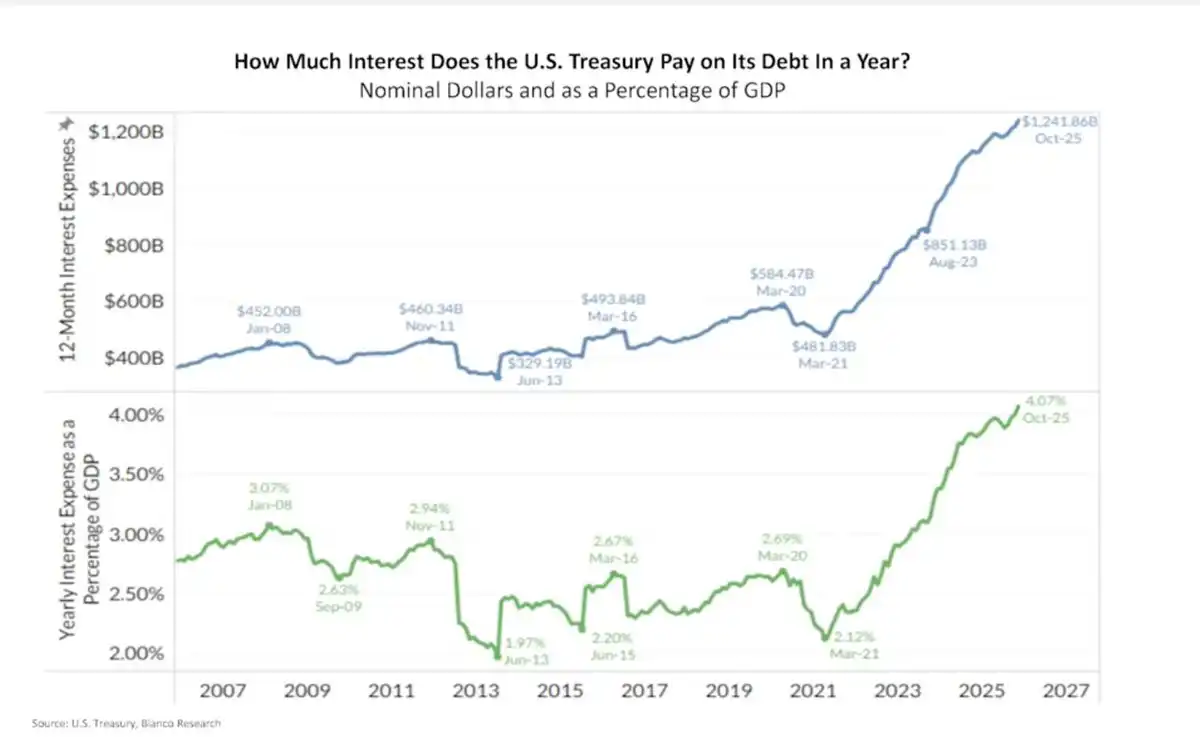
  • Fiscal Deficit: U.S. fiscal math is collapsing: approximately $1.2 trillion in annual interest expenses, and rising.

  • Issuance Structure: Treasury bond issuance is skewed short-term, quietly increasing systemic refinancing risk.

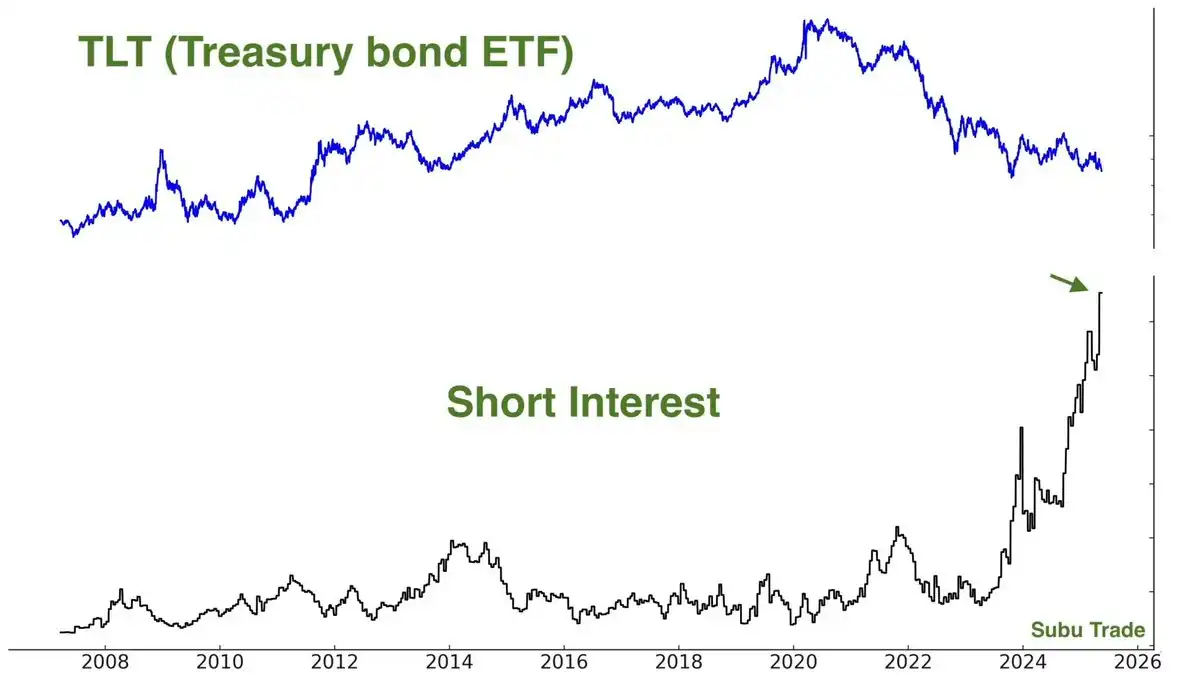
  • Short Squeeze: Long bonds are one of the most crowded short positions in the market.

  • Economic Indicators: Inflation data is cooling, sentiment is weak, labor market pressures are rising.

  • Geopolitics: Geopolitical and trade headlines are turning "risk-off," not "reflationary."

  • Policy Intervention: When something breaks, policy always turns to lowering long-end rates.

This combination has historically been rocket fuel for TLT.

Gold Is Not Always an Inflation Warning Bell

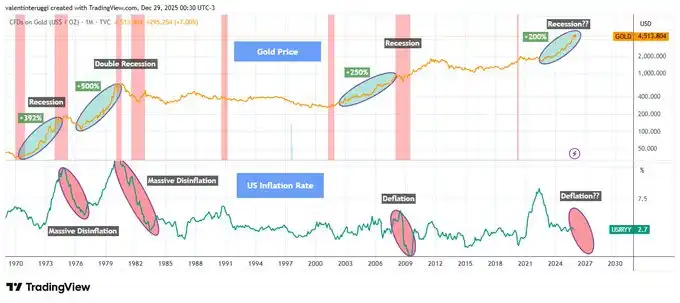
Whenever gold rises more than 200% in a short period, it signals not runaway inflation but economic stress, recession, and falling real rates (see Chart 1 below).

Historical experience shows:

  • The gold surge in the 1970s was followed by recession + disinflation.

  • The early 1980s surge was followed by a double-dip recession, breaking inflation.

  • The early 2000s gold rise foreshadowed the 2001 recession.

  • The 2008 breakout was followed by a deflationary shock.

Since 2020, gold has risen about 200% again. This pattern has never ended in lasting inflation.

When growth flips, gold acts more like a safe-haven asset.
U.S. Interest Expenses Are Exploding Compounded

The U.S. currently has annual interest expenses of about $1.2 trillion, roughly 4% of GDP (see Chart 2 below).

This is no longer a theoretical issue. This is real money flowing out—and interest compounds rapidly when long-term yields stay high.
This is so-called "Fiscal Dominance":

  • High rates mean higher deficits

  • Higher deficits mean more debt issuance

  • More debt issuance leads to higher term premium

  • Higher term premium leads to higher interest expenses!

This doom loop won't resolve itself with "Higher for Longer." It must be resolved through policy intervention!

The Treasury's Short-Term Trap

To ease immediate pain, the Treasury has drastically cut long-bond issuance:

  • 20/30-year bonds now make up only about 1.7% of total issuance (see Chart 3 below).

  • The rest is all pushed into short-term T-bills.

This doesn't solve the problem—it just kicks the can down the road:

  • Short-term debt constantly rolls over.

  • Refinancing will happen at future rates.

  • The market sees the risk and demands a higher term premium.

Ironically, this is why long-end yields stay high... and why they will collapse violently if growth cracks.

The Fed's Trump Card: Yield Curve Control

The Fed controls the short end, not the long end. When long-end yields:

  • Threaten economic growth

  • Trigger exploding fiscal costs

  • Disrupt asset markets

...the Fed has historically only done two things:

  • Buy long bonds (QE)

  • Cap yields (Yield Curve Control)

They won't act preemptively. They only act after stress appears.

Historical references:

  • 2008–2014: 30-year yield fell from ~4.5% to ~2.2% → TLT surged +70%

  • 2020: 30-year yield fell from ~2.4% to ~1.2% → TLT surged +40% in under 12 months

This isn't just theory—this has happened before!

Inflation Is Cooling, Economic Cracks Appearing

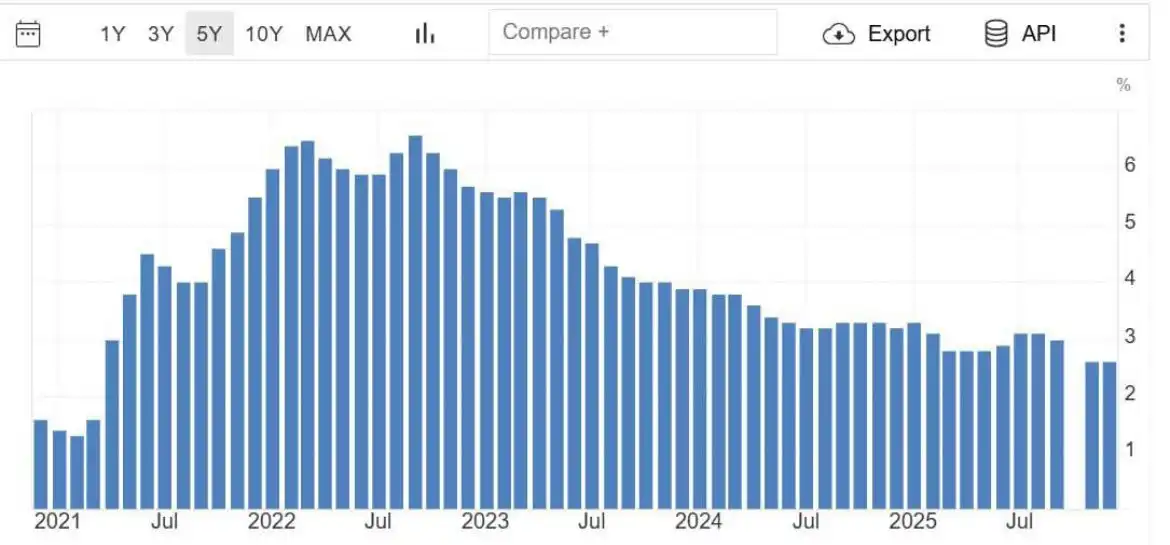
Recent data shows core inflation falling back to 2021 levels (see Chart 4).

  • CPI momentum is fading.

  • Consumer confidence is at a decade low.

  • Credit stress is building.

    Labor market is starting to crack.
Markets are forward-looking. The bond market is already starting to smell this.

Extremely Crowded Short Positions

TLT's short interest is very high:

  • Approximately 144 million shares sold short.

  • Days to cover exceeds 4 days.

Crowded trades don't unwind slowly. They reverse violently—especially when the market narrative shifts.

And importantly:

"Shorts piled in AFTER the move, not before."

This is classic late-cycle behavior!

Smart Money Is Moving In

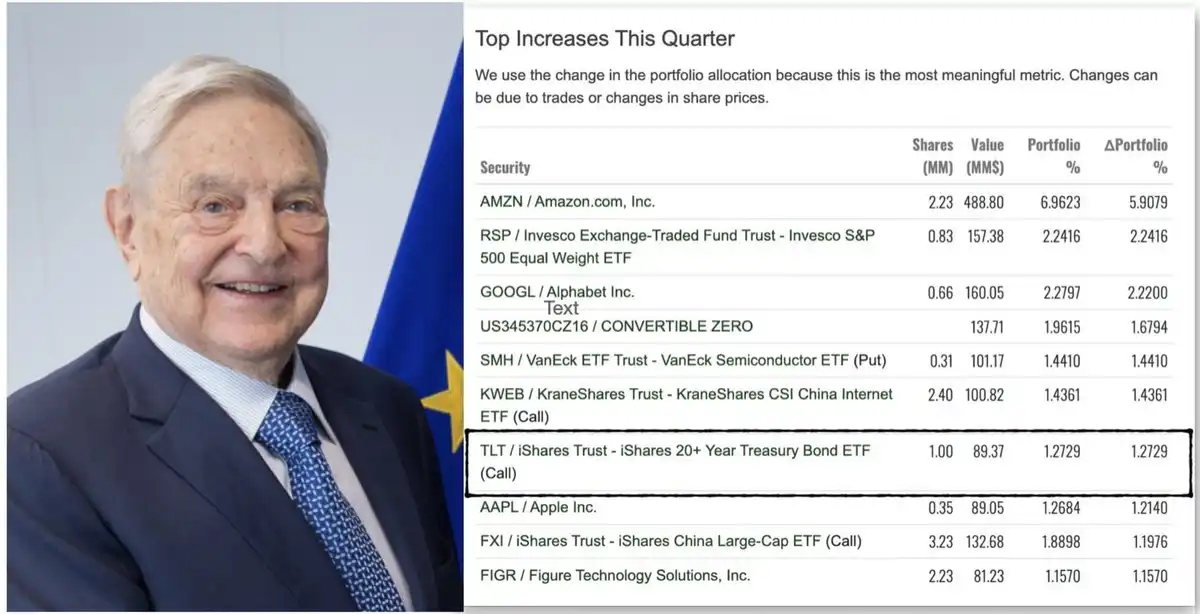
Recently, widely circulated 13F institutional holding reports showed a large fund's top quarterly additions included a significant number of TLT call options.

Regardless of who gets the credit, the message is simple: Sophisticated capital is starting to reposition for duration. Even George Soros's fund held TLT call options in the latest 13F disclosure.
Deflationary Shock from Tariff Frictions

The latest news is reinforcing the "risk-off" logic. President Trump announced new tariff threats targeting the Denmark/Greenland dispute, and European officials are now openly discussing freezing or suspending participation in the EU-US tariff agreement in response.

Trade friction will:

  • Hurt growth

  • Squeeze margins

  • Reduce demand

  • Push capital into bonds over stocks

This is not an inflationary impulse; it is a deflationary shock.

Valuation Mismatch: Stocks vs. Bonds

Today's stock pricing reflects:

  • Strong growth

  • Stable margins

  • Benign financing conditions

While bond pricing reflects:

  • Fiscal stress

  • Sticky inflation fears

  • Permanently high yields

If just one of these narratives is wrong, returns will diverge violently.

Long-duration bonds have "convexity"; stocks do not.

Upside Case Analysis for $TLT

TLT has:

  • An effective duration of ~15.5 years

  • You earn ~4.4–4.7% yield while you wait

Scenario Analysis:

  • If long-end yields fall 100 basis points (bps), TLT price return is +15–18%.

  • Fall 150 bps, TLT return is +25–30%.

  • Fall 200 bps (not extreme historically),意味着 it could surge +35–45% or more!

This doesn't include interest income, convexity bonuses, or the acceleration effect of short covering. This is why I see "asymmetric upside."

Conclusion

Honestly: After the carnage of 2022, I swore I'd never touch long bonds again. Watching duration assets get crushed was a deeply frustrating experience.

But the market doesn't care about your psychological trauma—it only cares about probabilities and prices.

When everyone agrees bonds are "uninvestable," when sentiment bottoms, when shorts pile up, when yields are high and growth risks are rising...

That's when I start buying!

  • TLT + TMF currently make up ~60% of my portfolio. I made 75% returns in the 2025 stock market and redeployed most of it into bond ETFs in November 2025.

  • I am "getting paid to wait" (earning over 4% yield).

  • My position is based on policy and growth shifts, not flimsy narratives.

2026 will finally be the "Year of the Bond."

Perguntas relacionadas

QAccording to the article, why does the author believe that 2026 will be the year bonds outperform stocks?

AThe author believes 2026 will be the year bonds outperform stocks due to a convergence of macro mathematics, positioning, and policy constraints. Key reasons include the U.S. government's exploding interest expense burden, gold signaling deflationary risks, extremely crowded short positions in long bonds, cooling inflation, weakening economic indicators, and imminent policy intervention to lower long-end yields.

QWhat historical pattern does the author cite regarding gold's performance and what it signals for the economy?

AThe author cites a historical pattern where whenever gold rallies over 200% in a short period, it has not signaled runaway inflation but instead foreshadowed economic stress, recession, and falling real rates. Examples given are the 1970s (followed by recession/disinflation), early 1980s (double-dip recession), early 2000s (2001 recession), and 2008 (deflationary shock).

QWhat is 'Fiscal Dominance' as described in the article, and why is it a problem for the U.S.?

A'Fiscal Dominance' is described as a vicious cycle where high interest rates lead to higher deficits, which require more debt issuance. This increased issuance leads to a higher term premium, which in turn causes even higher interest expenses. This is a problem because the U.S. is already spending ~$1.2 trillion annually on interest, creating a compounding fiscal burden that cannot be solved by 'higher for longer' rates and necessitates policy intervention.

QHow does the extremely crowded short interest in long-term bonds (like TLT) create a potential opportunity?

AThe extremely crowded short interest in TLT (approx. 144 million shares short) creates a potential for a violent short squeeze. Crowded trades like this do not unwind slowly; they reverse sharply, especially when the market narrative shifts. This positioning provides 'rocket fuel' for a rapid price increase in long bonds as shorts are forced to cover their positions.

QWhat specific policy tools does the author suggest the Federal Reserve will use if long-end yields threaten the economy, and what historical examples are given?

AThe author suggests the Federal Reserve will use Quantitative Easing (QE - buying long bonds) and Yield Curve Control (YCC - capping yields) if long-end yields threaten growth, cause fiscal costs to explode, or disrupt asset markets. Historical examples given are from 2008-2014 (30-year yield fell from ~4.5% to ~2.2%, TLT surged +70%) and 2020 (30-year yield fell from ~2.4% to ~1.2%, TLT surged +40% in under 12 months).

Leituras Relacionadas

After Three Consecutive Quarters of Decline, Can the Crypto Market Find a Window for Stabilization in Q3?

The cryptocurrency market has just concluded its worst-performing quarter since 2022, with total capitalization dropping 12.6% to $2.1 trillion. All core metrics indicate capital is leaving the sector, not just rotating within it. Bitcoin fell 14.2% and Ethereum dropped 25.4% in Q2, breaking their previous correlation with US tech stocks. A key driver is the reversal in US spot Bitcoin ETF flows, which saw a net outflow of approximately $4.67 billion in Q2, including a record monthly outflow near $4.5 billion in June. While recent data suggests long-term holders are accumulating again, sustained ETF outflows mean continued selling pressure. Market focus is now singularly on the Federal Reserve. The upcoming July FOMC meeting is seen as the most critical event for Q3. A dovish signal could support Bitcoin reclaiming a $68,000-$84,000 range, while a hawkish stance might establish a new trading band around $50,000-$56,000. Additionally, regulatory uncertainty persists, with the progress of the crucial *CLARITY Act* stalling in the Senate, reducing its perceived 2026 passage probability to 40-45%. Despite the broad downturn, a few sectors showed growth. Prediction markets saw nominal volume surge 48.7% year-over-year to $113.8 billion, and tokenized collectibles transaction volume rose 143% quarterly to $1.4 billion. The Real-World Asset (RWA) tokenization sector also continued steady growth, now representing ~$28.1 billion in on-chain value. The market's foundation for an extreme crash appears limited, with Bitcoin price hovering near its 200-week moving average. However, the trading paradigm has shifted from narrative-driven speculation to decisions based on price action, policy developments, and interest rate expectations, making a broad sentiment-driven rally unlikely in the near term.

marsbitHá 12h

After Three Consecutive Quarters of Decline, Can the Crypto Market Find a Window for Stabilization in Q3?

marsbitHá 12h

BIT Trading Moment: BTC Still Suppressed by Weekly 200 EMA, Rejection May Restart Decline; Storage and Semiconductors that Surged Last Night Begin Falling in Evening Trading

**Crypto & Stock Market Wrap: Bitcoin Tests Resistance, Stocks Retreat After AI Surge** Bitcoin consolidates around $66,000, facing key resistance near $68,000—an area seen as a major psychological and technical hurdle where previous rallies have failed. Analysts note the cryptocurrency is caught between its 200-week moving average (~$63,333) and 200-week EMA (~$68,328). A clear break above $68k is needed to signal a stronger bullish trend, while a rejection could lead to a retest of $63k support. Market sentiment remains cautious, with low futures open interest pointing to a low-liquidity rebound rather than a full bull market. Bitcoin spot ETFs saw another $203 million inflow. US stock futures pointed lower after a strong Tuesday session led by a massive rebound in semiconductors and memory stocks. The rally was fueled by renewed optimism about AI-driven hardware demand, with Micron, SanDisk, and SK Hynix surging. However, those gains reversed in pre-market trading. Super Micro Computer (SMCI) soared over 20% after hours on strong guidance and a record backlog. Other standouts included Rocket Lab and nuclear energy plays Oklo and X-Energy. Rising oil prices (Brent above $91) and climbing Treasury yields (10-year near 4.64%), however, are reigniting inflation concerns and acting as a headwind for equities. In Asia, markets were mixed. South Korea's KOSPI pared early gains to close slightly higher as semiconductor stocks like SK Hynix gave back initial surges. Japan's Nikkei edged lower as the yen hit a fresh 38-year low against the dollar, raising fears of potential market intervention. Key events to watch include the Samsung Galaxy launch, AMD's AI event, and a slew of major tech earnings from Alphabet, Tesla, and IBM after the close on Wednesday, followed by the ECB meeting and Intel's earnings on Thursday.

marsbitHá 13h

BIT Trading Moment: BTC Still Suppressed by Weekly 200 EMA, Rejection May Restart Decline; Storage and Semiconductors that Surged Last Night Begin Falling in Evening Trading

marsbitHá 13h

Former CFTC Chairman, Circle President Tarbert: Preaching Long-Termism While Cashing Out $30 Million Himself

Former CFTC Chairman and Circle President Heath Tarbert has consistently advocated for a long-term vision in public, urging patience from investors as Circle’s stock price has fallen significantly from its peak. However, it has been revealed that since Circle’s IPO, Tarbert has continuously sold his CRCL shares through pre-arranged trading plans, cashing out approximately $30 million, without making any public market purchases. This contrast between his public messaging and personal actions has drawn criticism. Tarbert joined Circle in July 2023 as Chief Legal Officer, leveraging his regulatory experience to help guide the company through its IPO and expansion. Despite promoting stablecoins as long-term infrastructure, he established a 10b5-1 trading plan just before Circle went public, leading to substantial stock sales over the following year. In March 2026, he initiated another plan to sell more shares. His career trajectory highlights a pattern of moving between high-level regulatory roles and influential positions in the financial sector. After resigning as CFTC Chairman in early 2021, he joined Citadel Securities as Chief Legal Officer just 27 days later, during a period of intense regulatory scrutiny for the firm. He later joined Circle, aiding its efforts to navigate regulatory challenges for its public listing. While Tarbert's expertise in policy and compliance is valuable to companies like Circle, his actions—advocating long-term confidence while personally divesting—raise questions about the alignment between his public statements and his private financial decisions, leaving investors who followed his advice to bear the market risks.

marsbitHá 13h

Former CFTC Chairman, Circle President Tarbert: Preaching Long-Termism While Cashing Out $30 Million Himself

marsbitHá 13h

Gate Research Institute: The 'Wall Street-ization' Wave of Crypto Financial Products – Competition or Integration?

The article titled "Gate Research Institute: Are Crypto Financial Products Sparking a 'Wall Street' Wave—Competition or Convergence?" explores the evolving relationship between the crypto ecosystem and traditional finance (TradFi). The piece begins by reflecting on Bitcoin's original 2009 vision of decentralization, disintermediation, and moving away from banks. It then contrasts this with the 2024 landscape, where key crypto assets like Bitcoin are increasingly held through Wall Street products like ETFs issued by giants like BlackRock. The article questions whether this signifies that TradFi is systematically taking over the rights to issue, price, custody, and distribute crypto financial assets. The core argument is that this is not a zero-sum takeover but rather a bidirectional convergence where each side addresses the other's weaknesses. Crypto offers 24/7 global markets, programmable settlement, and open access but lacks compliant channels, institutional-grade custody, deep fiat liquidity, and mainstream distribution. TradFi possesses these but is constrained by legacy systems, limited operating hours, and slow settlement. Two primary convergence paths are highlighted: * **Path A (CEX to TradFi):** Exemplified by Gate, which has progressed from offering tokenized stocks and CFDs to providing direct, real stock trading (US, Hong Kong, South Korea) within its platform, using USDT. * **Path B (TradFi to Crypto):** Exemplified by Robinhood, which has integrated crypto trading, acquired exchanges like Bitstamp, and is moving traditional assets like stocks onto the blockchain via tokenization and its own Layer 2. Both paths are ultimately competing to become the next-generation, unified financial account—a "super account" where users can seamlessly trade cryptocurrencies, stocks, ETFs, RWA (Real World Assets), and tokenized treasury products in one interface. The growth of RWA and tokenized treasuries (e.g., BlackRock's BUIDL) is presented as the asset-layer fusion, providing stable, yield-bearing assets on-chain and acting as a bridge between the two worlds. In conclusion, the "Wall Street-ization" of crypto is framed as a mutual transformation. Decentralized ideals persist in the protocol layer, while at the application layer, a more efficient, global, and accessible unified capital market is emerging from this convergence. The future competition lies not between crypto exchanges and stockbrokers, but between platforms vying to offer the most comprehensive asset coverage, liquidity, and user experience within a single account.

marsbitHá 13h

Gate Research Institute: The 'Wall Street-ization' Wave of Crypto Financial Products – Competition or Integration?

marsbitHá 13h

Trading

Spot
活动图片