TACO Is Outdated, Wall Street Is Betting Heavily on NACHO

marsbitPublicado em 2026-05-10Última atualização em 2026-05-10

Resumo

The article discusses a shift on Wall Street from the "TACO" (Trump Always Chickens Out) trading theme to a new one called "NACHO" (Not A Chance Hormuz Opens). This change reflects the market's adaptation to a prolonged closure of the Strait of Hormuz following U.S.-Israel airstrikes on Iran in late February. Unlike TACO, which bet on former President Trump de-escalating crises, NACHO bets on a protracted stalemate keeping the vital oil chokepoint shut. Key evidence for the NACHO regime includes a fundamental decoupling of oil prices and the S&P 500 since late March. While Brent crude has remained elevated (around $109 in May), the stock index has rallied to new highs. The market is pricing in a long but finite period of high oil prices, as seen in the steep futures curve. This theme is backed by real money in three derivatives markets: soaring war risk insurance for ships, an inverted oil futures structure, and evaporating expectations for Federal Reserve rate cuts in 2026. Within the equity market, the NACHO dynamic has caused a sharp divergence, with the energy sector (XLE) vastly outperforming the transportation sector (IYT), which is highly sensitive to fuel costs. The article notes a concrete deadline for this trade: early June. Analysts warn that global commercial oil inventories could approach critical "operational pressure" levels by then, potentially triggering more severe market disruptions if the Strait remains closed. Prediction markets currently assign a very...

Author: The Block

On Wall Street, the "TACO trade" is outdated. Now everyone is talking about a new trading pattern—"NACHO".

Since the US-Israel airstrikes on Iran on February 28, the Strait of Hormuz has remained closed. Currently, oil prices are up over 50% compared to pre-war levels, and the market's expectation for Fed rate cuts in 2026 has been compressed from 2 pre-war to the current 0. Yet during the same period, the S&P 500 hit a record high, rising for 6 consecutive weeks, marking its longest winning streak since 2024.

Wall Street has named this seemingly contradictory market state NACHO, which stands for "Not A Chance Hormuz Opens." It is the antonym of TACO ("Trump Always Chickens Out"). TACO bets on "people chickening out"—that Trump will back down at critical moments. NACHO bets on "things getting stuck"—that this time, the Strait of Hormuz cannot be reopened with just one Truth Social post.

eToro market analyst Zavier Wong describes this shift: "For most of the crisis, every ceasefire headline caused oil prices to plummet sharply. Traders kept betting on a solution that never arrived. NACHO means the market acknowledges that high oil prices are not a one-time shock but the current market environment itself."

Two Lines in Early April

March 23 was the tipping point for the TACO model's failure. That morning, Trump announced on Truth Social that he had a "very good constructive dialogue" with Iran and ordered the Pentagon to suspend strikes on Iranian energy facilities for 5 days. S&P 500 futures rebounded nearly 4% from the lows in minutes, instantly adding $1.7 trillion in market value. Brent crude fell from $109 intraday to $92.

Then, Iranian officials denied the existence of any dialogue. According to Iranian state media, a "senior security official" called it a market manipulation tactic, stating no dialogue ever took place. Gains were halved within two hours. The S&P closed up only +1.15%, and Brent bounced back to $99.94.

That was the first time in 14 months that Trump's "backing down" no longer worked for the market. The reason is not complicated. Backing down under the TACO model is one-sided, achievable with just one post. The backing down on March 23 required Iran's cooperation. When the opponent doesn't cooperate, backing down becomes a lie.
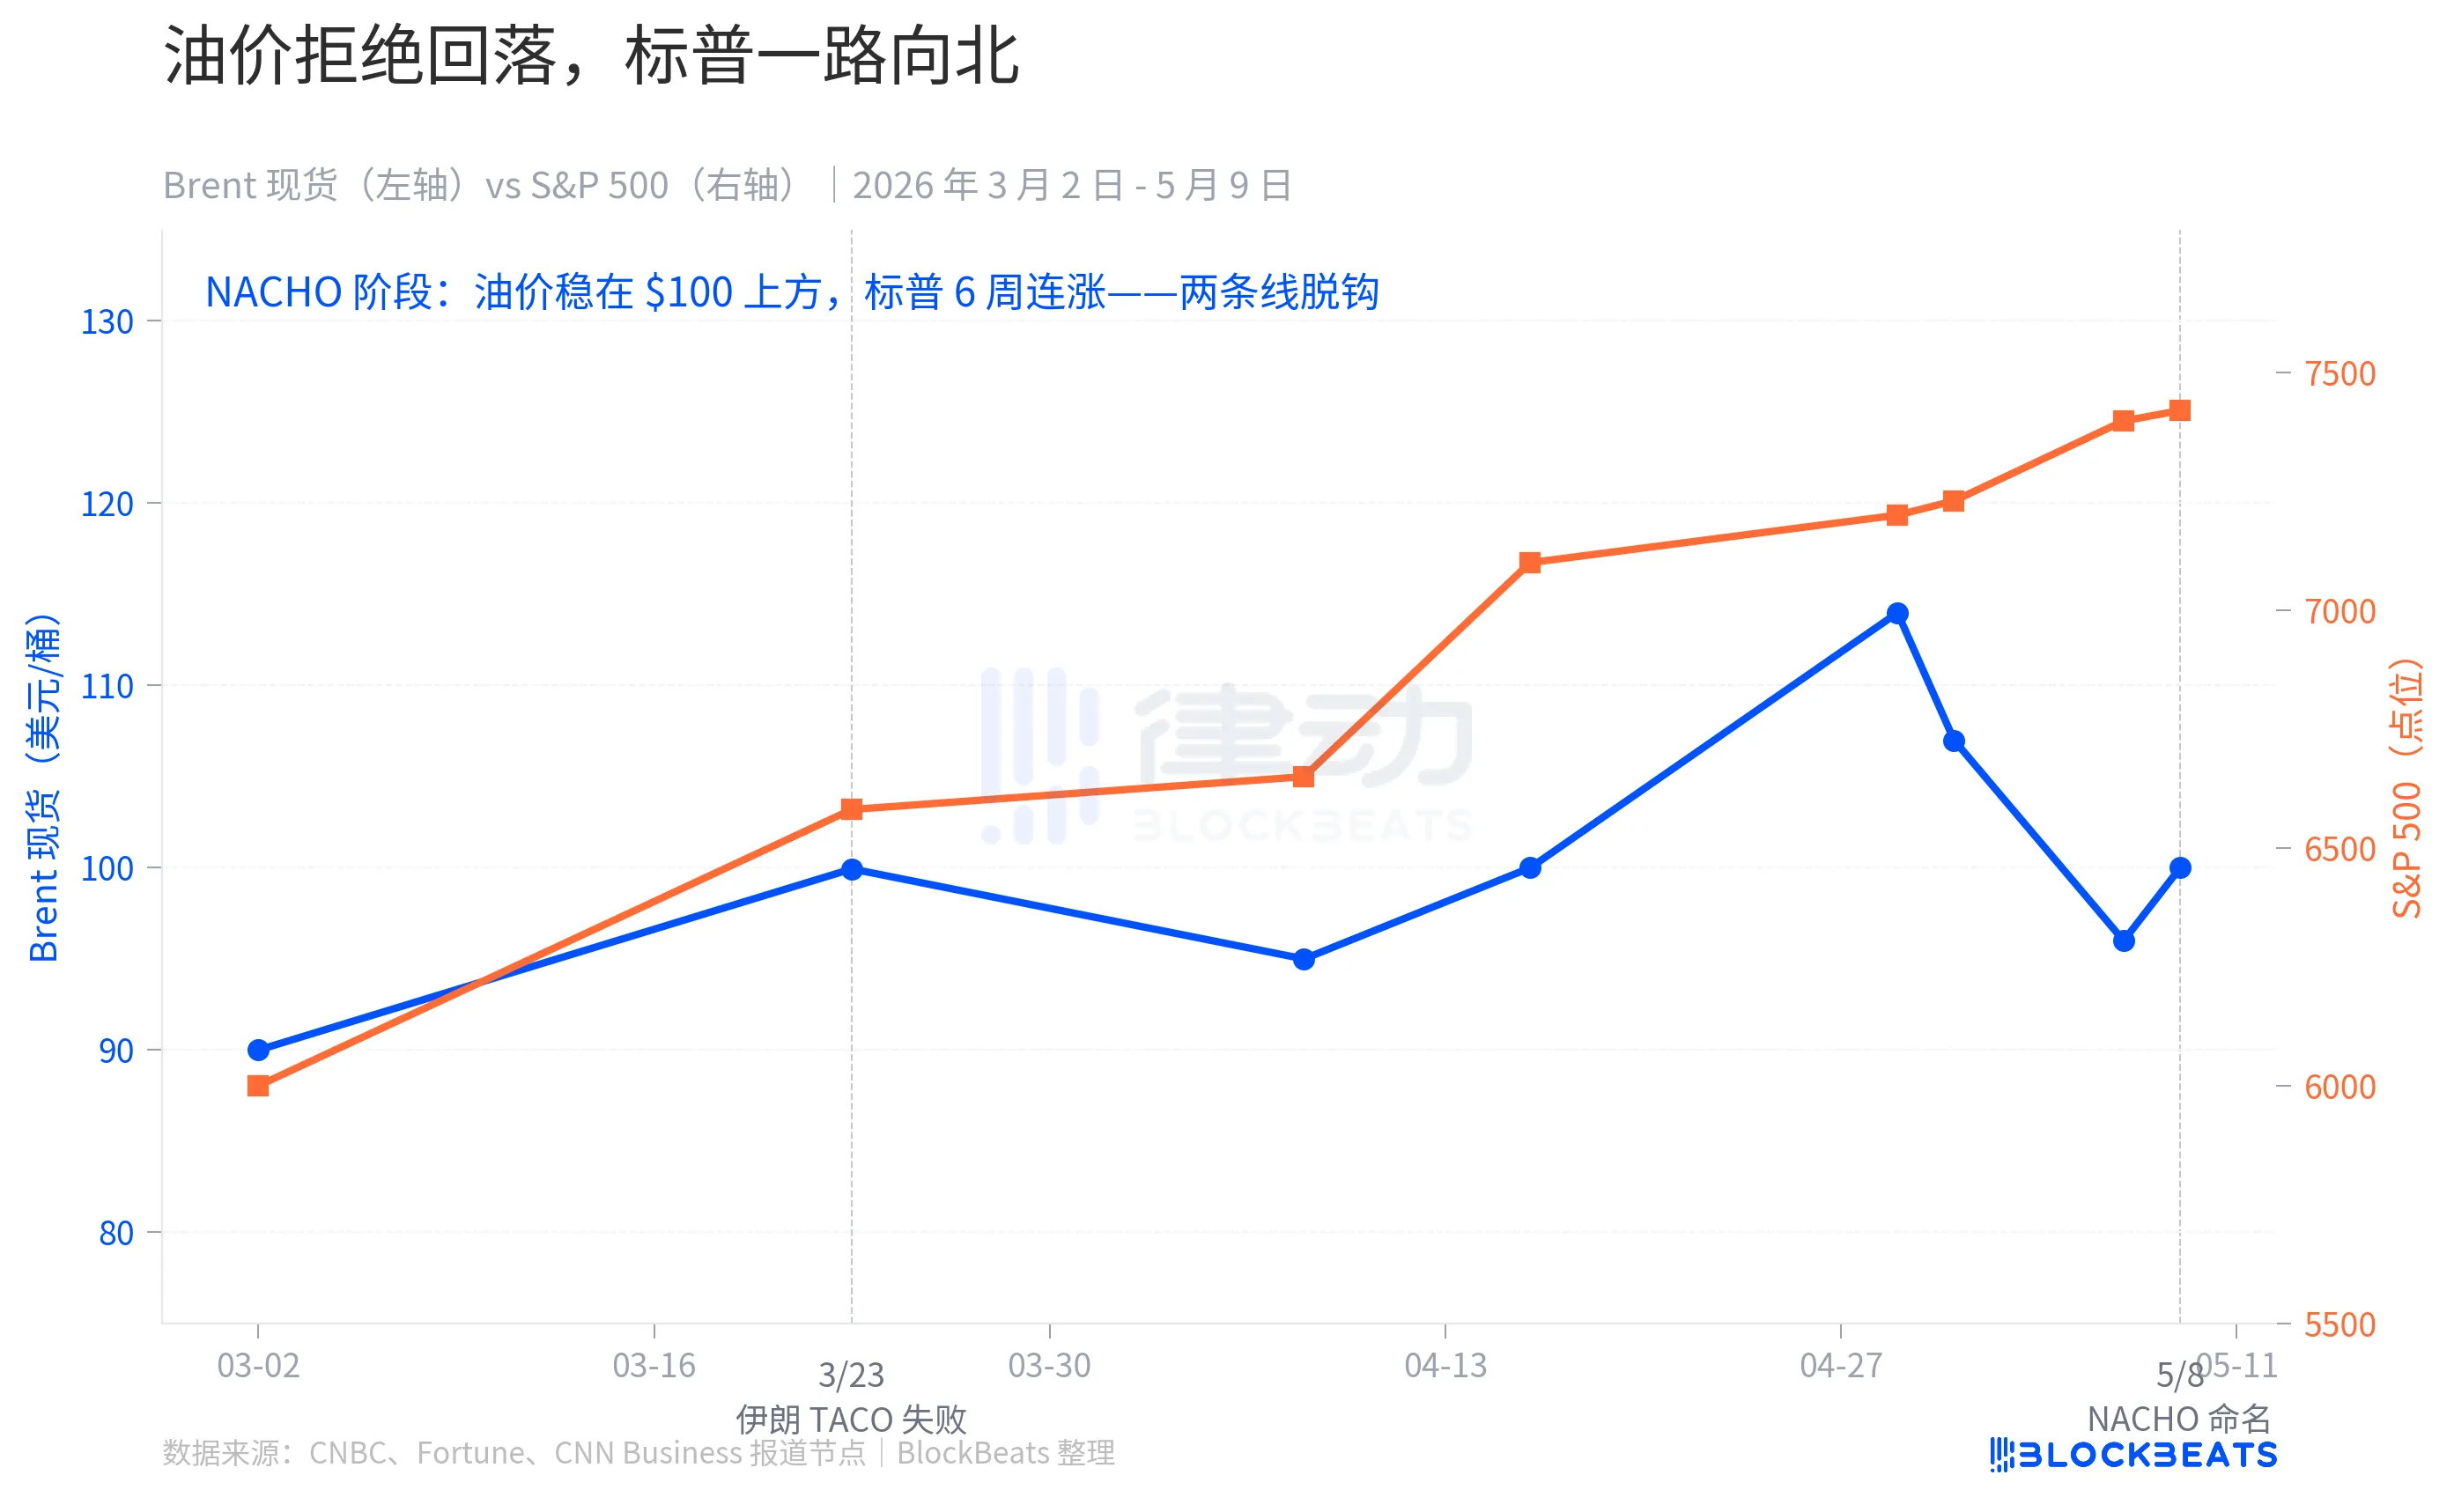
Starting that day, market behavior fundamentally changed. Brent crude never fell back to the pre-war level of $67 in the following 6 weeks, maintaining an average price of $109.57 in May. In between, there were the US-Iran ceasefire agreements on April 7-8, a period on April 17 when oil prices briefly returned to "initial war levels," and news on May 7 that the US and Iran were close to a deal. Each "ceasefire headline" failed to bring oil prices back to the baseline.

But the S&P marched northward. It rose 10% in April alone, its strongest month since November 2020, hitting 7 intraday record highs during the period. On May 1, it broke 7,230 points intraday; on May 7, it closed at 7,398 points.

The two lines completely decoupled in early April. In the TACO era, they moved in sync: threats caused oil and S&P to fall, backing down caused oil and S&P to rebound. In the NACHO era, they speak two different languages: oil says "Hormuz is shut for good," while the S&P says "not my problem."

Three Markets, Three Reactions

NACHO is not just talk; it's the same bet placed with real money across three independent derivatives markets.

The first layer is insurance. According to Strauss Center historical data, the war risk insurance rate for the Strait of Hormuz once soared to 3.5% of hull value during the 2003 US invasion of Iraq and reached 7.5% at the peak of the 1984 "Tanker War" during the Iran-Iraq War after the attack on the Yanbu Pride tanker. The baseline before this crisis was 0.125% to 0.25%. By early May, the rate had entered the 1% range, with some policies spiking to 3% to 8%.

Converted to the insurance cost per single voyage for a Very Large Crude Carrier (VLCC), the fee has jumped from about $250,000 pre-war to the current $800,000 to $8 million. The job of insurance companies is to price risk. The practical implication of this layer is: if insurers simply won't provide coverage, shipowners won't bear the risk of uninsured passage. "Physical opening" and "de facto navigation" of the Strait are two different things.
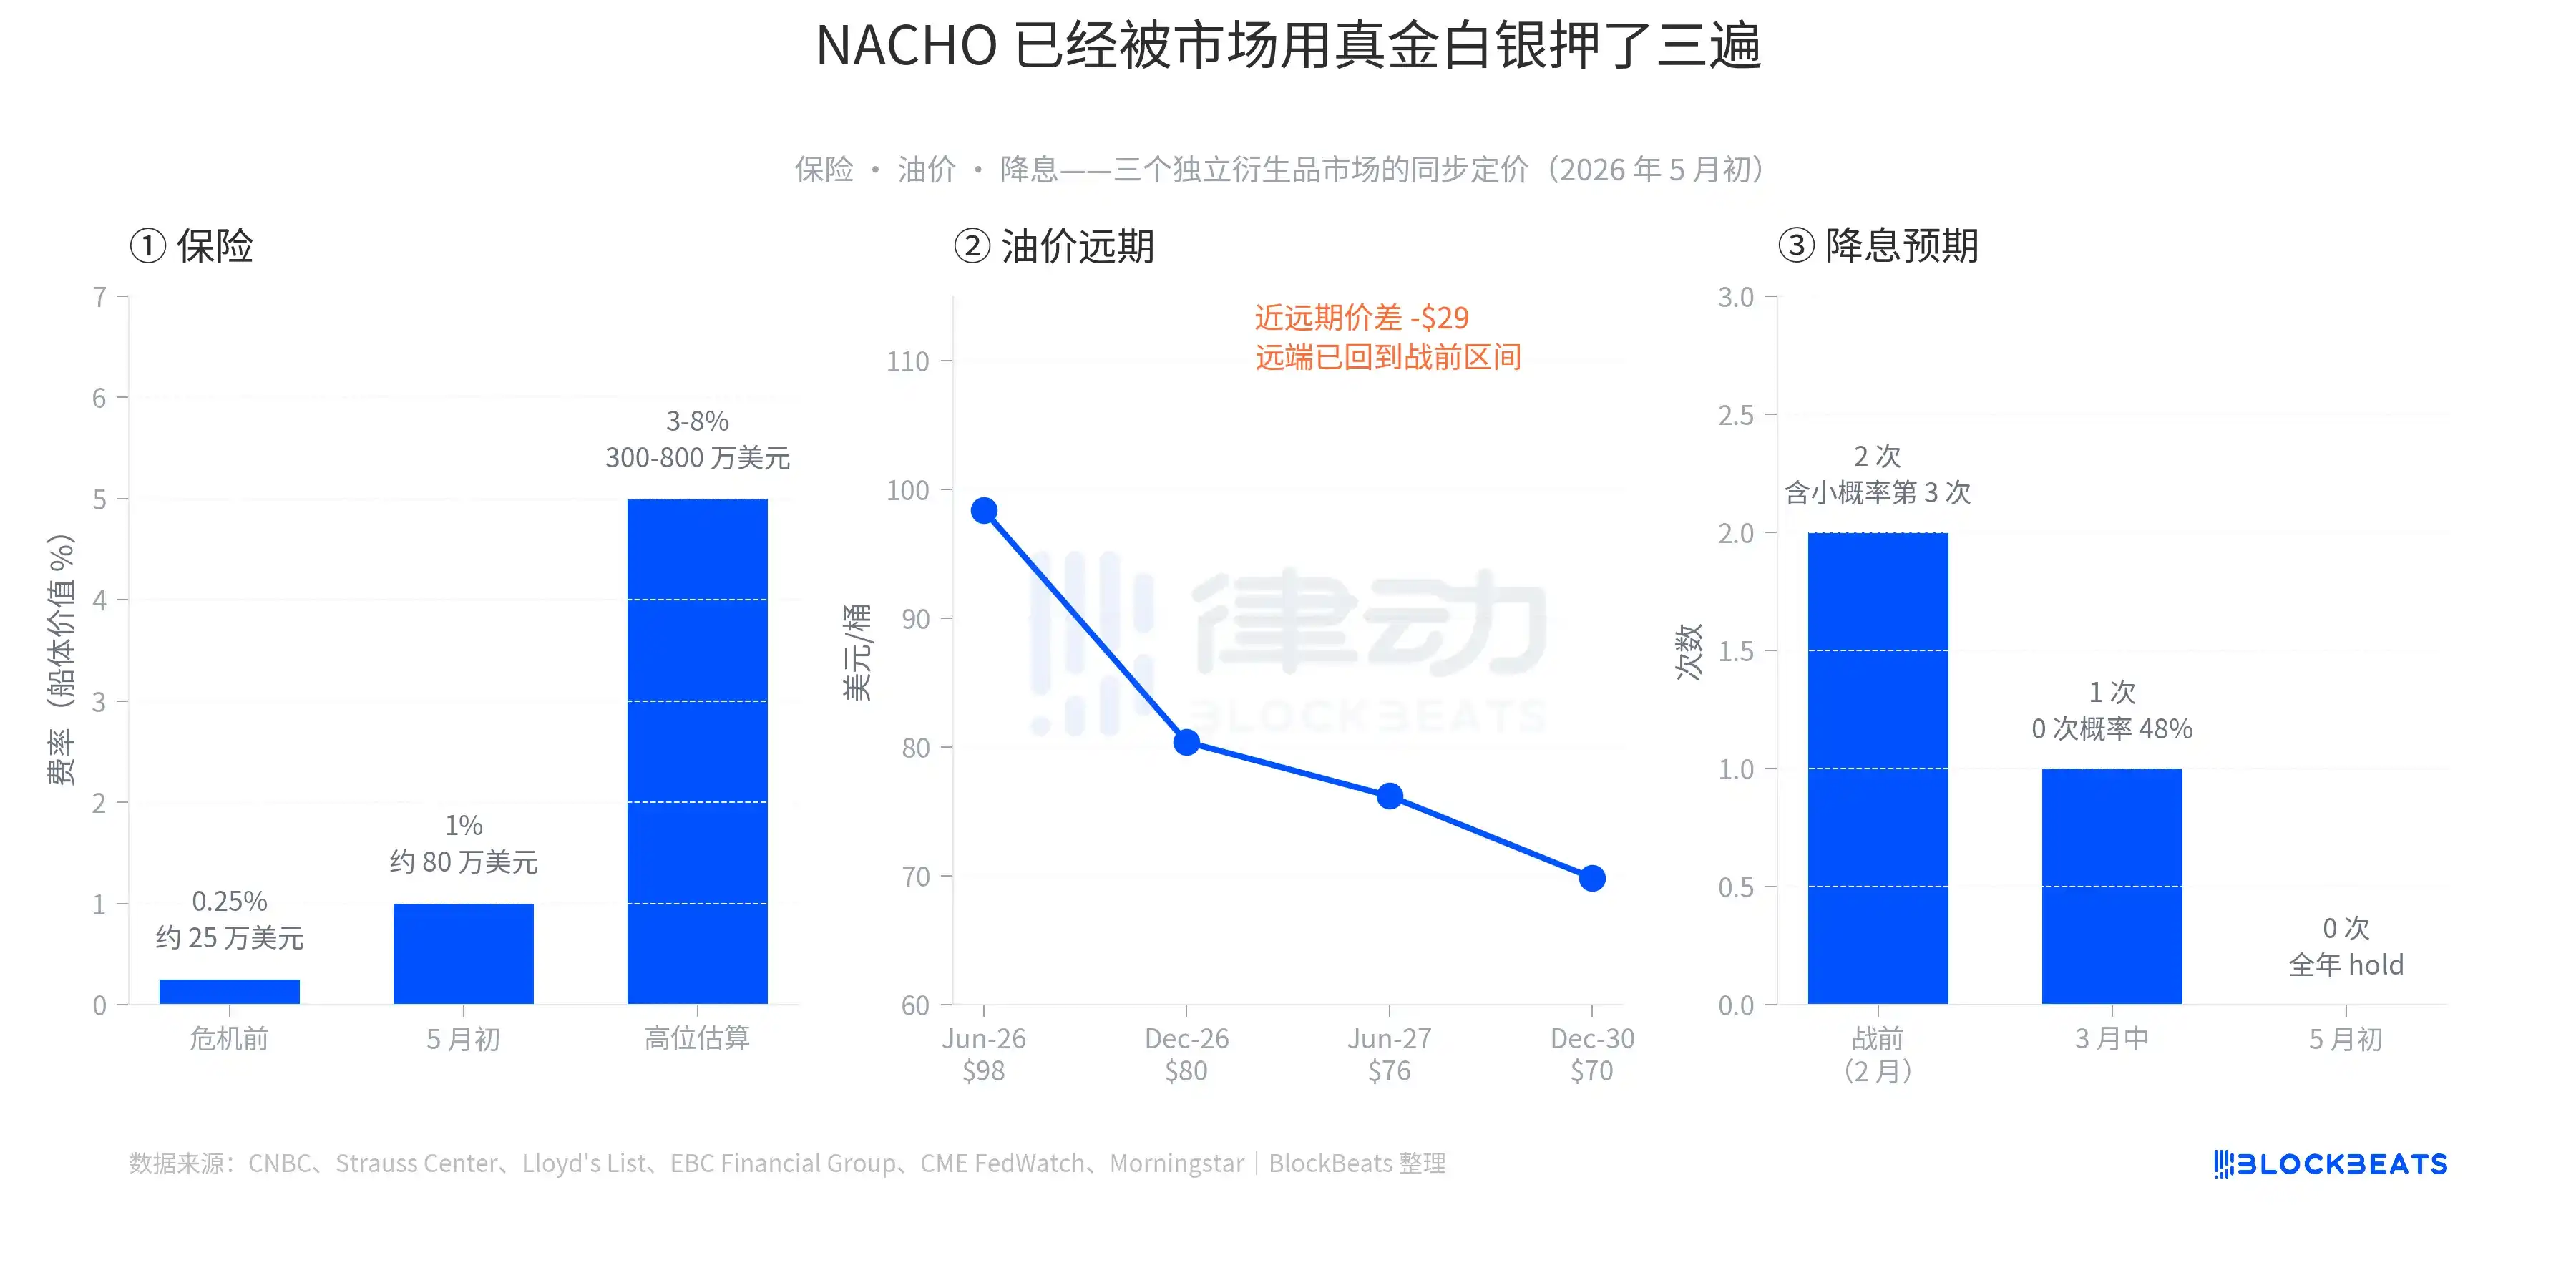
The second layer is oil prices. Early May data shows: Brent Jun-26 contract at $98.41, Dec-26 at $80.39, Jun-27 at $76.20, Dec-30 at $69.85. The spread between the front-month and Dec-30 is about $28.5, one of the steepest backwardation (near high, far low) structures in the past 5 years. This curve tells a very specific story: the market believes spot supply is tight but will eventually ease, with long-term prices returning to the pre-war range of $60-$70. In other words, high oil prices are not the final outcome but a bounded window. However, this window is long enough that traders don't bet on it ending suddenly.

The third layer is interest rate cuts. In early February 2026, the market expected the Fed to cut twice for the year, with a small chance of a third cut. By mid-March, after oil prices surged, it was compressed to one cut, with a 48% probability of 0 cuts. On April 29, the Fed held rates at 3.50% to 3.75%. On May 6, CME FedWatch showed a 70% probability of a continued hold at the June meeting. For all of 2026, the market is now pricing in 0 rate cuts. Hedge fund legend Paul Tudor Jones even said in a May 7 CNBC interview, "Not even Wash (likely meaning current Fed Chair) has a chance to make the Fed cut."

All three layers have left their mark in the derivatives markets—not just narrative, but real money.

The Differentiated Broad Market

The second subtle detail of NACHO is that it has already priced differentiation within the broad market.

As of the close on May 7, the Energy sector ETF (XLE, State Street's Energy Select Sector Fund) is up 31.63% year-to-date, the only major sector positive for all of 2026. Over the same period, the S&P 500 is up about 24%. The Transportation sector ETF (IYT, iShares U.S. Transportation ETF) is up only 8.79% year-to-date, underperforming the broader market by over 15 percentage points.
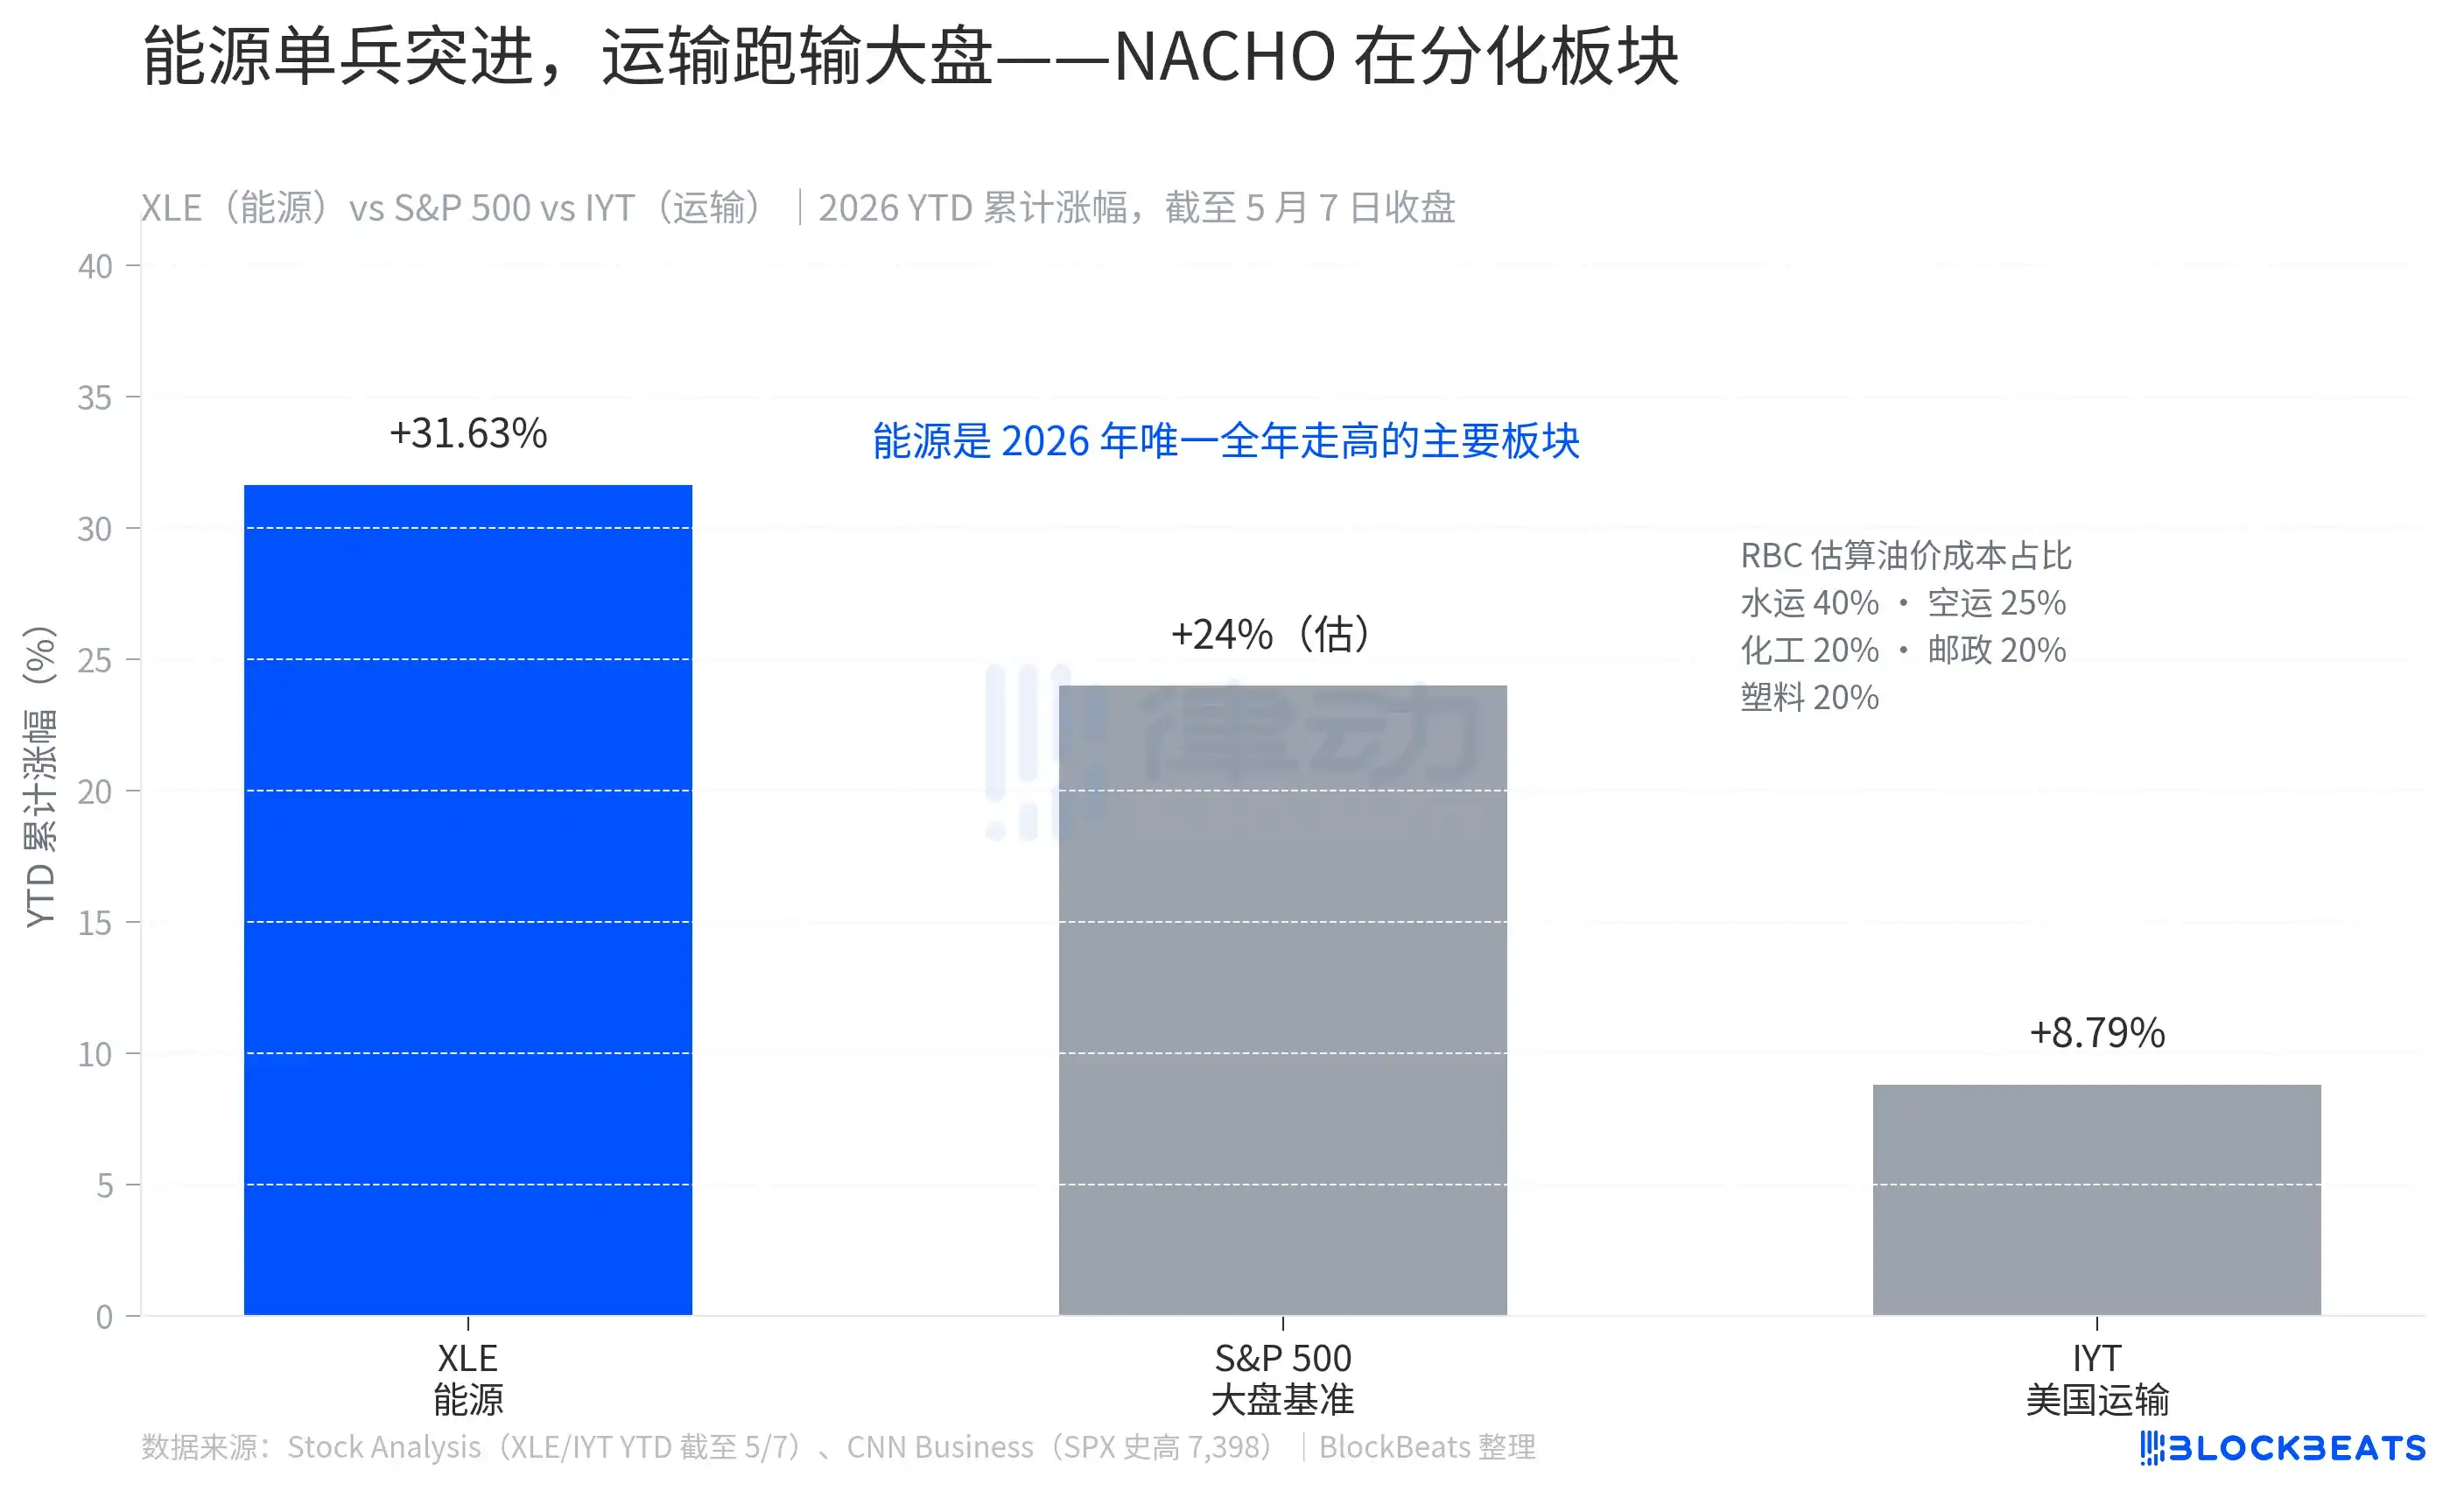
This gap is not random. According to RBC Capital Markets estimates, fuel costs account for 40% of operating costs in the water transport industry, 25% in air transport, and 20% each in chemicals, postal/courier services, and rubber/plastics. If fuel is a major item on your business's cost sheet, NACHO is a direct hit to your face.

XLE's 31.63% gain is not a short-term rebound; it's the result of 8 consecutive weeks of outperformance. IYT's 8.79% is not weakness; it's rising with the broad market while having its gains eroded by oil prices. The market has clearly shown readers how to calculate NACHO's odds—just look at the magnitude by which the Transportation ETF underperforms the market.

But NACHO is not a bet for an indefinite period; it has a very specific deadline: June 1.

According to JPMorgan's commodity research team estimates, global commercial crude oil inventories were about 8.4 billion barrels at the start of 2026, but only around 800 million barrels of that was "practically usable." The rest consists of pipeline fill, tank bottoms, minimum terminal stocks—maintaining the daily operation of the system. Since this crisis began, 280 million barrels have been drawn down, leaving about 520 million barrels of usable inventory remaining. JPMorgan's exact words: "Commercial inventories are expected to approach operational stress levels in early June."

"Operational stress level" is a specific physical concept. JPMorgan explains: "The system won't collapse because oil disappears; it will collapse because the distribution network no longer has sufficient working inventory." Once this line is breached, the only choices for businesses and governments are: either squeeze the minimum inventory necessary to maintain operations (which damages the infrastructure itself), or wait for new supply. If Hormuz remains closed until September, OECD commercial inventories could fall to the so-called "operational floor." According to a Fortune report, European aviation fuel inventories are expected to fall below the 23-day supply threshold in June, a key industry red line.
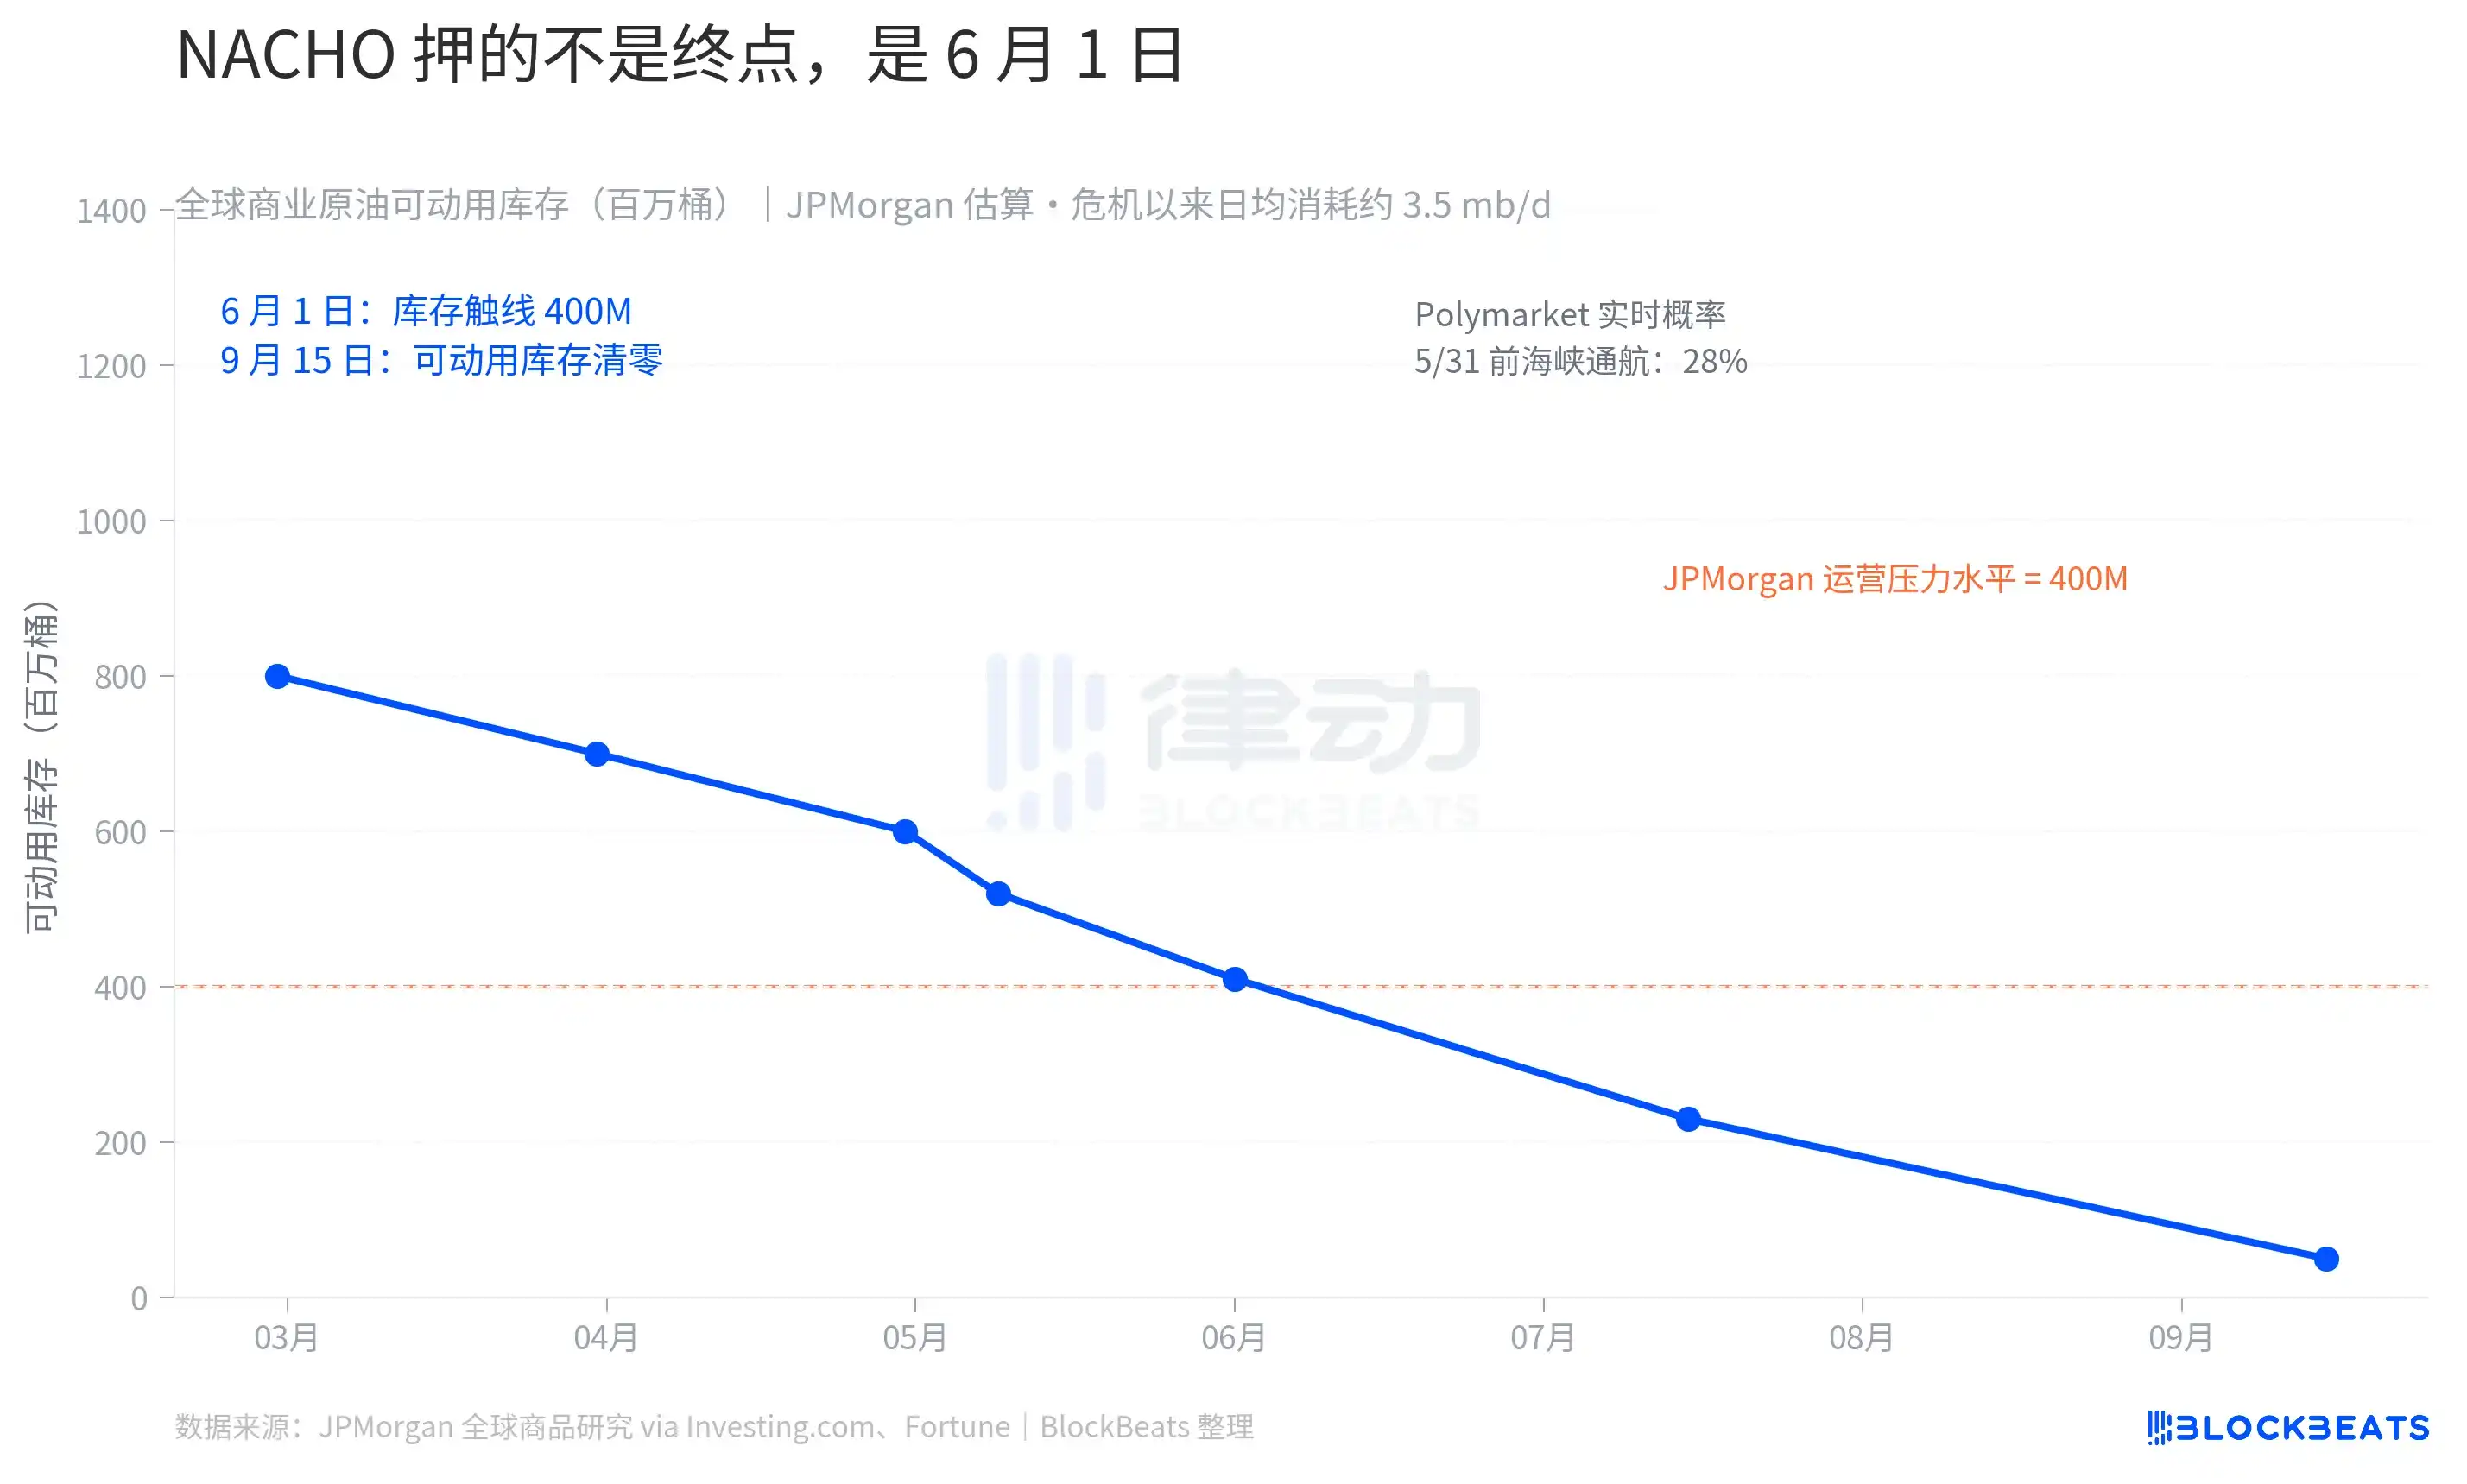
The market's prediction of odds is synchronized with the physical clock. According to Polymarket data on May 9, the probability of "Strait of Hormuz open for normal traffic by May 31" is 28%, and the probability before May 15 is only 2%. $9.92 million in active positions on that market are betting that NACHO will not fail, at least through May.

The market is no longer trading Trump's next Truth Social post; it's trading the early June inventory data for the Strait of Hormuz.


Perguntas relacionadas

QWhat does the acronym NACHO stand for, and what market trend does it represent?

ANACHO stands for 'Not A Chance Hormuz Opens'. It represents a market trend where traders assume the Strait of Hormuz will remain closed for an extended period, leading to sustained high oil prices and a decoupling of oil and equity market movements.

QWhy did the TACO trading pattern fail around March 23rd according to the article?

AThe TACO ('Trump Always Chickens Out') pattern failed because Trump's claim of constructive dialogue with Iran on March 23rd, which initially calmed markets, was denied by Iran. This showed that a one-sided 'chicken out' was no longer effective when the opposing party did not cooperate, turning the retreat into a perceived market manipulation.

QHow are the oil futures market and the Federal Reserve interest rate market pricing in the NACHO scenario?

AThe oil futures market shows a steeply inverted curve with near-term prices (e.g., Jun-26 at ~$98) much higher than long-term futures (e.g., Dec-30 at ~$70), pricing in a prolonged but ultimately temporary supply disruption. Simultaneously, the interest rate market has priced out all expected Federal Reserve rate cuts for 2026, reflecting expectations that high energy prices will keep inflationary pressure persistent.

QWhich sectors are winning and losing under the NACHO market regime, and why?

AThe energy sector (ETF: XLE) is a clear winner, up over 31% year-to-date, benefiting directly from high oil prices. The transportation sector (ETF: IYT) is a significant loser, up only about 8.7%, as its operating costs are heavily tied to fuel prices, which erodes profits despite the broader market rally.

QWhat is the key physical constraint or deadline that defines the NACHO trade's timeframe?

AThe key physical constraint is global commercial oil inventory levels. According to the article, JPMorgan estimates that 'operationally available' crude stocks could approach critical 'operational pressure levels' by early June. If the Strait of Hormuz remains closed, the system risks breaching its minimum operational inventory floor, making the NACHO trade's viability closely tied to this inventory clock.

Leituras Relacionadas

Will DeFi and TradFi Ultimately Merge? a16z Challenges Mainstream Market Predictions

The popular notion of DeFi and TradFi merging into a unified hybrid system is largely incorrect, argues this a16z analysis. In reality, traditional finance will selectively adopt blockchain technology—not for its decentralized ethos, but for its compelling cost advantages in areas like settlement, reconciliation, and new distribution channels. This adoption, however, comes with strict conditions: technologies must optimize costs and risks while remaining compatible with institutional controls, compliance, and accountability frameworks. Features like open access and anonymity, core to DeFi, are typically discarded or heavily modified. The result is not a fusion with DeFi but the rise of a new category: *programmable financial infrastructure*, built on blockchain but optimized for institutional constraints (e.g., permissioned networks like Canton, tokenized money market funds). This institutional track and the open, permissionless DeFi track represent two distinct but potentially complementary opportunities for developers. The open network remains the primary source of foundational innovation (e.g., atomic settlement, AMMs, programmable money), which institutions later adapt. Developers should choose their path clearly: building for institutions requires deep understanding of procurement and compliance, while building for the open network focuses on permissionless innovation and composability. The true future convergence is likely at the shared settlement layer (public blockchains), not in one system subsuming the other.

Foresight NewsHá 27m

Will DeFi and TradFi Ultimately Merge? a16z Challenges Mainstream Market Predictions

Foresight NewsHá 27m

The Controversial Issue of the CLARITY Act in the Digital Markets: Should Stablecoins Be Allowed to Generate Yield?

Controversy Over the CLARITY Act: Should Stablecoins Be Allowed to Generate Yield? This article examines the ongoing debate in U.S. regulation regarding whether stablecoins should be permitted to generate interest for holders. It traces the regulatory evolution from the GENIUS Act, which imposed a blanket prohibition on issuer-paid stablecoin yield to protect traditional banking, to the recent bipartisan Tillis-Alsobrooks compromise on the CLARITY Act. The compromise introduces a key distinction: strictly prohibiting "passive yield" (rewards for merely holding) while potentially allowing "activity-based yield" tied to specific on-chain actions like providing liquidity or governance participation. A critical "economic equivalency test" is proposed to determine if a reward is functionally equivalent to a bank deposit interest payment. The analysis highlights significant implementation challenges for regulators. It questions their capacity to perform the nuanced, substantive reviews required to differentiate between genuine activity-based rewards and cleverly disguised passive interest schemes within complex DeFi protocols and smart contracts. The article concludes that this shift represents a move from regulating specific entities ("entity-based regulation") to overseeing entire financial behaviors and ecosystems ("ecosystem-based regulation"). This transition, while aiming for market stability, may signal the end of the crypto industry's earlier unconstrained "wild west" era.

marsbitHá 44m

The Controversial Issue of the CLARITY Act in the Digital Markets: Should Stablecoins Be Allowed to Generate Yield?

marsbitHá 44m

Founder of Real Vision: We Are Living in the Era of Exponential Growth

Real Vision founder Raoul Pal argues that humanity is now in an "Age of Exponential Growth," a reality the human brain's linear intuition struggles to comprehend. The core drivers are the convergence of multiple, mutually-reinforcing technological curves: Artificial Intelligence, robotics, solar & storage, biotechnology, and blockchain networks. He notes that while his 2021 analysis correctly identified fiat currency debasement and assets like Bitcoin as inflation hedges, he underestimated the scale of change. Beyond monetary liquidity, a more profound force is at work: these key technologies have moved from theoretical promise into simultaneous, accelerating commercialization. They are no longer growing in parallel but are fusing, creating a "double exponential" growth curve. AI and robotics create an "artificial labor supply," breaking the cycle of debt-driven growth needed to offset aging demographics. Energy, particularly solar power guided by Wright's Law, is seeing collapsing costs, removing a key bottleneck for compute-hungry AI. Cryptocurrencies are evolving from monetary assets into the essential, programmable settlement layer for transactions between future AI agents. This fusion creates a feedback loop: AI optimizes energy grids, cheaper energy powers more compute, which builds better AI, and crypto networks settle the transactions. This leads to "Reed's Law" playing out at scale, where intelligent nodes (AI agents) form and re-form groups at machine speed, creating network value that grows at 2^n. Pal concludes that the critical question is no longer how to protect jobs from machines, but how to own a share of the machines and their foundational infrastructure. He sees the 2030-2032 period as a potential "Economic Singularity" where these trends fully merge, fundamentally transforming the economy. The data, he asserts, shows this is not a bubble but an observable, quantifiable new era.

Foresight NewsHá 1h

Founder of Real Vision: We Are Living in the Era of Exponential Growth

Foresight NewsHá 1h

Trading

Spot
活动图片




