Strategy Watch #3

insights.glassnodePublicado em 2026-04-23Última atualização em 2026-04-23

Resumo

Strategy Watch #3 provides institutional analysis of digital asset fund performance and allocation trends. Key findings show gradual stabilization in capital flows, with Bitcoin and ETH outflows improving from February lows but remaining negative. BTC ETF and DAT flows turned positive mid-March before moderating, while Ethereum flows followed more cautiously. DeFi TVL on Ethereum recovered significantly, nearing neutral by month-end. However, BTC CME basis yield turned negative, eliminating carry trade opportunities. The report also covers performance dispersion among strategies, a deep dive into quant trend following, on-chain vault yields, manager sentiment, and new institutional entries, including a $6B pension fund increasing crypto exposure.

The full report is freely available in PDF format.

Download PDF version

Welcome to Strategy Watch #3

Strategy Watch was built to address a clear demand for high-signal, impartial analysis of fund-level performance and allocation trends in digital assets.

Our objective is straightforward — to make Strategy Watch a must-read monthly publication for the digital asset investment community.

Funds and allocators that contribute data and insights help shape a more complete and valuable view of the landscape. If you have insights, data, or allocation updates worth sharing, we welcome your contribution.

Present your latest initiatives and updates to a curated audience of institutional allocators.

Share updates ↗

Inside the Latest Strategy Watch

The report is structured across six core sections, each focused on a distinct dimension of institutional activity in digital assets:

01 Institutional Flow Monitor | Early stabilization as BTC/ETH outflows improve and ETF demand recovers, but conviction in spot markets remains under pressure.

02 Fund and SMA Performance | Market-neutral strategies delivered consistent gains; directional performance remains highly dispersed.

03 Strategy Deep Dive: Quant Trend Following | What’s driving quant trend performance in a difficult environment for directional strategies? Hear directly from a fund manager.

04 On-chain Vault Performance | Are ETH curators underperforming ETH staking yield?

05 Manager Monitor | Find out how more than 300 managers are expecting the crypto market to perform over the next three months.

06 Allocation Updates | A $6B pension fund increases crypto exposure as new funds and institutional strategies continue to launch.

in partnership with

The Premier Digital Assets Allocator Platform. Learn more


Institutional Flow Monitor

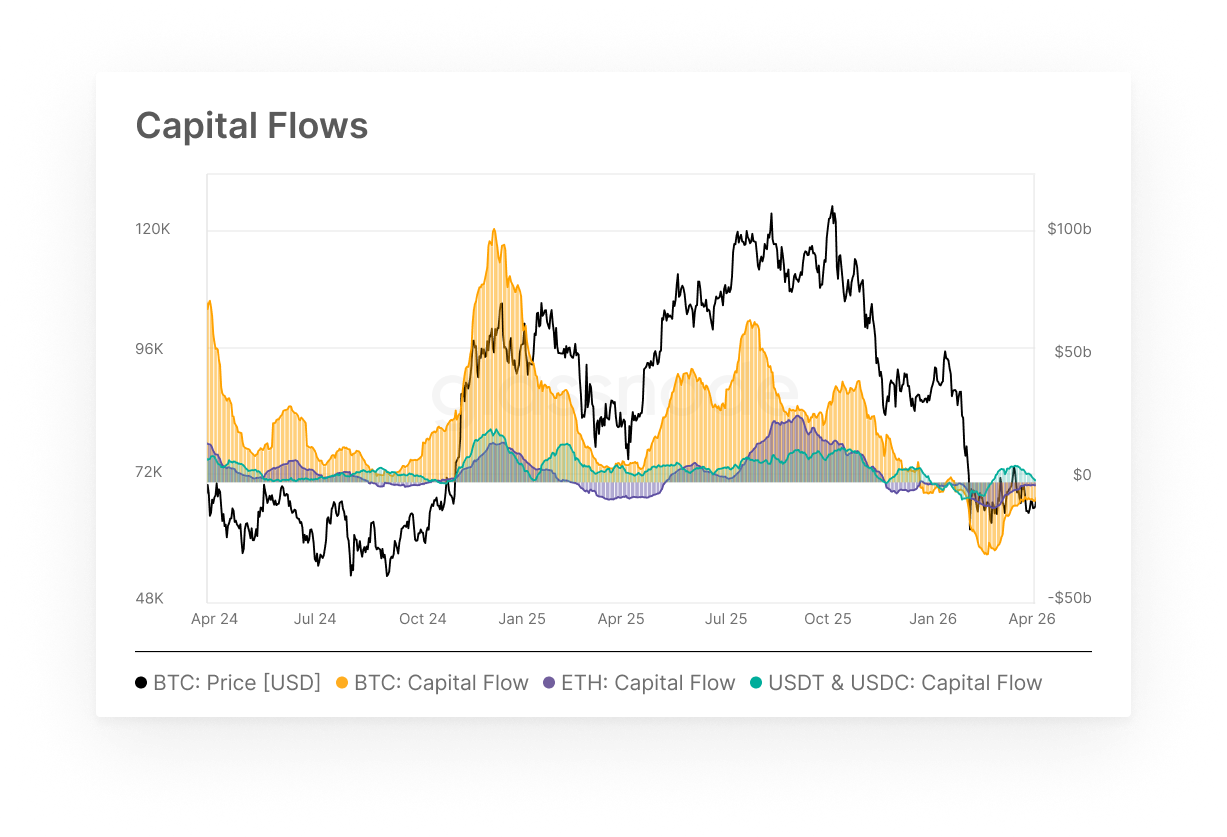
  • BTC and ETH capital flows remained negative through March but continued to recover from February lows, while stablecoin inflows moderated alongside the broader stabilization.

Bitcoin and Ethereum continued to register net outflows through March, with capital flows closing the month at -$7.0B and -$1.6B respectively, a notable improvement from the -$9.6B and -$3.2B readings seen in mid-February. Stablecoin inflows also moderated to +$2.6B by month-end, easing from the +$6.2B peak earlier in March. The overall picture is one of gradual stabilization rather than recovery, with the acute phase of institutional de-risking losing momentum but conviction in spot assets remaining under pressure.

ETF & DAT Net Flows

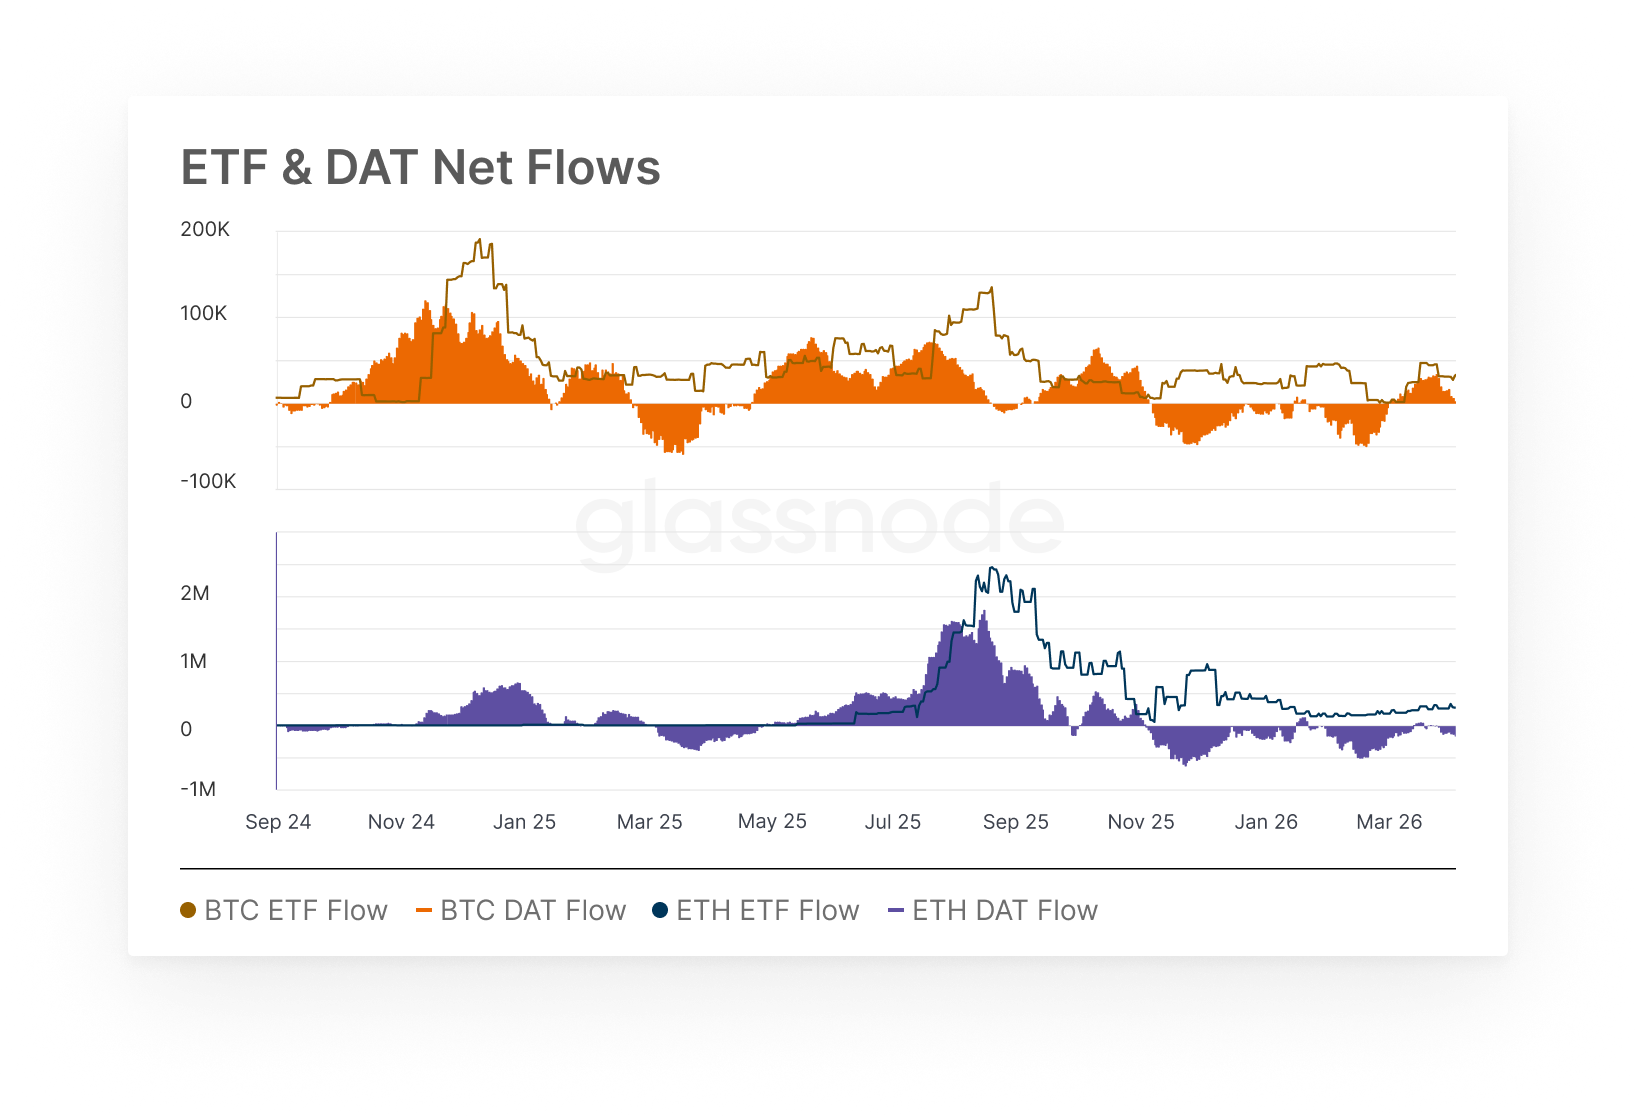
  • BTC ETF and DAT flows swung decisively positive through March, with ETH channels following at a more measured pace before both eased into month-end.

Bitcoin ETF and DAT flows finally turned positive through March, reaching intra-month highs of +30.6k BTC and +46.8k BTC respectively mid-month before settling back to +17.6k BTC and +30.9k BTC by month-end. Ethereum flows mirrored the directional shift with less intensity, as ETF flows reached +46.6k ETH and DAT flows peaked at +295.9k ETH before easing to +261.9k ETH at close. The mid-month surge followed by minor pullback, suggests demand remains sensitive to wider market conditions, rather than a true sustained structural shift in institutional positioning.

DeFi TVL & Stablecoin Cap

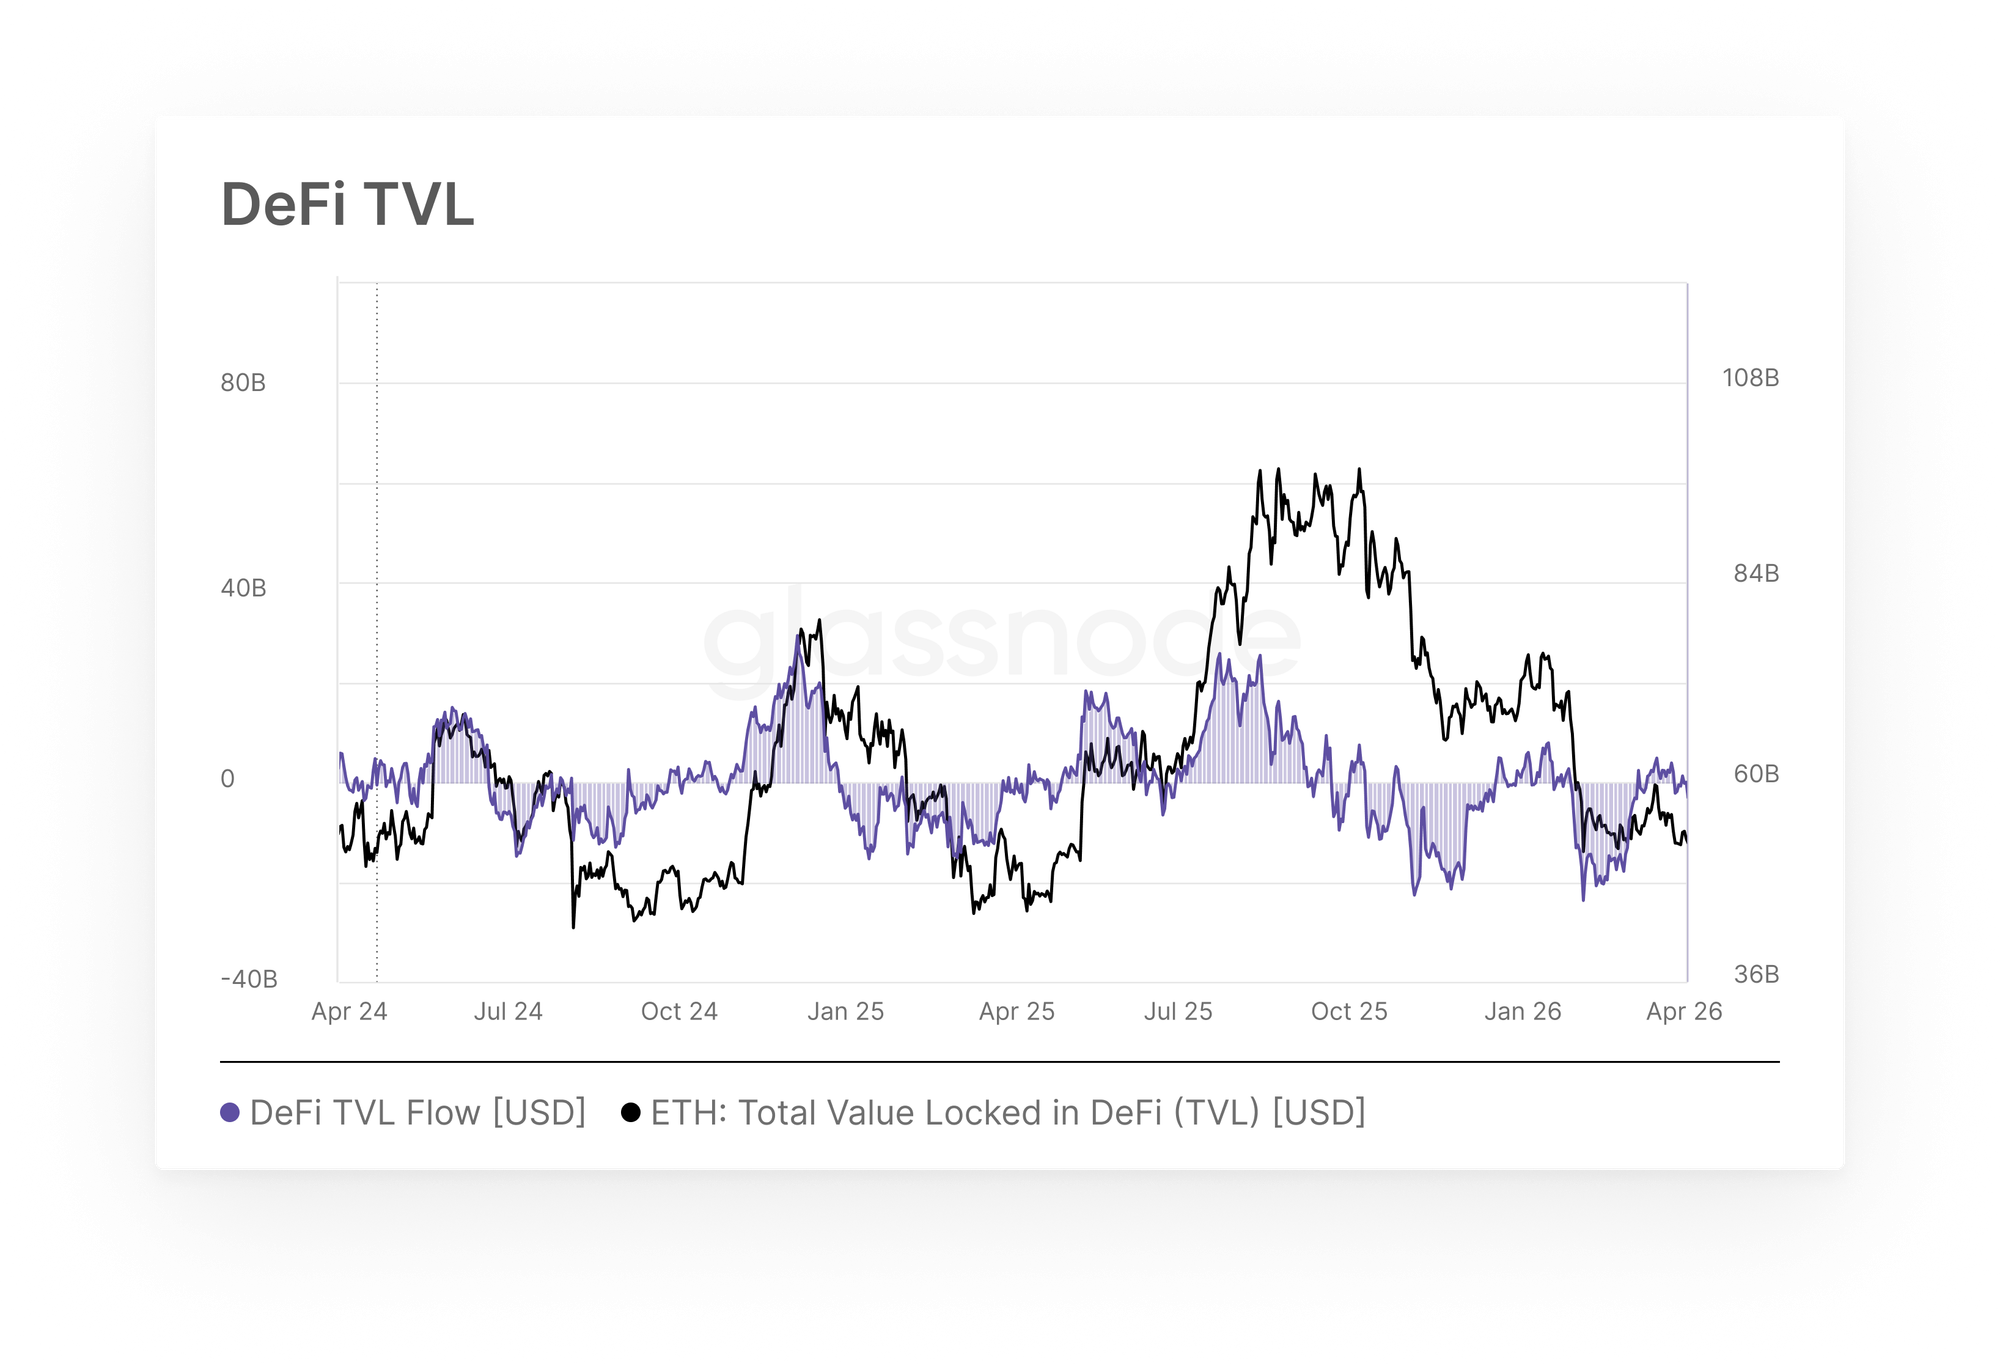
  • DeFi TVL flows on Ethereum staged a significant recovery through March, reversing from peak February outflows to near-neutral territory by month-end.

After registering peak monthly outflows of $17.8B at end of February, Ethereum DeFi TVL flows recovered sharply through March, turning positive in mid-month and closing the period near neutral at -$0.75B. The pace of recovery was notable, with flows moving from double-digit outflows in early March to briefly positive readings around $4.9B by mid-month before settling back. While the trend shift is meaningful, a single month of stabilization is insufficient to declare a reversal of the broader contraction that has persisted since August 2025, and sustained inflows would be required to confirm a genuine return of allocator conviction in on-chain yield strategies.

CME Basis Yield

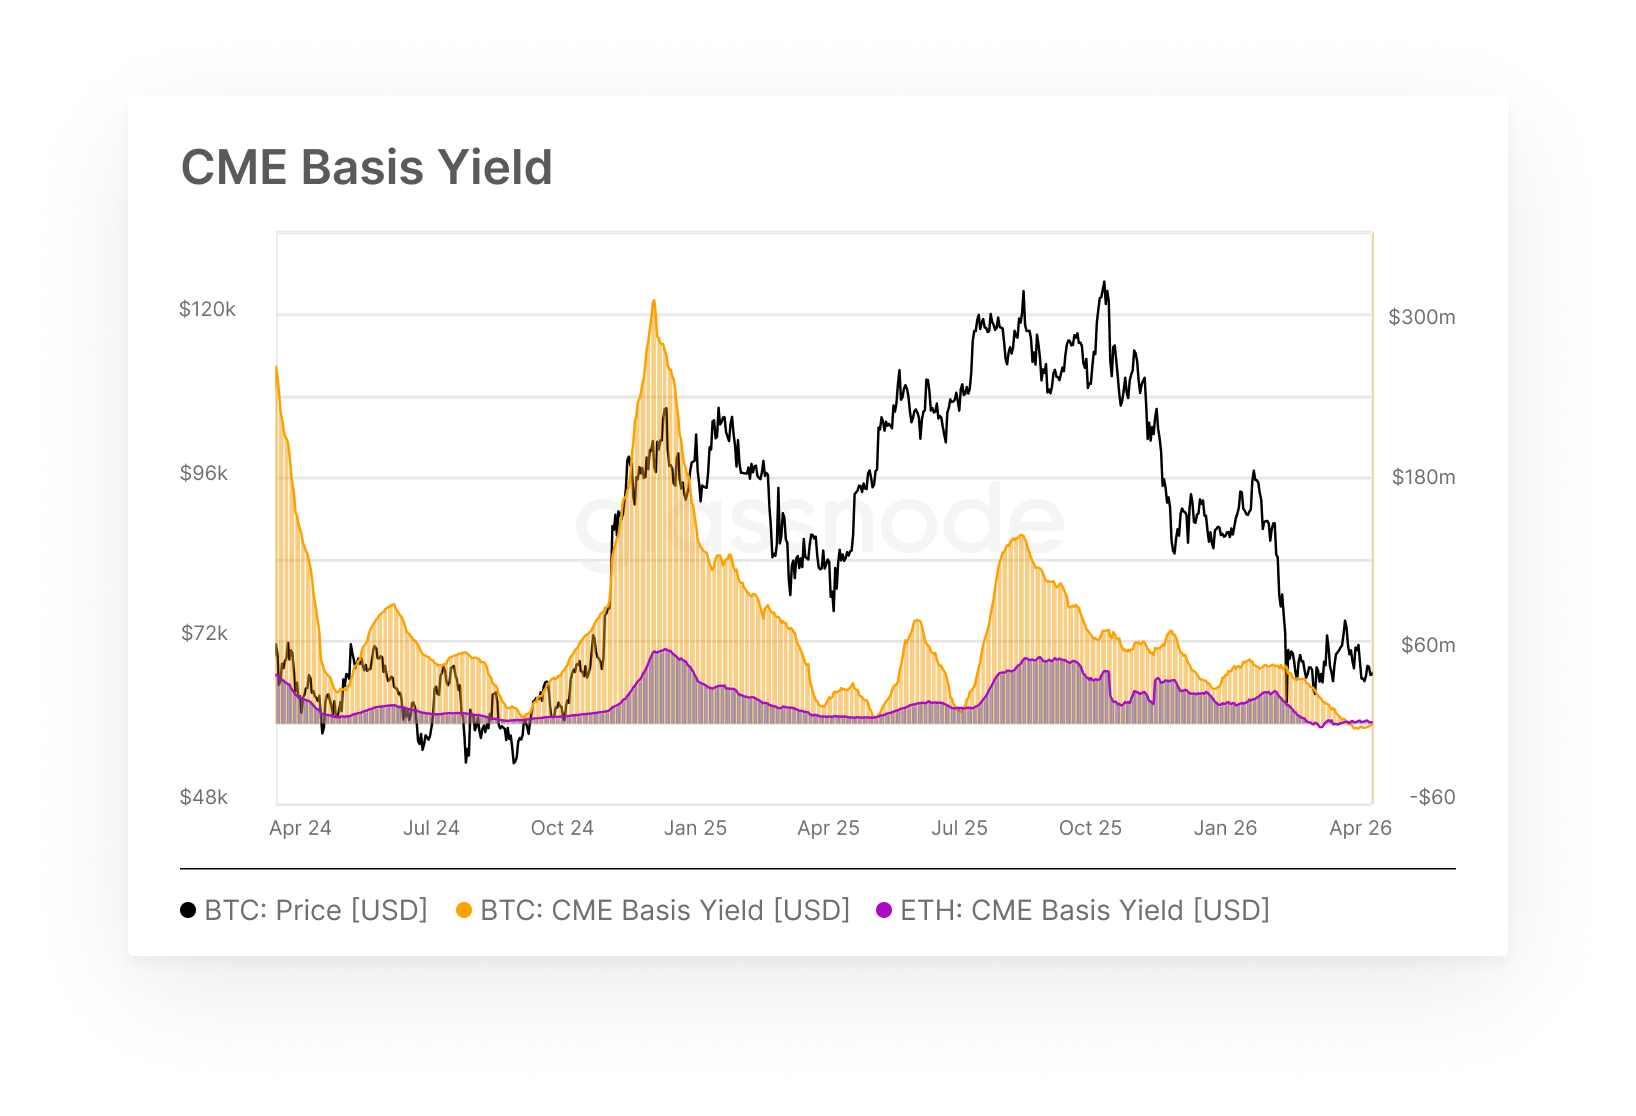
  • BTC CME basis yield turned negative through March, erasing the carry trade entirely, while ETH basis yield remained subdued but showed tentative signs of recovery by month-end.

Here we measure return available to institutions running cash-and-carry trades. After compressing through February to $17.3M/month, BTC basis yield crossed into negative territory mid-March and closed the month at -$3.9M, reflecting a full inversion of the carry premium. This signals futures are trading at a discount to spot, removing the economic rationale for market-neutral strategies entirely. ETH basis yield, already negative at end of February, oscillated in a narrow range before recovering modestly to +0.9M by month-end. Taken together, the carry environment for both assets remains structurally challenged, with meaningful recovery contingent on a sustained rebuilding of futures premium above spot.


Disclaimer: This report does not provide any investment advice. All data is provided for information and educational purposes only. No investment decision shall be based on the information provided here and you are solely responsible for your own investment decisions.
Exchange balances presented are derived from Glassnode’s comprehensive database of address labels, which are amassed through both officially published exchange information and proprietary clustering algorithms. While we strive to ensure the utmost accuracy in representing exchange balances, it is important to note that these figures might not always encapsulate the entirety of an exchange’s reserves, particularly when exchanges refrain from disclosing their official addresses. We urge users to exercise caution and discretion when utilizing these metrics. Glassnode shall not be held responsible for any discrepancies or potential inaccuracies. Please read our Transparency Notice when using exchange data.

Perguntas relacionadas

QWhat is the main objective of the Strategy Watch publication?

AThe objective is to make Strategy Watch a must-read monthly publication for the digital asset investment community by providing high-signal, impartial analysis of fund-level performance and allocation trends.

QWhat was the trend in Bitcoin and Ethereum capital flows through March as reported?

ABitcoin and Ethereum continued to register net outflows through March, closing at -$7.0B and -$1.6B respectively, which was an improvement from the -$9.6B and -$3.2B readings seen in mid-February.

QHow did the performance of market-neutral strategies compare to directional strategies?

AMarket-neutral strategies delivered consistent gains, while directional performance remained highly dispersed.

QWhat happened to the BTC CME basis yield in March?

AThe BTC CME basis yield turned negative through March, erasing the carry trade entirely and closing the month at -$3.9M, indicating futures were trading at a discount to spot.

QWhich section of the report discusses the performance of on-chain ETH vaults compared to staking yield?

ASection 04, titled 'On-chain Vault Performance', addresses whether ETH curators are underperforming ETH staking yield.

Leituras Relacionadas

Fei-Fei Li's Team Clarifies the Concept of 'World Models', Sora Merely a Renderer

"World Models" has become a widely used yet confusing term in AI. To address this, a team led by Fei-Fei Li and World Labs proposed a functional taxonomy based on the Partially Observable Markov Decision Process framework. This taxonomy categorizes systems called "world models" into three distinct projections: Renderers, Simulators, and Planners. Renderers, like OpenAI's Sora and other video generation models, focus on producing photorealistic visual outputs for human perception. They prioritize visual fidelity over physical accuracy. Simulators, such as NVIDIA Omniverse, aim to compute precise future environmental states for computational tasks like engineering analysis or digital twins. Planners, like Vision-Language-Action models, take in observations and goals to output executable actions for robots or agents. The article clarifies that most current "world models," including Sora, are primarily Renderers. They generate convincing visuals but lack the core ability to simulate state transitions based on actions, a key requirement for a true world model in classic reinforcement learning definitions. This conceptual confusion has practical implications, leading to potential misalignment in technology selection, investment, and public understanding of AI capabilities. Clear categorization is crucial. It helps enterprises avoid costly mistakes (e.g., using a renderer for robot training), allows investors to accurately assess markets, and enables researchers to build comparable benchmarks. While future systems may integrate these functions, recognizing current boundaries is essential for honest assessment and progress.

marsbitHá 20m

Fei-Fei Li's Team Clarifies the Concept of 'World Models', Sora Merely a Renderer

marsbitHá 20m

Bloomberg Uncovered: How Do China's Wealthy Circumvent the Annual $50,000 Limit to Transfer Assets?

**Summary: How Wealthy Chinese Circumvent $50,000 Annual Foreign Exchange Limits** Despite China's strict capital controls, including an annual $50,000 per person foreign exchange quota, an estimated $150 billion in funds still leaves the country annually via various gray and underground channels. This report outlines the evolution of China's "capital wall" and the methods used to bypass it. **The Evolving Capital Controls:** * **Foundation (1994):** The system of "current account convertibility with strict capital account controls" was established. * **Quota Set (2007):** The $50,000 individual annual forex purchase limit was formalized. * **Crackdown Begins (2015-2017):** Following market volatility, enforcement tightened. Banks were required to scrutinize transactions, and channels like using UnionPay cards for Hong Kong insurance premiums or buying overseas property were blocked. * **Digital & Legal Upgrades (2024-2026):** Enhanced algorithms now flag suspicious patterns (e.g., "smurfing"). The Common Reporting Standard (CRS) provides Chinese tax authorities with data on citizens' offshore accounts. Unlicensed cross-border brokers have been targeted. **Five Primary Methods for Moving Capital:** 1. **Underground Banking / "Hawala" (Duiqiao):** The largest-scale method. No money crosses borders. Clients pay RMB to a domestic account; an overseas associate deposits equivalent foreign currency into the client's offshore account. Risks include high fees, account freezes, and legal penalties. 2. **"Smurfing" or "Ant Moving":** Using multiple individuals' $50,000 quotas to pool funds for one offshore recipient. Increasingly detected by anti-money laundering algorithms. 3. **Trade Invoice Manipulation:** Businesses over-invoice imports or under-invoice exports via offshore shell companies, creating a pretext to transfer excess funds abroad under the guise of trade. 4. **Channel Migration:** After a crackdown on internet brokers, funds flow toward more compliant but costly channels like major banks' cross-border wealth management services or Qualified Domestic Institutional Investor (QDII) quotas. 5. **Structural Arrangements:** High-net-worth individuals use complex, high-cost legal structures involving offshore trusts, insurance, and investment migration programs to transfer asset ownership. **Regulatory Response: Focusing on People, Not Just Money** The current strategy extends oversight from enterprises to **individual residents**. Tools like CRS allow retroactive visibility into offshore assets. Cryptocurrencies, once seen as a potential loophole, are now actively monitored and prosecuted as an illegal channel. The underlying driver remains: with significant wealth concentrated among millions of affluent households seeking diversification amid domestic economic shifts, the incentive to move assets offshore persists despite regulatory barriers.

marsbitHá 40m

Bloomberg Uncovered: How Do China's Wealthy Circumvent the Annual $50,000 Limit to Transfer Assets?

marsbitHá 40m

Trading

Spot
Futuros
活动图片