SK Hynix Q2 Profit Soars Sixfold, Still 'Misses Expectations'; Secures Long-Term Agreements with 10 Clients, HBM4 to Accelerate Volume Ramp in Second Half

marsbitPublicado em 2026-07-29Última atualização em 2026-07-29

Resumo

SK Hynix reported record-breaking Q2 2026 financial results, with operating profit soaring 557% year-over-year to 60.5 trillion won and revenue increasing 257% to 79.3 trillion won, driven by strong demand for AI server memory, HBM, and enterprise SSDs. The operating profit margin reached 76.3%. However, both figures fell short of analyst expectations, leading to a drop in its share price. The company attributed the earnings miss to three factors: a high sales mix of HBM, which limited upside from surging prices of general-purpose DRAM; a deceleration in memory price increases compared to Q1; and long-term supply agreements (LTAs) with major customers that lock in prices, reducing sensitivity to spot market gains. SK Hynix has signed LTAs with about 10 clients, covering roughly half of its sales. Despite the miss, the company remains optimistic about AI-driven demand. Its net profit of 93.9 trillion won was significantly boosted by a one-time gain from the partial sale of its Kioxia stake. Financially, it strengthened its cash position, ending the quarter with a net cash position of 69.4 trillion won. Looking ahead, SK Hynix plans capital expenditures at the high end of its 40-50 trillion won range for 2026 to expand capacity for HBM and advanced NAND products, including accelerating the mass production of HBM4 in the second half of the year.

Author: Bao Yilong

SK Hynix's Q2 operating profit hit a record high, yet still fell short of analyst expectations, further deepening market concerns over whether AI chip demand can sustain high valuations.

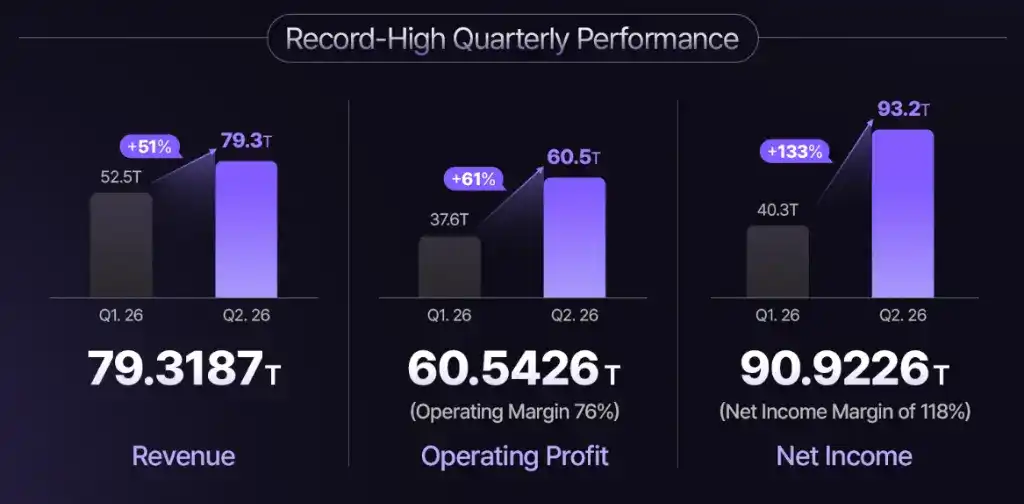
After the U.S. market closed on July 28, SK Hynix released its Q2 earnings report, with operating profit soaring 557% year-on-year to 60.5 trillion won, and revenue increasing 257% to 79.3 trillion won, both metrics setting new quarterly records.
However, both figures missed analyst expectations. The market had previously forecast operating profit at approximately 64.2 trillion won and revenue at around 83.9 trillion won.

Regarding demand outlook, SK Hynix maintains an optimistic view. SK Hynix stated it has finalized long-term agreements with about 10 customers and continues to negotiate with other major industry clients to enhance operational efficiency and strengthen mid- to long-term business stability and sustainable growth foundations.

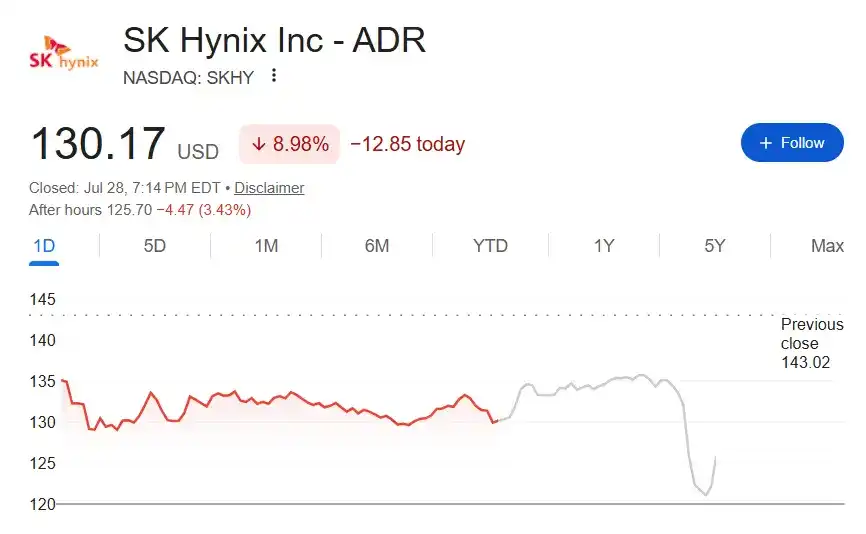
Since June this year, SK Hynix has lost over $500 billion in market capitalization, with a one-month slide at its deepest point erasing about 45% of its stock value. Following the earnings release, SK Hynix ADRs fell more than 5% after-hours, and its local Korean shares fell 4.5% pre-market.
In absolute numbers, SK Hynix's Q2 almost epitomizes the memory industry's super cycle.

In Q2, the company's revenue was 79.3187 trillion won, an increase of about 257% from 22.232 trillion won a year earlier, and also up over 50% from 52.5763 trillion won in Q1. Operating profit was 60.5426 trillion won, a 557% increase from 9.2129 trillion won a year ago, and up about 61% from 37.6103 trillion won in Q1.
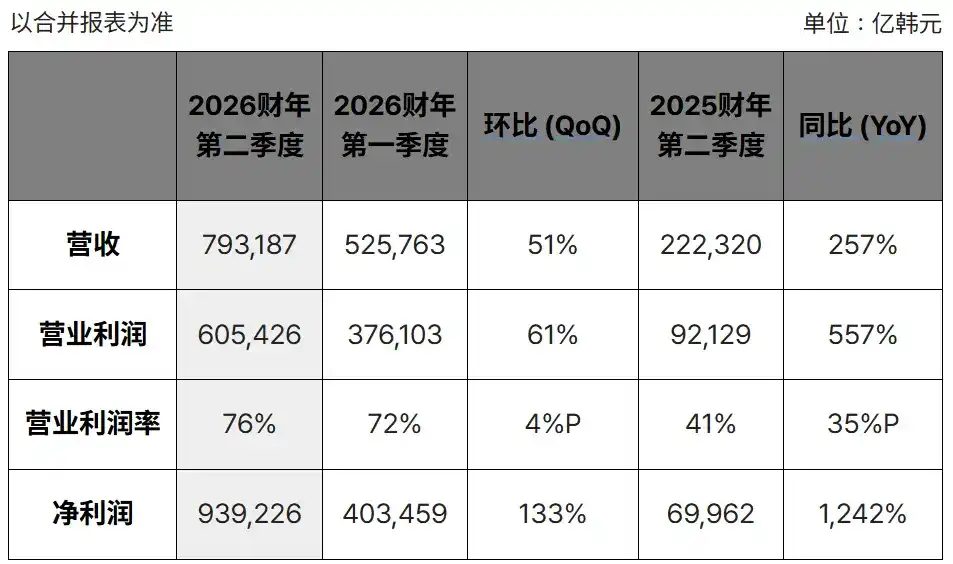
Profitability was even more remarkable. The Q2 operating margin reached 76.3%, up from 71.5% in Q1.

Data shows the company's Q2 gross margin reached 83%. This indicates that the prices and demand for high-value-added products like AI server memory, HBM, and eSSD have propelled SK Hynix to extremely high-profit levels.

Net profit even reached 93.9226 trillion won, with a net margin of 118%. However, this figure is not entirely from core operations, as it was significantly boosted by one-time investment gains.

In Q2, the company recognized non-operating income of 62.166 trillion won from the partial sale of its stake in Kioxia, bringing pre-tax profit to 122.7084 trillion won. This led to a substantial year-on-year increase in net profit, but its sustainability is weaker than operating profit.

SK Hynix's failure to meet market expectations this time stems from three structural factors.

First, the high proportion of HBM (High Bandwidth Memory) sales actually limits profit growth potential. The main driver of the sharp increase in profits across the semiconductor industry currently comes from the surge in prices of traditional commodity memory. SK Hynix's higher exposure to HBM means it benefits relatively less from this trend.

Second, memory price increases slowed significantly in Q2. According to SK Hynix, Q2 sequential price increases for commodity DRAM were about 30%, and for NAND flash in the mid-range of the 50% to 60% band, both lower than the approximately 60% for DRAM and 70% for NAND in Q1.

Third, long-term supply agreements (LTAs) signed with major customers locked in sales prices, weakening the earnings elasticity from spot price increases.
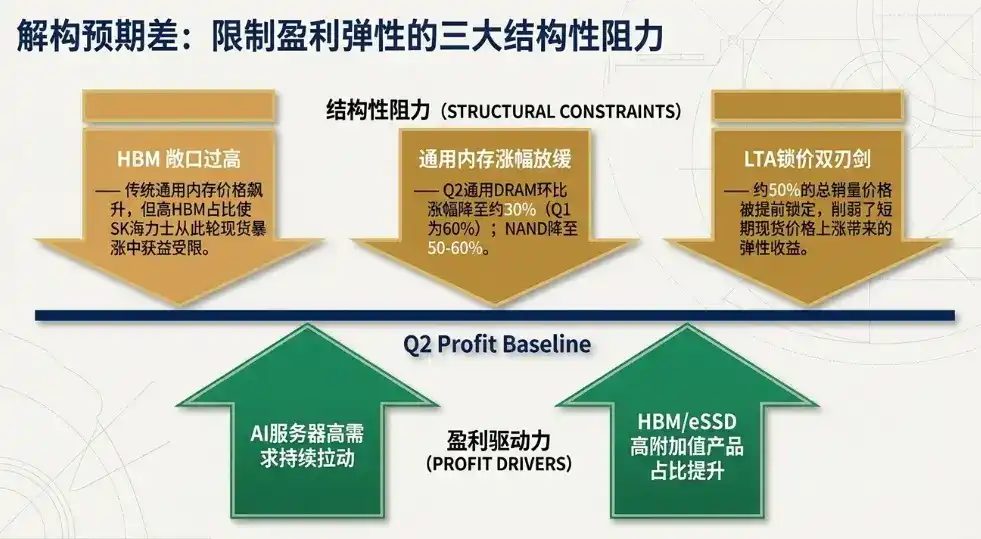
Reports citing informed sources revealed that SK Hynix has locked in roughly 50% of its total sales volume through long-term agreements. The company stated it has now completed long-term contract negotiations with about 10 customers and received additional supply requests from multiple large tech companies.

Josh Gilbert, Chief Analyst at eToro for APAC and the Middle East, pointed out:

When you are the dominant supplier of the high-bandwidth memory that powers Nvidia's chips, the AI boom directly reflects on your profit statement. This means the market is unlikely to focus solely on the headline numbers; the more critical question is whether the profit margins and guidance can justify the recent stock performance.

Beyond HBM, the NAND business is also benefiting from the recovery cycle.
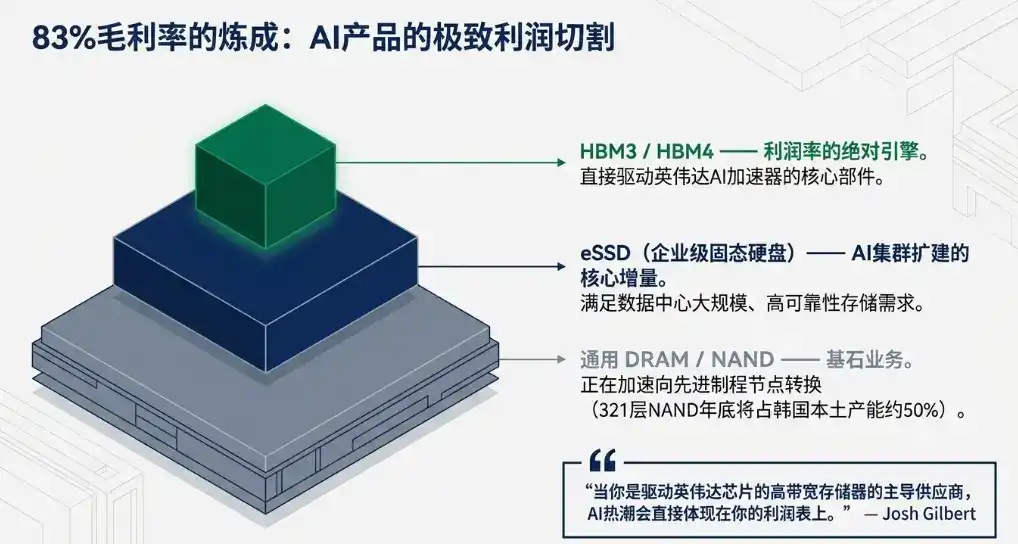
The company said that for NAND, it is accelerating the transition to advanced process nodes to strengthen its high-capacity, high-performance product portfolio. The 321-layer product has become the highest contributor to total production, and the company plans to expand its share of domestic Korean capacity to about 50% by year-end.

Enterprise SSDs remain a significant growth driver. AI data centers require not only HBM and server DRAM but also large-scale, high-performance, high-reliability storage devices. As cloud providers and large tech companies expand AI clusters, eSSD demand is strengthening concurrently, helping SK Hynix improve the quality of its NAND product mix.

This is also what distinguishes this memory cycle from previous ones: past upturns were often driven by consumer electronics like smartphones and PCs, whereas current AI server demand simultaneously drives DRAM, HBM, and eSSD, making supply tightness more structural.

Financially, SK Hynix's Q2 cash flow improved notably.
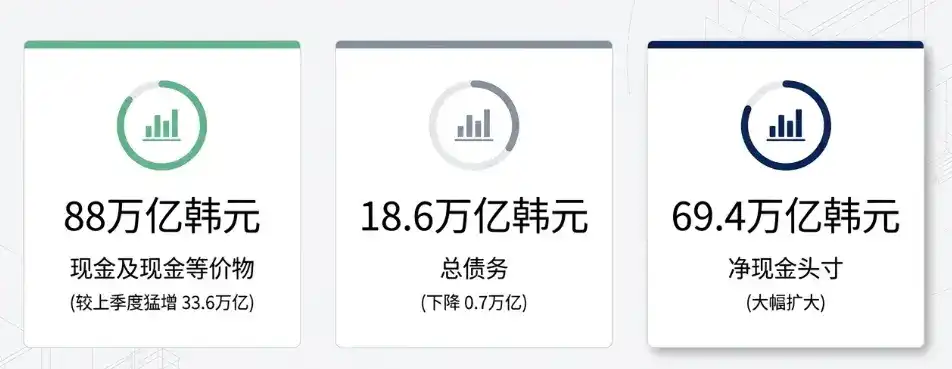
As of the end of Q2, the company's cash and cash equivalents reached 88 trillion won, an increase of 33.6 trillion won from the previous quarter; total debt decreased by 0.7 trillion won to 18.6 trillion won, and the net cash position expanded to 69.4 trillion won.

The company stated that thanks to record profits and cash generation, financial flexibility has significantly enhanced.

However, strong demand also implies greater capital expenditure pressure. SK Hynix expects 2026 capital expenditures to reach the upper end of the 40 to 50 trillion won range. The company is accelerating the mass production timeline for M15X and preparing to rapidly expand capacity once the Yongin Phase 1 cleanroom becomes operational in early 2027.

Additionally, the company mentioned medium- to long-term investment plans including the P&T7 advanced packaging facility, M17 NAND production base, and new semiconductor clusters.

These projects will be advanced in phases based on customer demand and investment efficiency. For investors, the key question will be whether SK Hynix can maintain capital expenditure discipline and avoid excessive supply expansion eroding margins in the next phase while AI demand remains robust.


Perguntas relacionadas

QAccording to the article, SK Hynix's Q2 2026 operating profit increased significantly but missed analyst estimates. What were the actual figures versus the market expectations?

ASK Hynix's actual Q2 operating profit was 60.5426 trillion won, and revenue was 79.3187 trillion won. Market expectations were for an operating profit of approximately 64.2 trillion won and revenue of about 83.9 trillion won.

QThe article mentions SK Hynix secured long-term agreements (LTAs) with several customers. How many customers have finalized these agreements, and what is the estimated impact on their sales volume?

ASK Hynix has finalized long-term agreements with about 10 customers. According to reports, such LTAs cover approximately 50% of the company's total sales volume.

QWhat are the three main structural reasons cited in the article for SK Hynix's Q2 results falling short of market expectations?

AThe three main reasons are: 1) A higher proportion of HBM sales, which limited profit growth as it benefited less from surging traditional memory prices. 2) A significant slowdown in memory price increases during Q2 compared to Q1. 3) Long-term supply agreements (LTAs) locking in sales prices, reducing the benefit from rising spot prices.

QHow did the company's financial position change by the end of Q2, particularly regarding cash and debt?

ABy the end of Q2, SK Hynix's cash and cash equivalents increased to 88 trillion won (up 33.6 trillion won from the previous quarter). Total debt decreased slightly to 18.6 trillion won, resulting in a net cash position of 69.4 trillion won.

QWhat is the company's plan for capital expenditure in 2026 and its key investment projects mentioned in the article?

ASK Hynix expects its 2026 capital expenditure to be at the high end of the 40-50 trillion won range. Key projects include accelerating the mass production timeline for the M15X fab, preparing for the Yongin complex (with Phase 1 cleanrooms to be operational in early 2027), and developing the P&T7 advanced packaging facility and M17 NAND production base.

Leituras Relacionadas

Interview with Robinhood Executive: Meme + Tokenized US Stocks as "Barbell" Customer Acquisition Strategy, All Business Lines Achieve Hundreds of Millions in Revenue

Interview with Robinhood executive Johann Kerbrat reveals the company's "barbell" customer acquisition strategy for its new Robinhood Chain, combining meme tokens with tokenized stocks. Three weeks after mainnet launch, the chain has seen over $3B in weekly DEX volume and 105M transactions. Kerbrat explains the logic behind the permissionless chain: meme tokens attract DeFi users, while tokenized real-world assets (RWA), currently over 90 US stocks and ETFs accessible in 120+ countries, serve global users. The goal is to bring Robinhood's 27 million funded accounts on-chain by simplifying DeFi with a user-friendly interface, exemplified by features like Robinhood Earn which offers yield without requiring wallet management. Built on Arbitrum's technology stack for its speed, low cost, and Ethereum's security, the chain focuses on financial products like Earn, spot trading, and perpetuals. Kerbrat downplays direct competition with platforms like Base, emphasizing the goal of expanding the overall market for on-chain assets. He details selective partnerships (e.g., Morpho, Lighter) based on compliance, unique UX, and differentiation. While regulatory clarity is pending for US perpetuals, the expansion continues via Bitstamp in Europe. Finally, Kerbrat positions Robinhood as a "super app" integrating stocks, options, crypto, banking, and AI trading, with all major business lines generating hundreds of millions in revenue. For the chain, current priority is driving adoption over maximizing gas fee revenue.

marsbitHá 53m

Interview with Robinhood Executive: Meme + Tokenized US Stocks as "Barbell" Customer Acquisition Strategy, All Business Lines Achieve Hundreds of Millions in Revenue

marsbitHá 53m

Fidelity Q3 Report: BTC, ETH, and SOL Continue to Build Bottoms; How Much Further Will This Crypto Bear Market Go?

Fidelity's Q3 Crypto Signal Report analyzes the current bear market, noting Bitcoin (BTC), Ethereum (ETH), and Solana (SOL) are in a prolonged bottoming phase. Key indicators like the weighted Net Unrealized Profit/Loss (NUPL) have turned negative (-0.01), signaling the market is slightly below its aggregate cost basis, with BTC acting as the primary stabilizing asset. BTC's dominance has risen to 68%, indicating a lack of capital rotation to other digital assets. Performance has been weak across the board, with BTC, ETH, and SOL down significantly year-to-date. Market sentiment is depressed, exacerbated by substantial outflows from spot ETPs and a challenging macro environment. The report compares the current ~203-day downtrend to historical ~300-day bottoming cycles, suggesting the process may be two-thirds complete, with late 2026 as a potential timeframe to monitor. For Bitcoin, NUPL at 0.09 indicates cautious sentiment, while momentum signals remain negative. The Yardstick metric points to potential undervaluation relative to network security (hashrate). Ethereum's NUPL is deep in the "capitulation" zone at -0.43, a historically positive signal for future returns, though its momentum and network fee revenue are negative. Solana shows the deepest NUPL at -0.72 but demonstrates relative resilience in on-chain activity and stablecoin transfer volume. The report concludes that while several metrics are near historical capitulation levels, a definitive market bottom has not yet been established. The path forward likely involves continued consolidation, with BTC's relative strength and fundamental on-chain usage for ETH and SOL providing key areas for investor observation.

marsbitHá 1h

Fidelity Q3 Report: BTC, ETH, and SOL Continue to Build Bottoms; How Much Further Will This Crypto Bear Market Go?

marsbitHá 1h

Trading

Spot
活动图片