Semiconductors up 78% annually, software down 12% annually: The 'Liquidity Siphon' is playing out within tech stocks

marsbitPublicado em 2026-05-26Última atualização em 2026-05-26

Resumo

Semiconductor ETFs like SOXX have surged 78.5% year-to-date, while software ETFs like IGV have dropped 12.5%, creating a record performance gap exceeding 90 percentage points. This reflects a major "liquidity suction" within tech stocks, with capital flooding into semiconductors as software faces selling pressure. Driving the semiconductor boom are staggering capital expenditure plans from hyperscalers like Microsoft, Alphabet, Amazon, and Meta, whose combined 2026 capex is projected near $700 billion. This fuels demand for chips, with companies like SanDisk (up 426%), Intel (up 222%), and Micron (up 154%) leading the S&P 500. In contrast, major software firms like Microsoft, Adobe, and Salesforce are all down over 17% year-to-date. The software sector faces a dual challenge: capital is being redirected to semiconductors, and the rise of AI agents like Claude Code threatens traditional SaaS business models, triggering a narrative of AI displacement. Key unanswered questions remain: How long can hyperscalers sustain their massive capex, given potential free cash flow pressures? And will capital eventually rotate back into the deeply oversold software sector? While some analysts warn of a potential semiconductor bubble akin to the dot-com era, the sector's powerful momentum continues, making market timing exceptionally difficult.

Author: Claude, Deep Tide TechFlow

Deep Tide Introduction: The Semiconductor ETF (SOXX) has surged 78.5% year-to-date, while the Software ETF (IGV) has fallen 12.5% over the same period, creating a performance gap of over 90 percentage points, a historically extreme level.

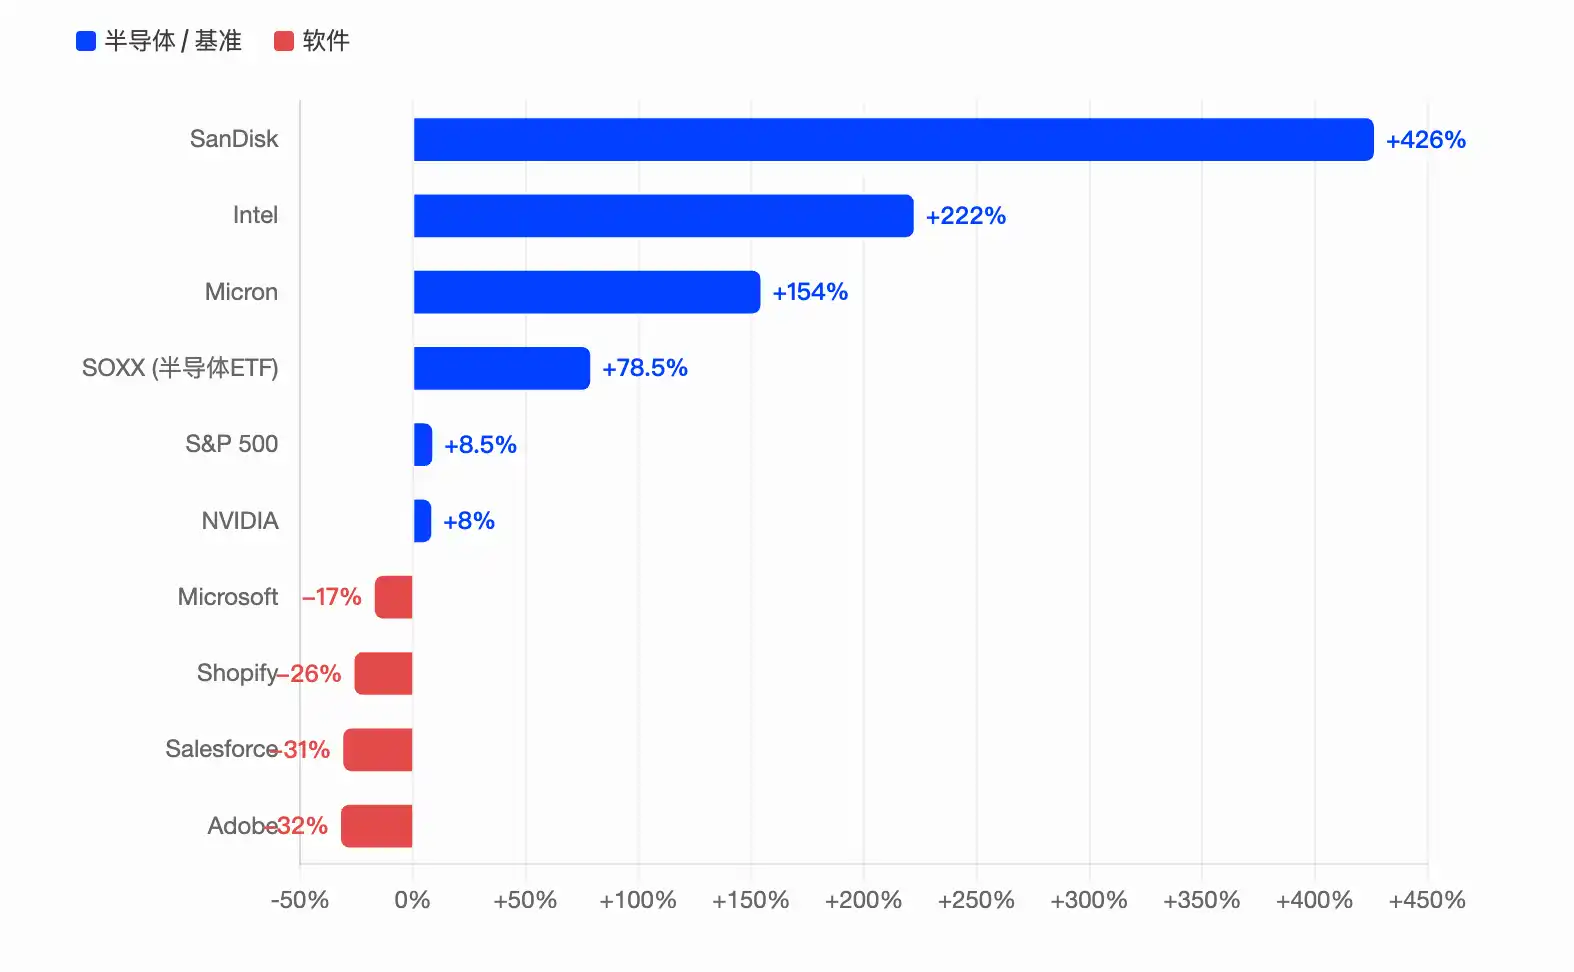
SanDisk leads the S&P 500 with a 426% annual gain, Intel has tripled, Micron is up 154%, while Microsoft, Adobe, and Salesforce have all dropped more than 17% year-to-date. The four hyperscale compute companies' combined capital expenditures for 2026 are nearing $700 billion. Capital is pouring into the chip supply chain like a black hole, while the software sector faces a double squeeze from AI displacement narratives and fund outflows.

Recently, a hot post on the Reddit investment forum overseas stated that semiconductor stocks are "basically a black hole sucking everything else in," which resonated widely.

Data confirms this intuition. As of the May 22nd close, the iShares Semiconductor ETF (SOXX) has returned 78.5% year-to-date, while the iShares Expanded Tech-Software ETF (IGV) has returned -12.5%. Two ETFs belonging to the same broad technology category show a year-to-date performance gap exceeding 90 percentage points.

According to Tickeron statistics, all software stocks in the S&P 500 are currently trading below their 200-day moving averages, while about 89% of semiconductor stocks remain above their 200-day moving averages. Both sectors fell in sync to the zero line during the 2022 bear market, after which their trajectories completely diverged. This split was not gradual but explosive.
SanDisk up 426% leads S&P 500, Intel's triple gain crushes AMD

The numbers are even more dramatic at the individual stock level.

According to Benzinga Pro data, SanDisk (SNDK) has risen about 426% year-to-date, making it the best-performing stock in the S&P 500 in 2026, following a 559% surge in 2025. This storage chip company, spun off from Western Digital, has seen NAND flash prices rise over 200% year-over-year driven by AI, with March quarter revenue growing 250% to $5.95 billion and non-GAAP gross margins reaching a high 78.4%.

According to 24/7 Wall Street, Intel (INTC) has risen about 222% year-to-date to $225, doubling AMD's gain. Intel's rebound comes from an extremely low base, coupled with progress on its 18A process node, rumors of Apple foundry orders, and yield improvement data disclosed by CEO Patrick Gelsinger in a CNBC interview. Short sellers have been severely squeezed; according to S3 Partners data, since the March 30th low point, Intel's market cap has increased over $440 billion, resulting in paper losses exceeding $12 billion for short sellers.

Micron (MU) has risen about 154% year-to-date, with a cumulative gain of 661% over the past 12 months. Earnings support this move; for the fiscal 2026 second quarter, revenue was $23.9 billion, up 196% year-over-year, with adjusted earnings per share of $12.20, far exceeding market expectations of $9.21. DRAM accounted for 79% of total revenue, with High Bandwidth Memory (HBM) being a key driver. SK Hynix Chairman Chey Tae-won even predicted that the memory chip shortage could last until 2030.

In contrast, NVIDIA (NVDA), the true "money printer" of AI compute, has risen about 8% to $15 year-to-date, performing far worse than the aforementioned second-tier semiconductor companies. According to The Motley Fool, NVIDIA's current forward P/E ratio is about 21.5x, almost on par with the S&P 500's 20.3x. This means the market is no longer paying a growth premium for NVIDIA; capital is instead flowing towards chip companies with lower valuations and greater potential upside.
$700 Billion in Capex: The Hyperscale Compute Companies' 'Arms Race'

Behind the semiconductor surge is real money.

According to data compiled by the Financial Times and multiple institutions, the combined capital expenditures for 2026 by the four hyperscale compute companies—Microsoft, Alphabet (Google's parent), Amazon, and Meta—are projected to be between $650 billion and $725 billion, nearly doubling from about $410 billion in 2025. This represents the largest concentrated infrastructure investment cycle in tech history.

According to Tom's Hardware, Jefferies analyst Brent Thill stated bluntly: "The AI economy is healthy. The bear thesis is garbage."

Specifically: Amazon leads with a single-quarter capex of $44.2 billion, with AWS growing 28%; Alphabet's Q1 capex was $35.67 billion, doubling year-over-year, with Google Cloud backlog jumping above $460 billion; Microsoft's calendar 2026 capex is projected at $190 billion, with about $25 billion attributed to price increases in memory chips and components; Meta raised its full-year capex guidance to $125-$145 billion.

According to statistics from Om Malik's blog, three of the hyperscale compute companies recorded significant non-cash investment gains in their Q1 earnings: Alphabet recorded $36.8 billion (primarily from Anthropic equity appreciation), Amazon recorded $16.8 billion, and Microsoft recorded $5.9 billion (from OpenAI). While capital expenditures are burning cash fiercely, the AI investment targets themselves are also appreciating.

Software Stocks Slaughtered by AI Displacement Narrative, IGV Posts Worst Drop Since 2008

The other side of the coin is the brutal collapse of software stocks.

According to The Motley Fool, after Anthropic released Claude Code in early 2026, the software sector experienced a sharp decline—the market's logic was not to reward AI innovation but to punish those SaaS companies potentially displaced by AI. IGV recorded its largest drop since 2008 at one point.

As of late May, Microsoft is down about 17% year-to-date, Adobe down about 32%, Salesforce down about 31%, and Shopify down about 26%. The S&P 500 Software & Services Index is about 21% below its 200-day moving average, the largest such deviation since June 2022. According to Goldman Sachs and other institutional data, short positions in mid-to-large software companies have surged sharply over the past three months, with cybersecurity and SaaS companies being the most heavily targeted areas for shorts.

Two layers of logic underlie this divergence. The first is direct capital siphoning: market liquidity is finite. When $700 billion in capex pushes chip stocks into parabolic moves, capital must be withdrawn from somewhere. As the author of that Reddit post said: "Fundamentally decent software companies just sit there or bleed slowly, while the semiconductor index goes vertical."

The second is a revaluation of the narrative. The rapid evolution of AI agents is prompting the market to re-evaluate the moats of SaaS business models: when AI can automate programming, form-filling, and customer service, how long can subscription models based on per-seat fees last? The Motley Fool points out that software companies likely to survive will need features like real data, proprietary workflows, and deep customer integration that are difficult for AI to replicate.

Cycle Peak or Structural Shift? Two Key Questions Remain Unanswered

That Reddit user ended the post with two questions, representing investors' ultimate doubts about whether the semiconductor rally can persist.

However, these two questions remain unanswered.

First: How long can the hyperscale compute companies' capital expenditures be sustained?

According to CNBC, Pivotal Research projects Alphabet's 2026 free cash flow will plunge nearly 90% from $73.3 billion in 2025 to $8.2 billion. Of Microsoft's $190 billion annual capex, $25 billion is consumed just by price increases in memory chips and components. These companies are betting future profits on AI revenue that has not yet fully materialized.

Second: Is software the next rotation target?

According to Bank of America's Chief Investment Officer Hartnett's previous judgment in the Flow Show report, software is one of the best contrarian long positions for Q2 2026, given the extreme deviation of the sector relative to its 50-day and 200-day moving averages.

However, this does not mean the semiconductor rally is over. The Philadelphia Semiconductor Index (SOX) recorded a historic streak of 18 consecutive daily gains on April 25th, rising about 45% during that period. According to Intellectia analysis, some veteran analysts are beginning to compare the current move to the 1999-2000 internet bubble, warning of a potential 25% to 30% correction. But SOX has been up in 22 of the past 23 trading days, setting 15 intraday record highs; this momentum is itself a signal.

As that Reddit user said: "I don't want to call a top because I've been slapped in the face too many times before. But the extreme concentration of gains in a single sector is starting to smell like the late stages of a cycle."


Perguntas relacionadas

QWhat is the central theme of the article regarding the performance of tech stocks in 2026?

AThe central theme is a 'liquidity siphon' or 'black hole' effect within tech stocks, where capital is being aggressively pulled from software stocks and funneled into the semiconductor sector, creating a historic performance gap.

QWhich two ETFs are highlighted to demonstrate the extreme divergence between the semiconductor and software sectors?

AThe iShares Semiconductor ETF (SOXX) and the iShares Expanded Tech-Software ETF (IGV) are highlighted. SOXX was up 78.5% year-to-date, while IGV was down 12.5%, a gap exceeding 90 percentage points.

QWhat is driving the massive capital expenditure from the 'hyperscale' companies, and what is the estimated total for 2026?

AThe massive capital expenditure is driven by the AI infrastructure 'arms race'. The combined capex of Microsoft, Alphabet (Google), Amazon, and Meta is estimated to be between $650 billion and $725 billion for 2026, nearly double the 2025 figure.

QWhat are the two main reasons given for the severe underperformance of software stocks?

AThe two main reasons are: 1) Direct liquidity siphoning, where funds flow from software into the surging semiconductor sector. 2) A valuation narrative shift, where AI's capabilities (like automated coding) threaten the traditional SaaS subscription business model, raising questions about its long-term viability.

QWhat two critical unresolved questions about the market trend does the article present at the end?

AThe two unresolved questions are: 1) How long can the hyperscale companies sustain their enormous capital expenditures? 2) Is software poised to become the next sector for a rotational rally, or is the semiconductor momentum still strong?

Leituras Relacionadas

Must-Watch Events Next Week|CLARITY Act Could Face Senate Vote; SpaceX, Circle to Report Earnings (8.3-8.9)

**Summary: Key Events and Developments to Watch (August 3-9)** The upcoming week is marked by significant financial disclosures, key legislative deadlines, and notable product updates. **Major Financial Events:** Several companies are scheduled to release their Q2 2026 earnings. American Bitcoin (ABTC) will report on August 3, followed by SpaceX and Hut 8 Mining Corp. on August 4, and Circle on August 5. Notably, a significant portion of SpaceX shares (up to 12% of total shares) will be unlocked on August 6 following their earnings release. **Key Legislative Deadline:** The U.S. Senate faces an August 7 deadline to secure 60 votes for the CLARITY Act, a bipartisan bill aiming to establish a federal regulatory framework for cryptocurrencies. The Senate may hold a full vote on the bill during the week. **Economic Data:** The U.S. July Non-Farm Payrolls report will be released on August 7, providing crucial labor market data. **Technology & Product Updates:** * **Shutdowns:** DeFi portfolio tracker Zapper and wallet app Ctrl Wallet will cease operations on August 3. * **Upgrades:** LayerZero will deprecate its v1 relayers on August 3. XRP Ledger's new version 3.3.0, featuring five new functions, is expected next week. * **AI:** Elon Musk announced that the advanced Grok 4.6 AI model is set for release around August 7. * **Bitcoin:** The BIP-110 forced signaling for a potential Bitcoin network change is scheduled to begin around August 8. **Other Notable Events:** Chinese robotics firm Unitree Tech has set its preliminary price inquiry for its IPO for August 5. South Korean exchange Upbit will delist AQT and AERGO tokens on August 3.

marsbitHá 10m

Must-Watch Events Next Week|CLARITY Act Could Face Senate Vote; SpaceX, Circle to Report Earnings (8.3-8.9)

marsbitHá 10m

Stocks Are Plummeting More Sharply Than Cryptocurrencies. Where Has the Money Gone?

Stock Markets Plunge Deeper Than Cryptocurrencies: Where Did the Money Go? In late July, Seoul's Kospi index triggered circuit breakers for two consecutive days, plummeting over 40% from its June high. The collapse was led by heavyweight stocks like SK Hynix, whose record profits still disappointed investors, and devastating leveraged ETFs, with one major product losing over 83% of its value. This signaled a global, forced deleveraging targeting the most crowded trades. Interestingly, while stocks exhibited extreme volatility akin to crypto markets, Bitcoin rose nearly 15% in July after a prior steep drop. Analysis shows the money fleeing equities did not flow into Bitcoin. Instead, Bitcoin had already absorbed its sell-off in May-June, when U.S. spot Bitcoin ETFs saw historic outflows. The true safe-haven beneficiary was gold, whose price rose over 20% year-on-year, highlighting a decoupling between Bitcoin and gold as "digital gold." The sell-off was a targeted unwinding of leveraged positions in tech and semiconductors, accelerated by broker-dealer risk management and shifts in the AI narrative, including new competition from Chinese memory chipmakers. The retreat path was clear: from high-valuation tech stocks to cash and U.S. Treasuries, then to gold. For Bitcoin to attract sustained institutional inflows, conditions like eased global liquidity pressure, a "soft-landing" Fed rate cut, and U.S. regulatory clarity via legislation like the stalled CLARITY Act are needed. Currently, Bitcoin is not a safe haven but an already-cleared asset. Its low correlation with tech stocks, however, makes it a potential diversification play for institutional portfolios once the storm passes. The money isn't here yet, but the positioning is underway.

marsbitHá 10m

Stocks Are Plummeting More Sharply Than Cryptocurrencies. Where Has the Money Gone?

marsbitHá 10m

In Conversation with Ray Dalio: We Are Currently in an AI Bubble, with 1% of My Portfolio in Bitcoin

Ray Dalio, founder of Bridgewater Associates, warns in an interview that the current AI boom shows classic bubble characteristics, which could lead to significant economic downturns as seen in past cycles like 1929 or 2000. He explains that speculative enthusiasm, fueled by debt and overvaluation, often precedes a crash when rising rates or taxation force asset sales, causing widespread losses and recession. Dalio also outlines his "Big Cycle" theory, describing an approximate 80-year pattern where widening wealth gaps, massive government deficits, and shifting geopolitical power (like China's rise) create internal conflict and global instability. He emphasizes that we are in a late-cycle, transitional phase where traditional powers like the US and UK face decline. For personal wealth protection, Dalio advises diversification beyond cash into assets like stocks, bonds, real estate, and particularly gold, which he prefers over Bitcoin. While he holds about 1% of his portfolio in Bitcoin as a non-printable hard asset, he views gold as more secure from technological or governmental threats. Regarding AI's impact, Dalio believes it will disproportionately benefit capital owners, worsening inequality by replacing both physical and cognitive labor. He suggests that human intuition and emotional intelligence, combined with AI, will be key for future workers. On taxation, Dalio argues that wealth taxes are impractical and risk triggering asset sell-offs, reducing productive investment. He points to the UK as a cautionary example of debt, low productivity, and political strife. Geopolitically, Dalio foresees a more regionalized world, with the US showing weakness in prolonged conflicts like with Iran, akin to past imperial declines. The ideal outcome, he suggests, is coexisting powerful blocs (e.g., Americas, China-Asia Pacific) without major war.

marsbitHá 4h

In Conversation with Ray Dalio: We Are Currently in an AI Bubble, with 1% of My Portfolio in Bitcoin

marsbitHá 4h

Daily 7.2 Trillion KRW: Foreign Capital's Record Net Buying on Friday! Wall Street Says Headwinds for Korean Stock Fund Flows Have Subsided

South Korean stock market sees a dramatic shift in fund flows. On July 31, foreign investors made a record net purchase of approximately KRW 7.2 trillion in KOSPI stocks, marking a fundamental reversal from the persistent large-scale net outflows seen in previous months. This contributed to a significant narrowing of foreign net selling in July to KRW 9.8 trillion, down sharply from KRW 48.4 trillion in June and KRW 44.5 trillion in May. Simultaneously, domestic institutional pressure eased. South Korean pension funds and asset managers turned to a net buying position in July, purchasing KRW 1.0 trillion worth of KOSPI shares, contrasting with net sales in May and June. Market volatility is expected to be dampened by new financial regulations. Effective July 31, the Financial Services Commission tightened access for retail investors to single-stock leveraged ETFs by raising the minimum cash deposit requirement. Trading volumes for these products subsequently dropped to about 50% of their monthly average. Citigroup Research maintains its year-end KOSPI target of 10,000 points. The firm cites several supportive factors: the substantial easing of headwinds from capital outflows, a robust fundamental outlook for the semiconductor sector, historically low market valuations, strong economic fundamentals, and the potential for policy support from financial authorities if needed.

marsbitHá 4h

Daily 7.2 Trillion KRW: Foreign Capital's Record Net Buying on Friday! Wall Street Says Headwinds for Korean Stock Fund Flows Have Subsided

marsbitHá 4h

Trading

Spot
活动图片




