RIVER drops 30%, yet a rebound could still be coming: Here’s why

ambcryptoPublicado em 2026-03-24Última atualização em 2026-03-24

Resumo

RIVER has experienced a significant 30% decline over 48 hours, erasing gains and returning to price levels last seen in early February. Despite this sharp pullback, it remains one of the top-performing altcoins with 369% gains over 90 days, second only to SIREN. However, the token faces a critical test of momentum sustainability. Market data reveals growing bearish pressure: funding rates turned negative, indicating dominance of short positions, while approximately $27.7 million exited perpetual futures contracts. Spot market activity also weakened, with $1.35 million in net selling over three days. Despite short-term outflows, longer-term net inflows remain positive, suggesting underlying demand hasn't fully reversed. Liquidation heatmaps show clusters above current prices, hinting at potential upward movement if market sentiment stabilizes. While the decline aligns with a corrective phase rather than a confirmed long-term downtrend, continued short dominance may extend losses. A rebound remains possible if long positions re-enter or broader market momentum improves.

River [RIVER] has entered a phase of losses not seen in several weeks. Over the past 48 hours, amid a wider market shake-up, the asset has declined by 30%, revisiting levels last observed around the 4th of February. The move marks a notable shift in short-term sentiment after an extended period of upside performance.

Despite the correction, RIVER still ranks among the top-performing altcoins. Data from the 90-day Altcoin Season Index shows the asset remains the second-best performer, with gains of roughly 369%, trailing only SIREN.

However, history suggests caution. Numerous tokens have previously occupied similar positions but failed to sustain their momentum. This context places RIVER at a critical juncture, where the current decline could either evolve into a broader trend reversal or remain a temporary correction within a larger uptrend.

Capital outflows and funding rates signal pressure

An analysis of capital flows in the perpetual futures market, a key driver of volatility, points to sustained pressure on RIVER.

The Funding Rate, which reflects whether long or short positions dominate the market, has turned negative as of writing. A reading of -0.1382% indicated that short positions now outweighed longs, highlighting a growing bearish bias among derivatives traders.

This shift typically reflects expectations that the asset is overvalued, encouraging traders to position for further downside while amplifying selling pressure.

Source: CoinGlass

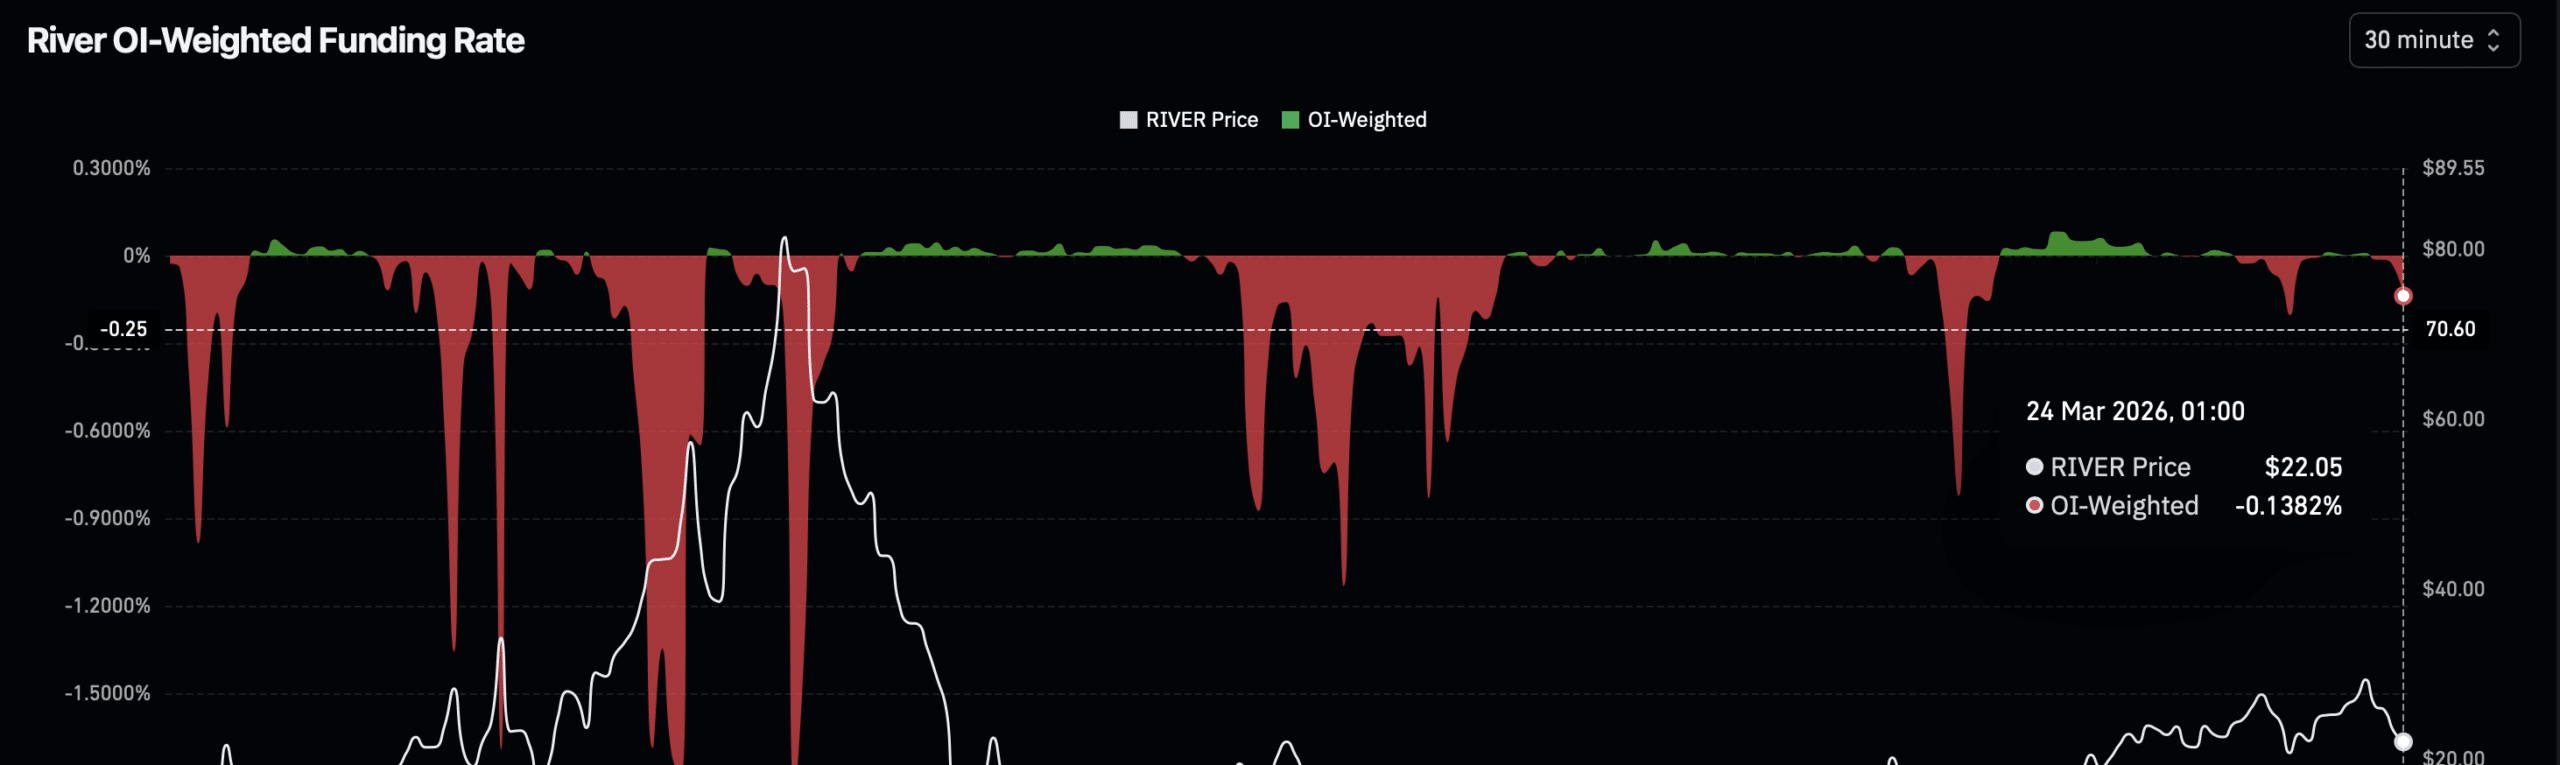
At the same time, not all participants are actively shorting. A segment of investors has exited positions entirely, reinforcing the narrative of declining conviction. This behavior often emerges when market participants anticipate heightened volatility or lack clarity on near-term direction.

Approximately $27.7 million has flowed out of RIVER’s perpetual contracts within this period. This level of capital movement is significant. If long positions re-enter, it could support a rebound. However, continued dominance of short positions may extend the decline.

Spot market activity supports a bearish narrative

Developments in the spot market further align with the weakening sentiment. Over the past three days, selling activity has outpaced buying, reinforcing downward pressure.

During this window, roughly $1.35 million worth of RIVER has been sold. This trend suggests that investors are reducing exposure in the short term, likely rotating into stablecoins or lower-risk assets while uncertainty persists.

Source: CoinGlass

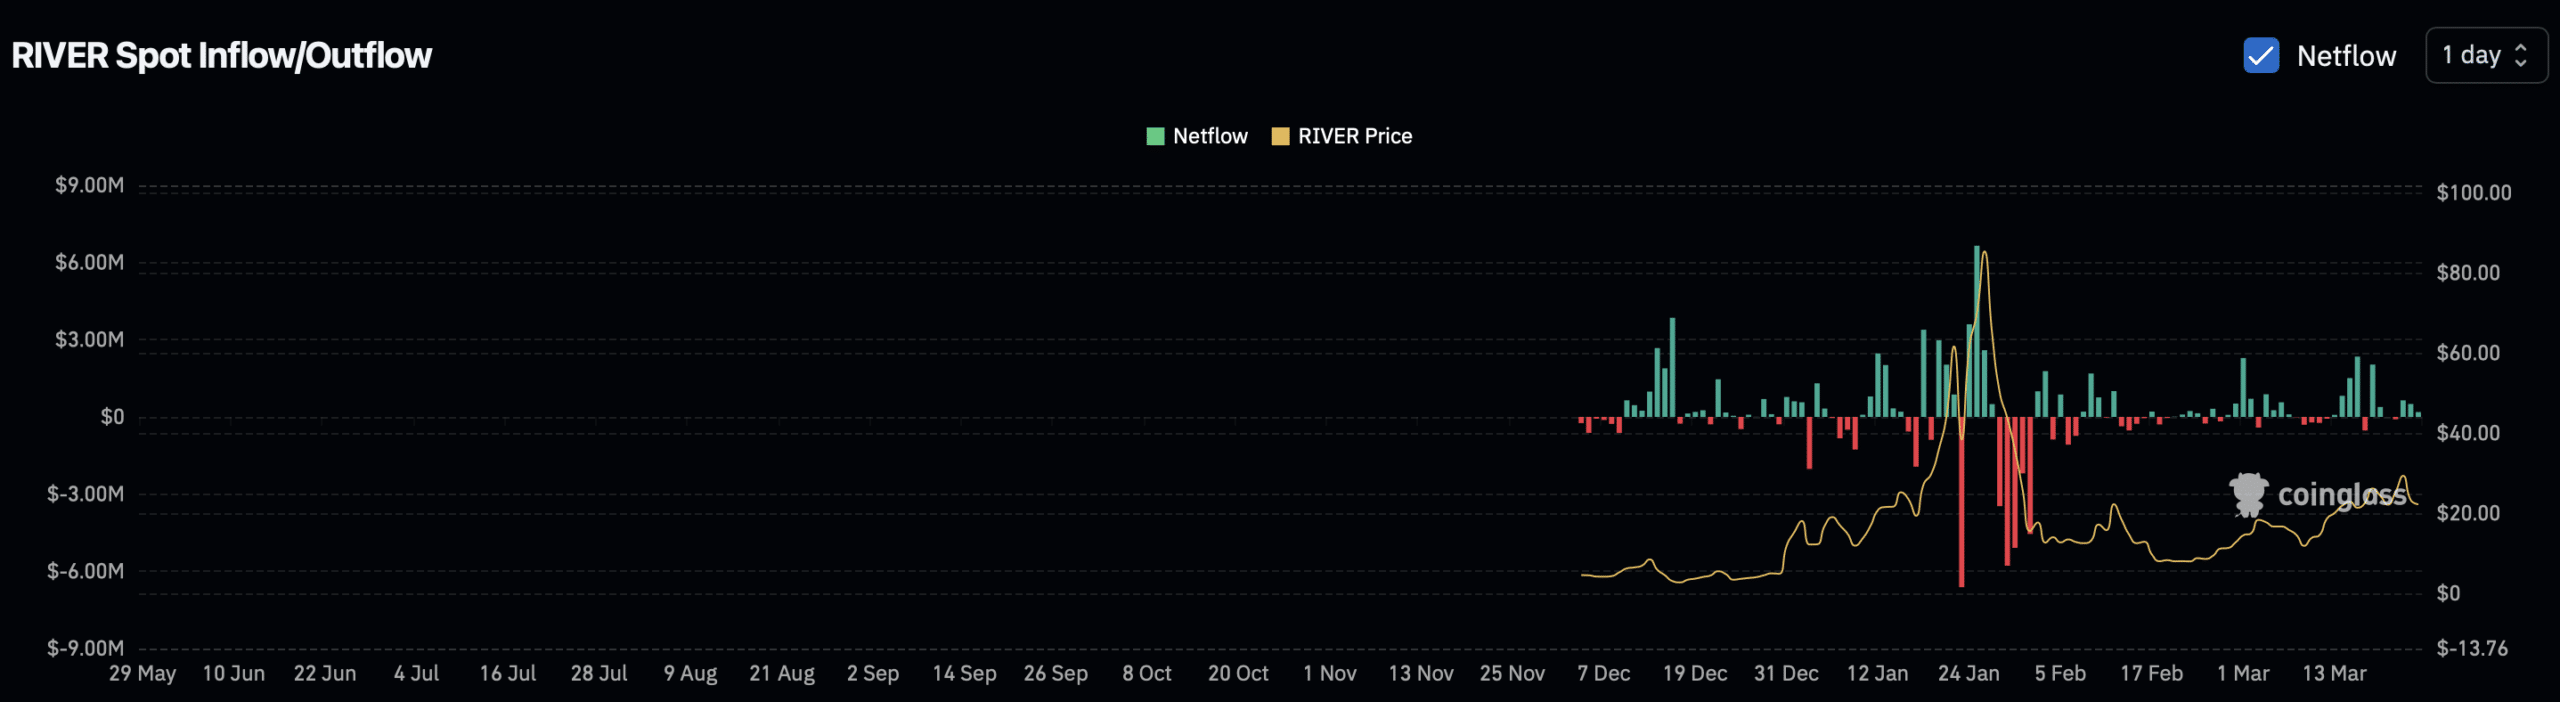
Nevertheless, a broader perspective provides a more balanced picture. Net inflows for the 10-day, 15-day, and 30-day periods remain positive at $8.74 million, $9.13 million, and $16.71 million, respectively. This suggests that, while short-term sentiment has declined, underlying demand has not completely reversed.

Additionally, daily selling volume has declined over the past three days. This gradual drop indicates that bearish conviction may be losing strength.

In a sustained downtrend, selling pressure would typically intensify as more participants position for further losses. That pattern has yet to fully materialize.

Liquidation clusters hint at upside potential

Liquidation heatmaps provide further insight into possible price direction. These maps identify clusters of liquidation orders, which often act as magnets for price movement. Clusters below the current price represent potential buy-side liquidity, while those above indicate sell-side pressure.

In RIVER’s case, a larger share of clusters sits above the current price. Although these clusters are relatively shallow, meaning they may not exert strong influence individually, their presence still points to a possible upward bias in price movement.

Source: CoinGlass

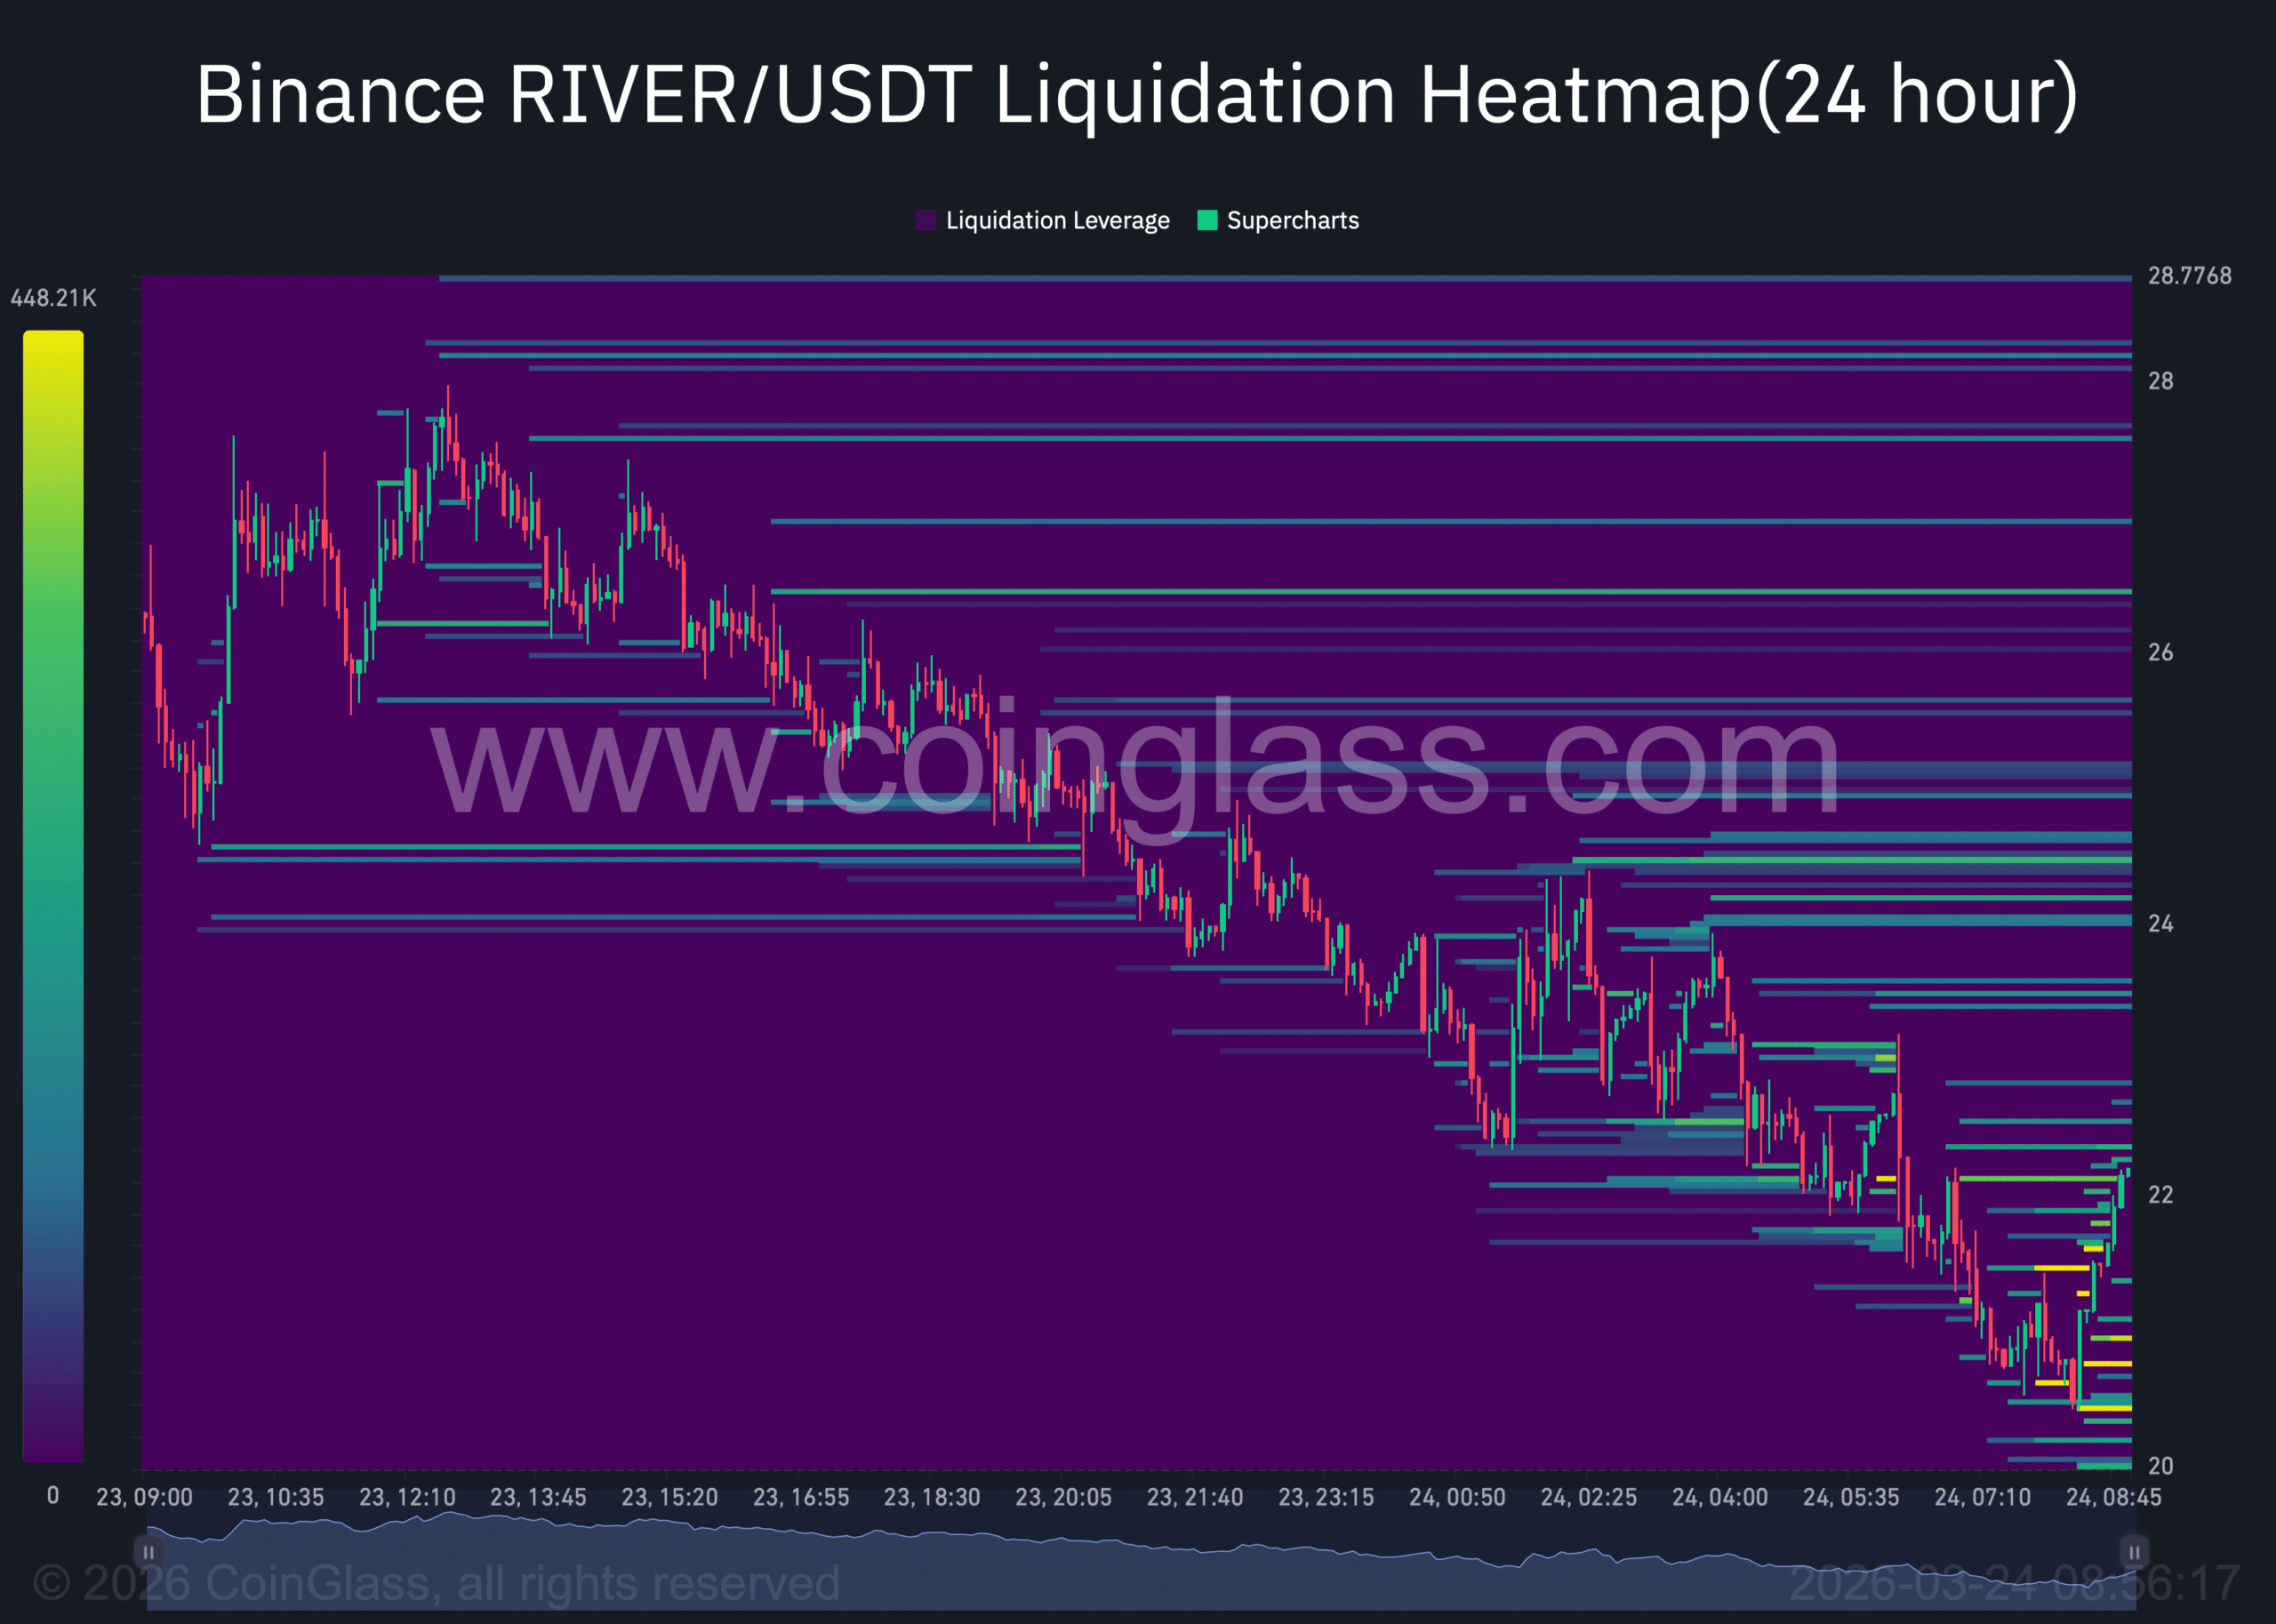
Such positioning suggests that the market could attempt to move higher to trigger these liquidity zones, particularly if broader sentiment stabilizes.

While bullish momentum across the wider market could still drive a recovery, current data indicates that RIVER’s movement aligns more with a corrective phase than a confirmed long-term downtrend.


Final Summary

  • RIVER records a sharp pullback as capital exits and trader conviction weakens.
  • Spot market momentum favors bears, though the asset’s broader performance remains strong.

Leituras Relacionadas

GitHub, Transfixed by AI

On the night of February 9th, GitHub suffered a major outage caused by a simple configuration change—reducing a cache refresh interval from 12 to 2 hours—that triggered a cascade of failures. This was not an isolated event, but part of a broader pattern. In early 2026, GitHub experienced at least 8 major incidents, failing to meet its promised 99.9% availability. These outages stemmed from structural issues: explosive growth in load, tight service coupling, and insufficient protection against abnormal traffic. This unprecedented load is driven by AI Agents. In 2025, GitHub handled ~1 billion commits. By 2026, weekly commits reached 275 million, projecting to ~14 billion for the year—a 14x increase. AI tools like Claude Code now contribute 4.5% of all public repository commits, with weekly submissions surging 25x in just three months. AI-generated pull requests jumped from 4 million to 17 million per month in half a year. Unlike human developers, AI Agents work continuously, generating commits at a scale that overwhelms infrastructure designed for human rhythms. The surge also shattered GitHub's business model. Copilot's flat-rate pricing, based on assisting human developers, became unsustainable as Agentic AI sessions consumed resources worth hundreds of dollars for a few dollars in fees. In response, GitHub imposed usage limits and, by June 1st, shifted to a pay-per-use "AI Credits" system. Facing this new reality, GitHub realized a 10x scaling plan was insufficient. It announced a need to *redesign* its architecture for 30x current scale—decoupling services, adding fault isolation, and improving change management to prevent cascading failures. Other platforms like Stripe and AWS are facing similar challenges with AI Agents. Fundamentally, GitHub is transitioning from a human collaboration platform to an "exhaust pipe" for automated AI workflows. Its detailed post-mortem reports aim to maintain trust during this turbulent rebuild. The February outage was not just a technical glitch, but a signal of the software industry's entry into a new, AI-driven era.

marsbitHá 22m

GitHub, Transfixed by AI

marsbitHá 22m

Both Suffer Massive Losses Exceeding $90 Billion, Which Is in Greater Peril: Strategy or Bitmine?

Facing massive paper losses exceeding $90 billion each amidst a sharp market downturn, "Digital Asset Treasury" (DAT) giants Strategy and Bitmine find themselves in a precarious position, but with different underlying risks. Strategy, heavily invested in Bitcoin (BTC), faces significant financial strain. Its strategy relies heavily on debt, including convertible notes and preferred stock (STRC) requiring substantial dividend payments. With its cash reserves dwindling and BTC offering no staking yield for cash flow, Strategy's high leverage makes it vulnerable. A continued price decline could force asset sales to meet obligations, potentially creating a negative feedback loop. Its market value has already fallen sharply. In contrast, Bitmine, an Ethereum (ETH) holder, appears on firmer financial ground. It primarily funds its purchases through equity offerings (like ATM programs), avoiding debt pressure. It also generates income by staking a large portion of its ETH holdings. While not immune to market drops and shareholder dilution concerns, Bitmine maintains more flexibility, recently announcing a new preferred share offering to raise further capital. The core divergence lies in their financing: Bitmine uses equity (investor money), while Strategy uses debt (borrowed money). Consequently, Bitmine currently faces less immediate liquidity pressure than Strategy, which must navigate the dual challenge of servicing debt/dividends and a declining core asset (BTC) price.

marsbitHá 29m

Both Suffer Massive Losses Exceeding $90 Billion, Which Is in Greater Peril: Strategy or Bitmine?

marsbitHá 29m

Where the AI Bubble Really Is: Which Layer of Players Are Naked

AI Bubble: Where It Really Is and Who's Swimming Naked This analysis dissects the AI industry not as a single entity but as a five-layer pyramid, arguing that bubbles are concentrated in specific tiers, not uniformly distributed. **Key Distinction from the 2000 Dot-com Bubble:** Unlike 2000, where companies had stock prices before revenue, today's leading AI players have massive, contract-backed revenue driving their valuations. Core infrastructure demand is real, with every GPU running at full capacity for paying customers. **The Five-Layer Pyramid & Bubble Assessment:** * **L0 (Fab/Manufacturing) & Top L4 (Leading AI Apps): NO BUBBLE.** Companies like TSMC, NVIDIA, major cloud providers (Microsoft, Google, Meta, Amazon), and top AI labs have real revenues and orders. Supply is tightly constrained by TSMC's disciplined capacity control and physical limits like power/land for data centers, preventing a supply glut. * **L1 (Memory): BATTLEGROUND.** Sky-high HBM margins could signal a new structural cycle or a classic "boom before bust." The oligopoly of three major players may enforce supply discipline, making this a high-stakes bet. * **L2 (Interconnect/Optical Modules): BUBBLE TERRITORY.** Companies like Lumentum and AAOI have seen stock surges (4-10x) far outpacing revenue growth. This hardware segment has lower physical barriers to expansion than fabs, allowing speculation. It mirrors the 2000 bubble's epicenter—optics. * **L3 (Infrastructure/"GPU Landlords"): VULNERABLE.** GPU leasing companies profit from the current compute shortage but own no long-term moat. Their business model relies on a temporary bottleneck that will ease as big tech expands and new tech (e.g., potential space-based data centers) emerges. * **L4 Long Tail (VC-backed Startups): STRONG BUBBLE SIGNALS.** VC funding concentration in AI is twice that of the 1999 peak. Many startups with little revenue use the valuation logic of successful giants to justify their own, creating high risk of a "valuation crunch" when funding dries up. **Critical Risks to Monitor:** 1. **GPU Depreciation & Accounting:** Companies extending the assumed useful life of GPUs artificially boost profits. The true economic life depends on future generational leaps from NVIDIA. 2. **"GPU Credit" & Off-Balance-Sheet Leverage:** Emerging structures where shell companies borrow to buy GPUs and lease them out (with chipmakers sometimes investing) move debt off major balance sheets. This echoes the "vendor financing" of 2000 and the securitization risks of 2008, though currently small-scale. 3. **TSMC Abandoning Caution:** If the primary supply bottleneck (TSMC's conservative capacity planning) breaks, runaway supply could trigger a bust. 4. **Algorithmic Efficiency Breakthrough:** A major leap in software efficiency could drastically reduce the need for raw compute hardware, undermining the investment thesis. **Conclusion:** The AI boom is expensive and has frothy areas, but its core is underpinned by real demand and physical supply constraints. The bubble risk is layered: most present in optical components, GPU leasing, and the long-tail startup ecosystem, while the foundational chip manufacturing and leading application layers remain relatively solid—for now.

marsbitHá 41m

Where the AI Bubble Really Is: Which Layer of Players Are Naked

marsbitHá 41m

Trading

Spot
Futuros

Artigos em Destaque

Como comprar RIVER

Bem-vindo à HTX.com!Tornámos a compra de River (RIVER) simples e conveniente.Segue o nosso guia passo a passo para iniciar a tua jornada no mundo das criptos.Passo 1: cria a tua conta HTXUtiliza o teu e-mail ou número de telefone para te inscreveres numa conta gratuita na HTX.Desfruta de um processo de inscrição sem complicações e desbloqueia todas as funcionalidades.Obter a minha contaPasso 2: vai para Comprar Cripto e escolhe o teu método de pagamentoCartão de crédito/débito: usa o teu visa ou mastercard para comprar River (RIVER) instantaneamente.Saldo: usa os fundos da tua conta HTX para transacionar sem problemas.Terceiros: adicionamos métodos de pagamento populares, como Google Pay e Apple Pay, para aumentar a conveniência.P2P: transaciona diretamente com outros utilizadores na HTX.Mercado de balcão (OTC): oferecemos serviços personalizados e taxas de câmbio competitivas para os traders.Passo 3: armazena teu River (RIVER)Depois de comprar o teu River (RIVER), armazena-o na tua conta HTX.Alternativamente, podes enviá-lo para outro lugar através de transferência blockchain ou usá-lo para transacionar outras criptomoedas.Passo 4: transaciona River (RIVER)Transaciona facilmente River (RIVER) no mercado à vista da HTX.Acede simplesmente à tua conta, seleciona o teu par de trading, executa as tuas transações e monitoriza em tempo real.Oferecemos uma experiência de fácil utilização tanto para principiantes como para traders experientes.

613 Visualizações TotaisPublicado em {updateTime}Atualizado em 2026.06.02

Como comprar RIVER

Discussões

Bem-vindo à Comunidade HTX. Aqui, pode manter-se informado sobre os mais recentes desenvolvimentos da plataforma e obter acesso a análises profissionais de mercado. As opiniões dos utilizadores sobre o preço de RIVER (RIVER) são apresentadas abaixo.

活动图片