On-Chain Insights
Trapped in the Range
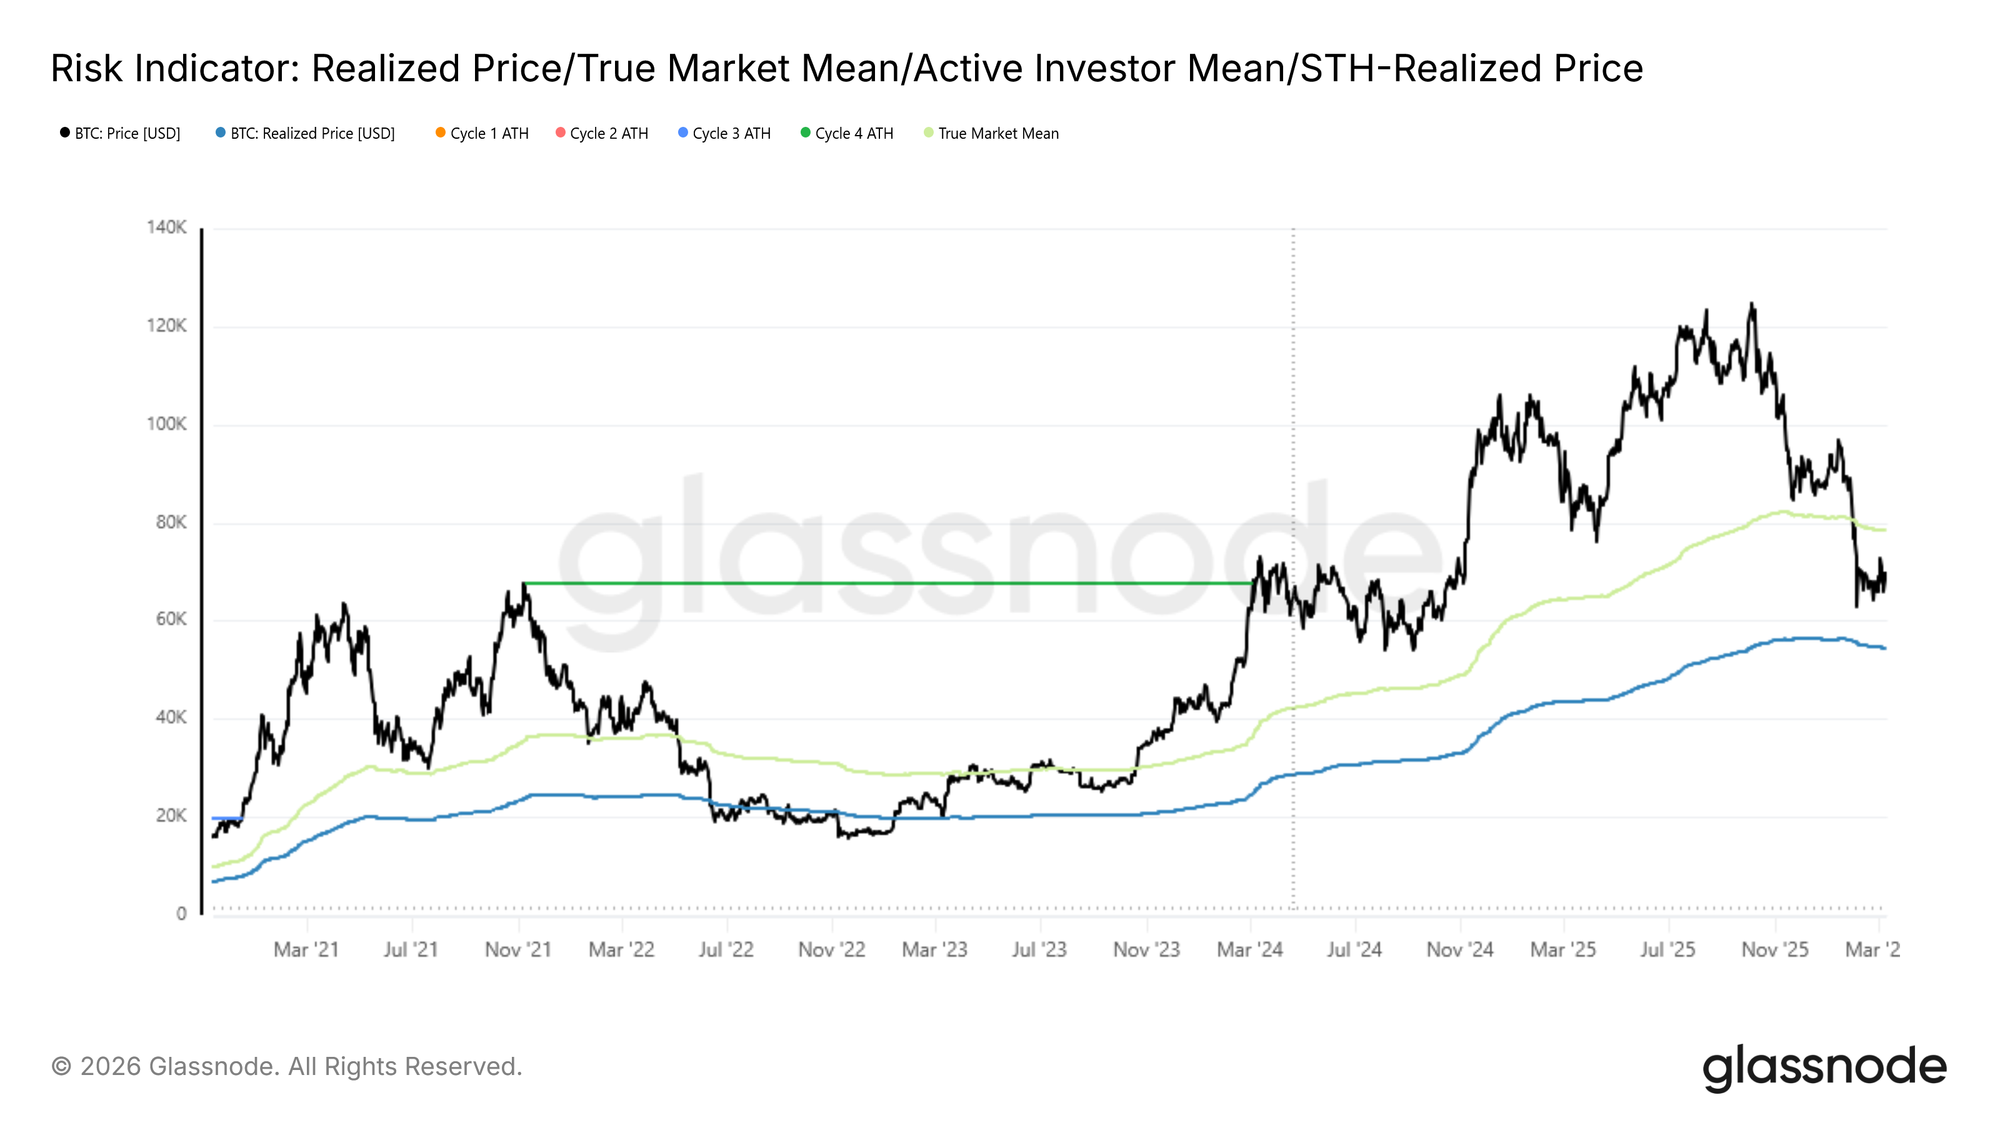
Bitcoin has spent more than a month consolidating within a $62.8k–$72.6k range, with multiple failed attempts to establish footing above $70k, each rejection accompanied by brief spikes in Net Realized Profit exceeding $5M per hour, indicative of opportunistic profit-taking rather than sustained demand. Zooming out, price is currently sandwiched between two structurally significant cost basis models: the Realized Price at $54.4k, representing the average acquisition cost of all circulating supply, and the True Market Mean at $78.4k, which tracks the cost basis of actively transacted coins.
In the absence of broader macro headwinds, this range could plausibly support a bear market relief rally capped by the True Market Mean. However, the layering of geopolitical uncertainty onto an already fragile structure that has repeatedly failed to hold above $70k tilts the mid-term return distribution toward the downside, with the Realized Price serving as the primary support level to monitor.
Accumulation Without Conviction
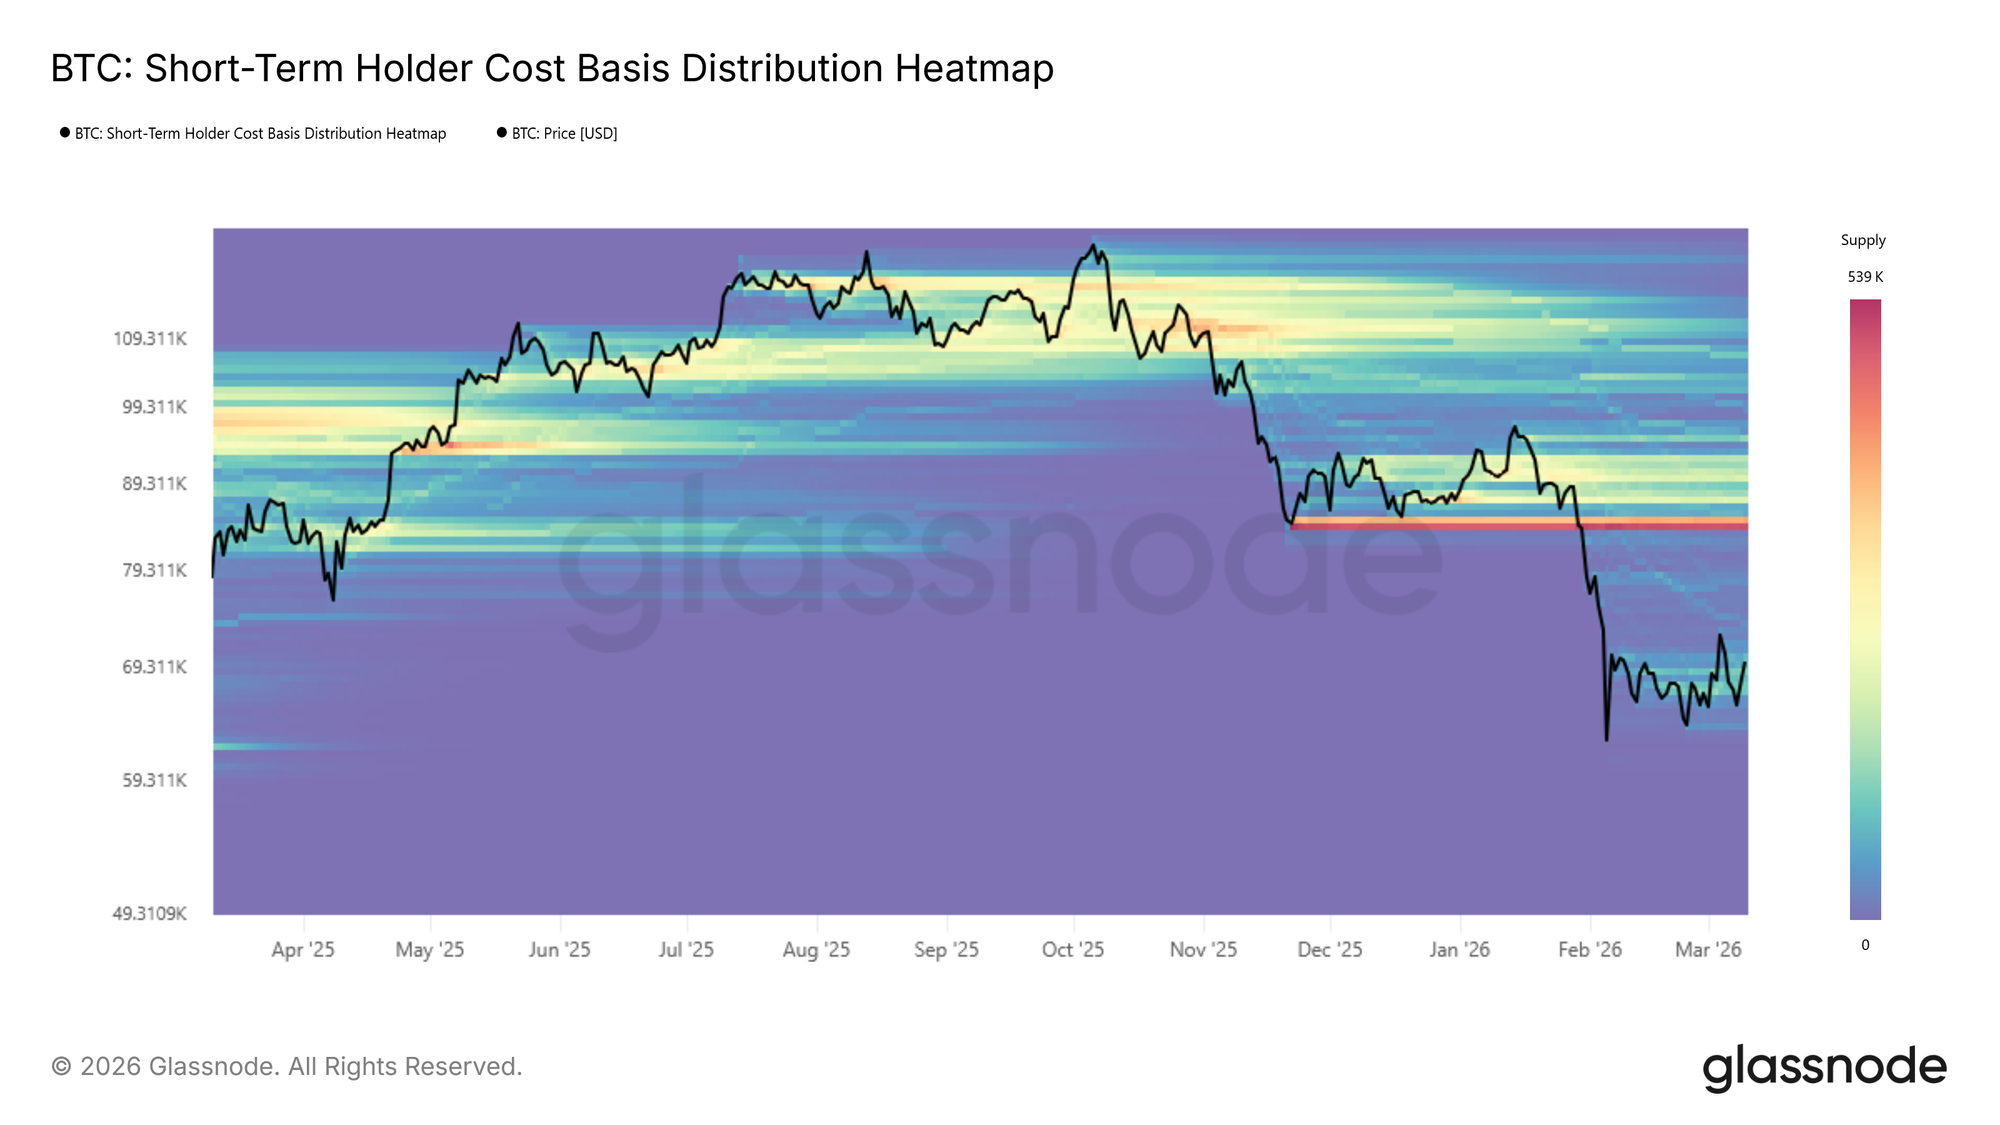
Building on the observed stability around the midpoint of the Realized Price to True Market Mean range, an on-chain accumulation cluster is beginning to take shape. Using the Cost-Basis Distribution Heatmap, accumulation clusters identify price levels where a significant volume of supply has changed hands recently, serving as a proxy for near-term investor conviction and potential support density.
However, the intensity of the current cluster is relatively modest when compared to prior accumulation phases that preceded decisive price expansions. Those earlier episodes were characterized by heavier capital commitment, whereas the present cluster reflects a more tentative repositioning. Therefore, while the emerging accumulation lends some credence to the bear market rally thesis outlined above, its lack of intensity suggests the foundation for a sustained mid-term expansion remains thin.
New Investors Under Pressure
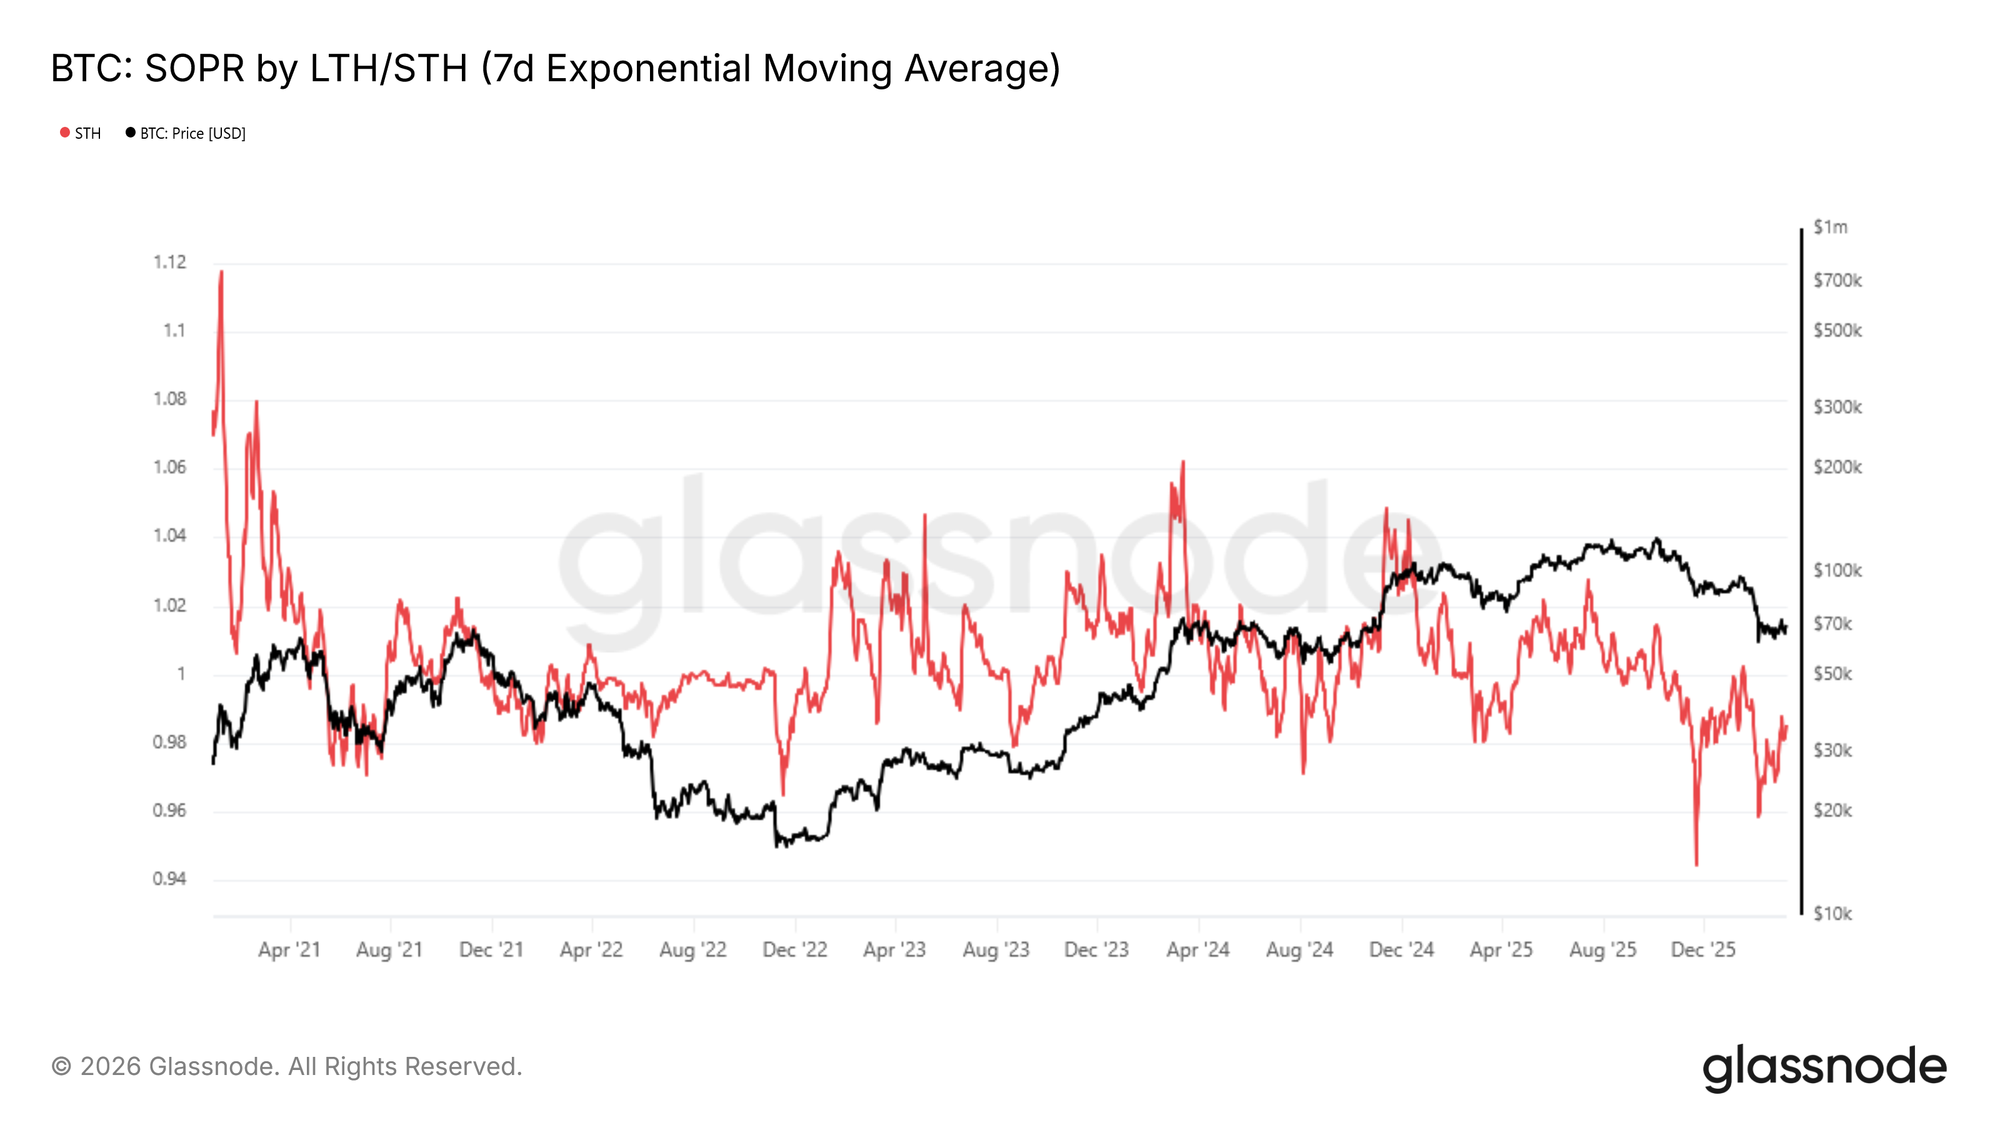
Compounding the tepid accumulation signal, a key drag on market momentum is the sustained erosion of profitability among newer market participants. This dynamic is directly captured by the Short-Term Holder Spent Output Profit Ratio (STH-SOPR), which measures the ratio between the price at which short-term holders acquired their coins and the price at which they are spending them. A reading below 1 indicates that this cohort is, on aggregate, realizing losses.
The 7D-EMA of STH-SOPR has traded continuously below 1 since October 2025, and currently sits at 0.985, confirming that recent buyers lack meaningful unrealized profit to deploy or defend positions with. This is a textbook characteristic of a bear market regime, one that historically requires an extended period of base-building before conditions normalize.
Tactically, STH-SOPR also serves as a local top indicator. Spikes toward 1 during relief rallies tend to mark exhaustion points, as recent buyers seize the opportunity to exit near breakeven rather than hold for further upside.
Off-Chain Insights
ETF Inflows Reappear
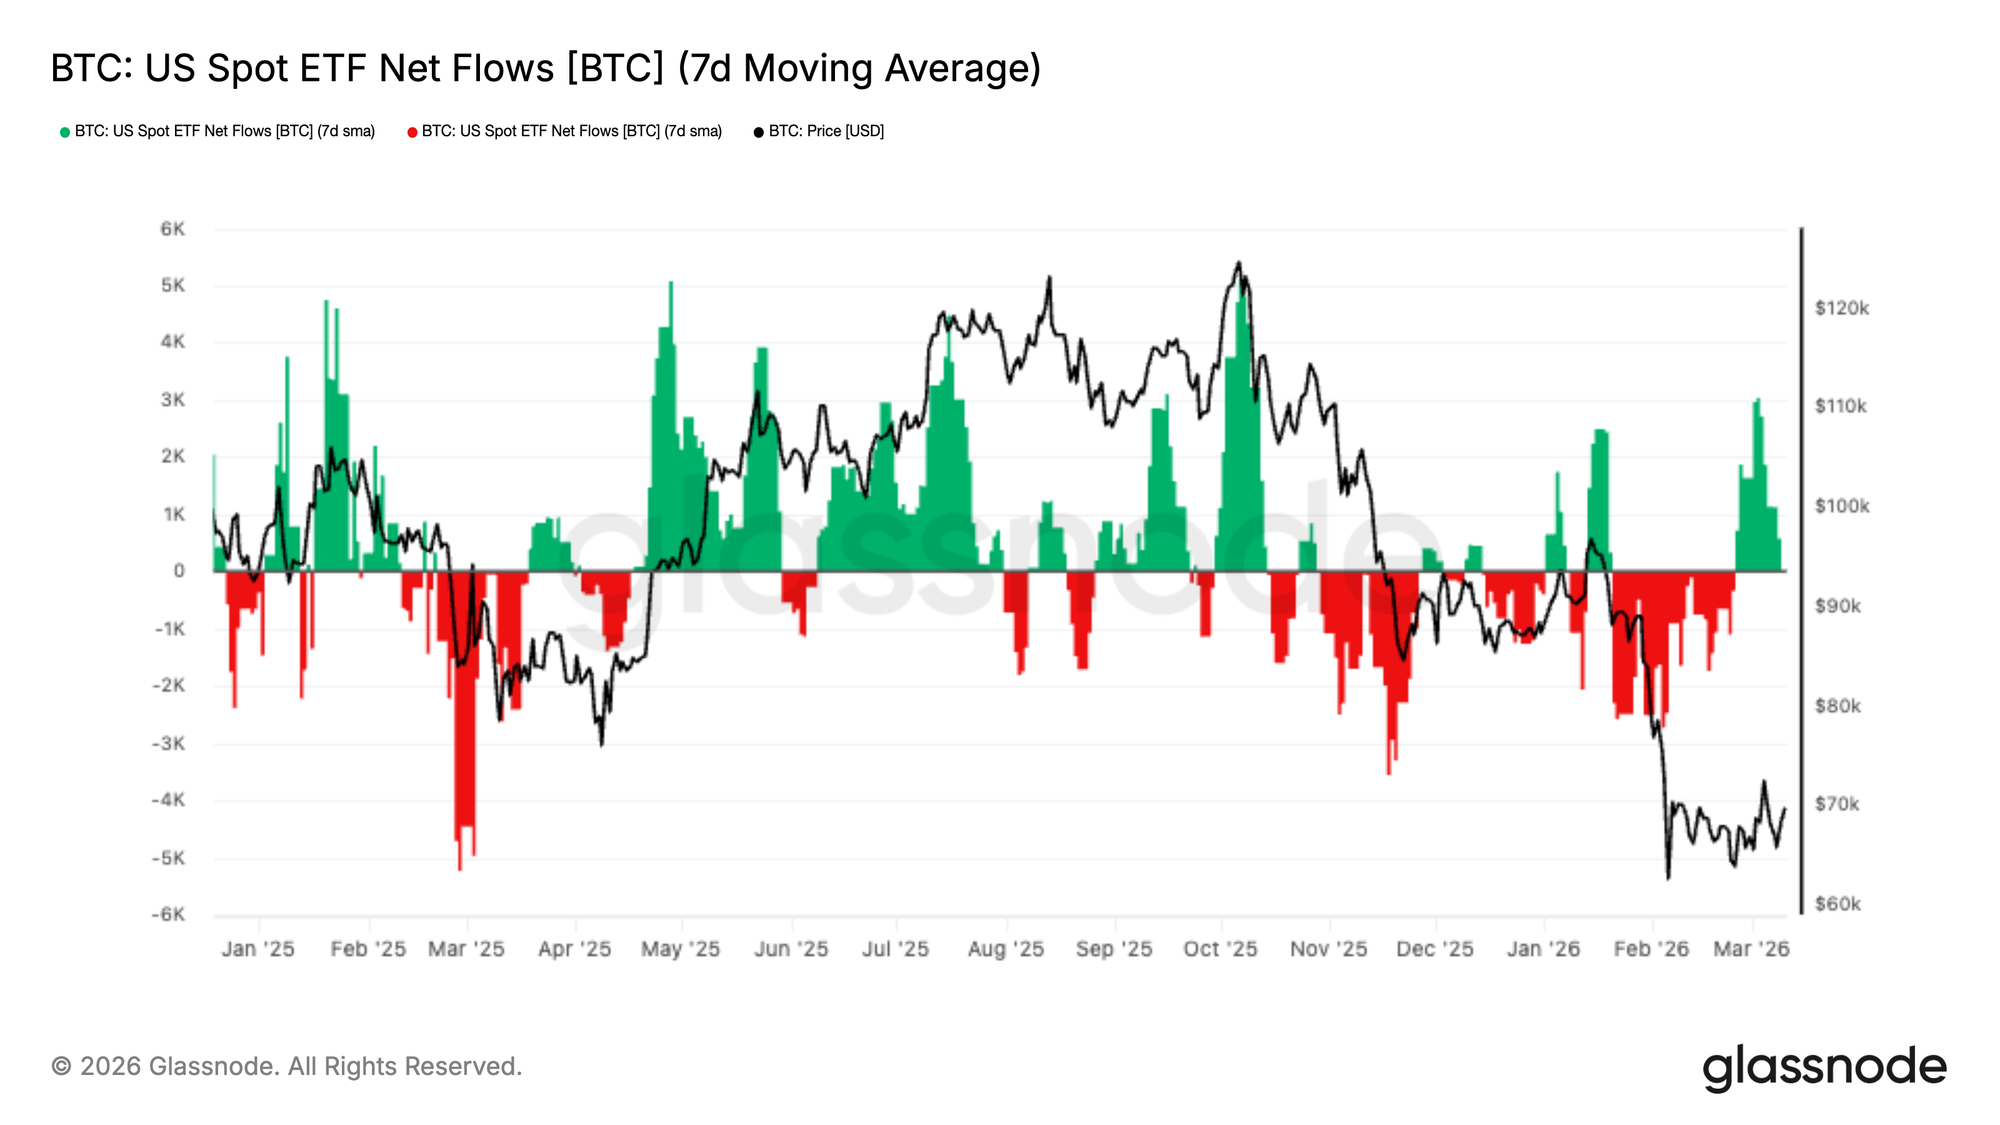
US Spot Bitcoin ETFs experienced a sustained period of net outflows throughout the recent market correction, with the 7-day moving average remaining negative as prices declined toward the $65k region. This persistent redemption pressure reflected a broader institutional de-risking phase across regulated investment vehicles.
Over the past week however, flows have shifted meaningfully, with a strong burst of inflows emerging and pushing the 7-day average firmly back into positive territory. This marks the most significant demand impulse since the correction began, suggesting institutional buyers may be stepping in as Bitcoin stabilises near recent lows.
While it remains early to confirm a structural shift in demand, a continuation of positive ETF flows would signal improving institutional sentiment and could re-establish ETFs as an important source of spot-side support for the market.
Spot Demand Rebounds
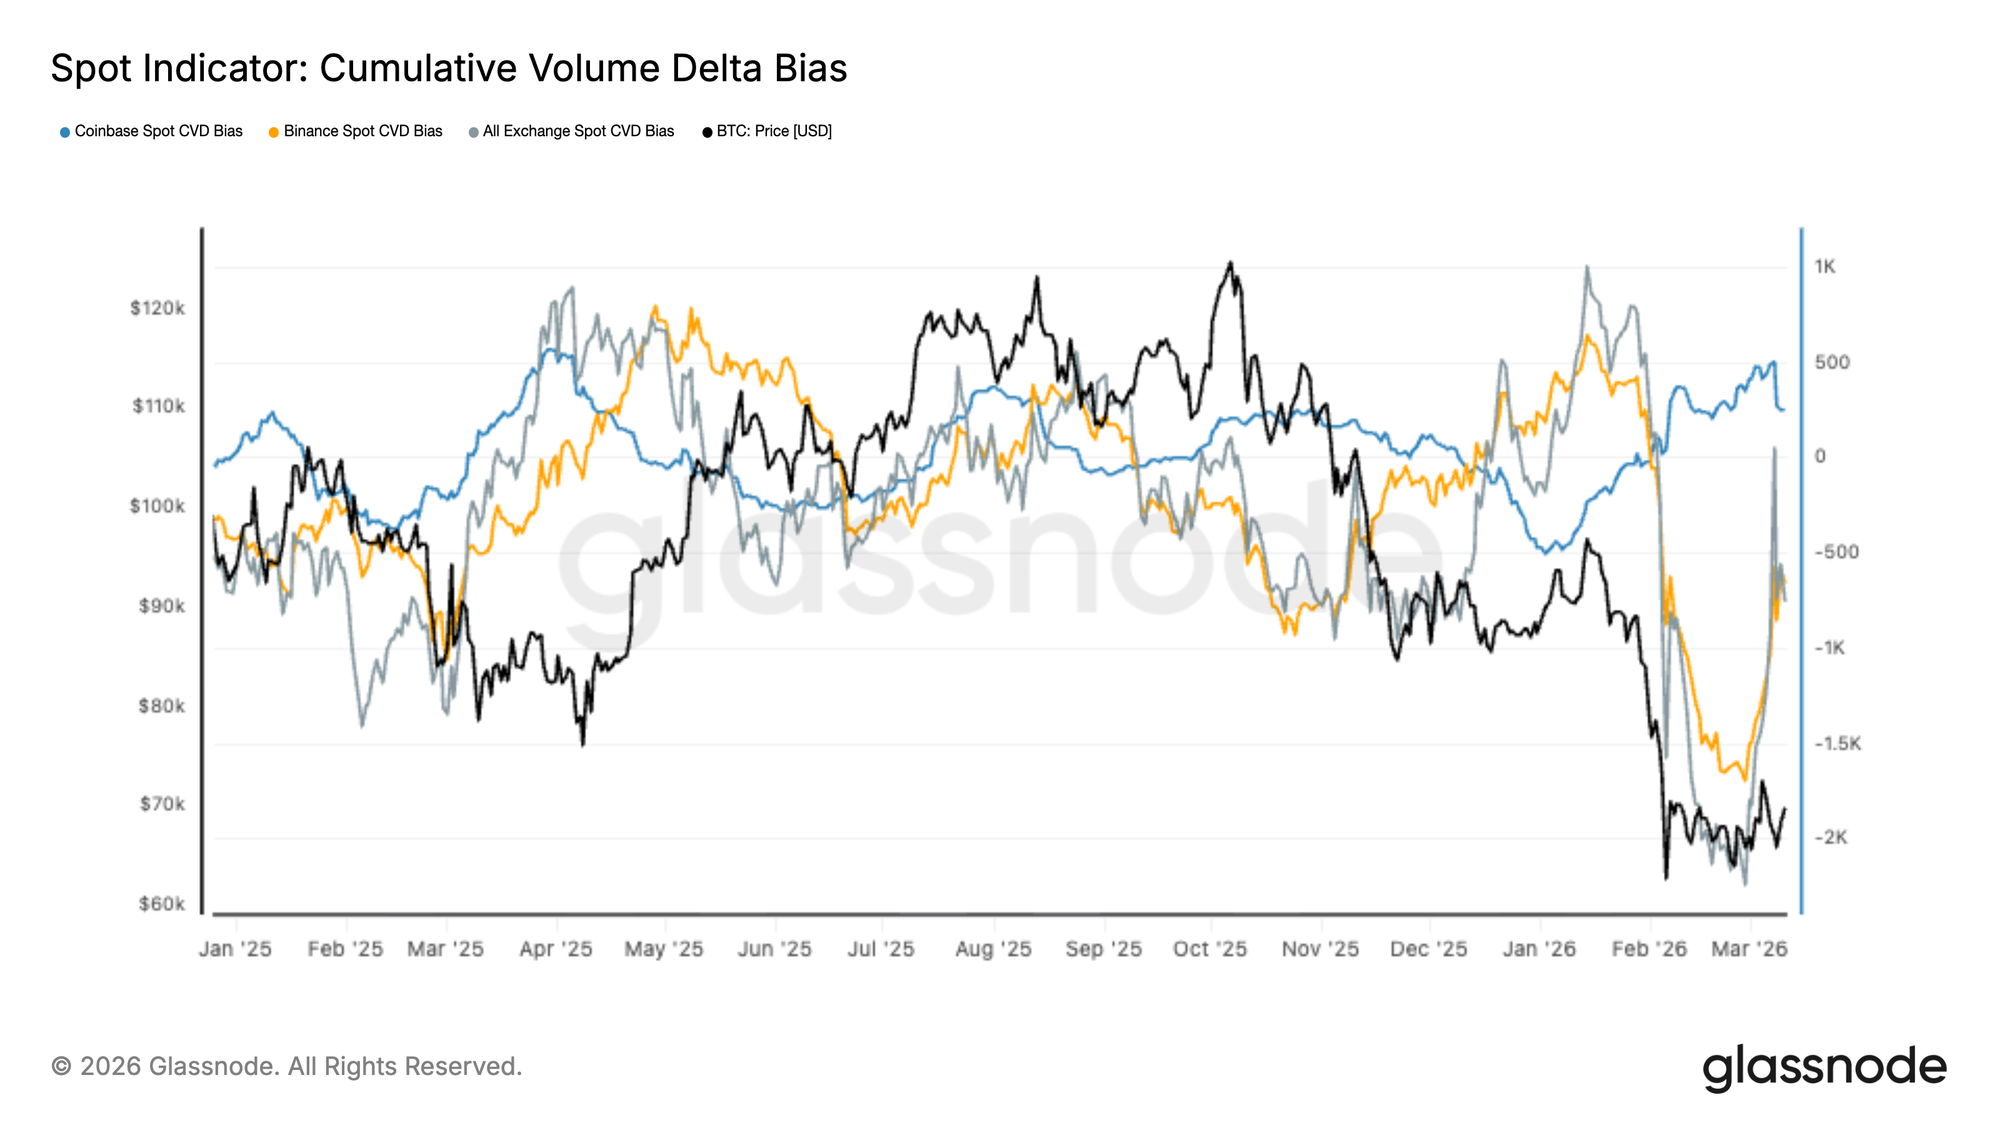
Spot market order flow shows early signs of recovery following an extended period of aggressive sell-side pressure. The cumulative volume delta across major exchanges fell sharply during the recent market decline, with Binance and broader market flows reflecting persistent market sell pressure as BTC dropped toward the $60k–$70k range.
In recent sessions however, spot CVD has begun to reverse higher, indicating buyers are starting to absorb sell-side liquidity. The recovery is particularly visible across global exchange aggregates, suggesting a broad-based improvement in spot demand rather than isolated exchange activity.
While this shift points to a potential stabilisation in spot market conditions, sustained buyer dominance will be required to confirm that demand is strong enough to support a durable recovery in price.
Funding Turns Negative as Short Positioning Builds
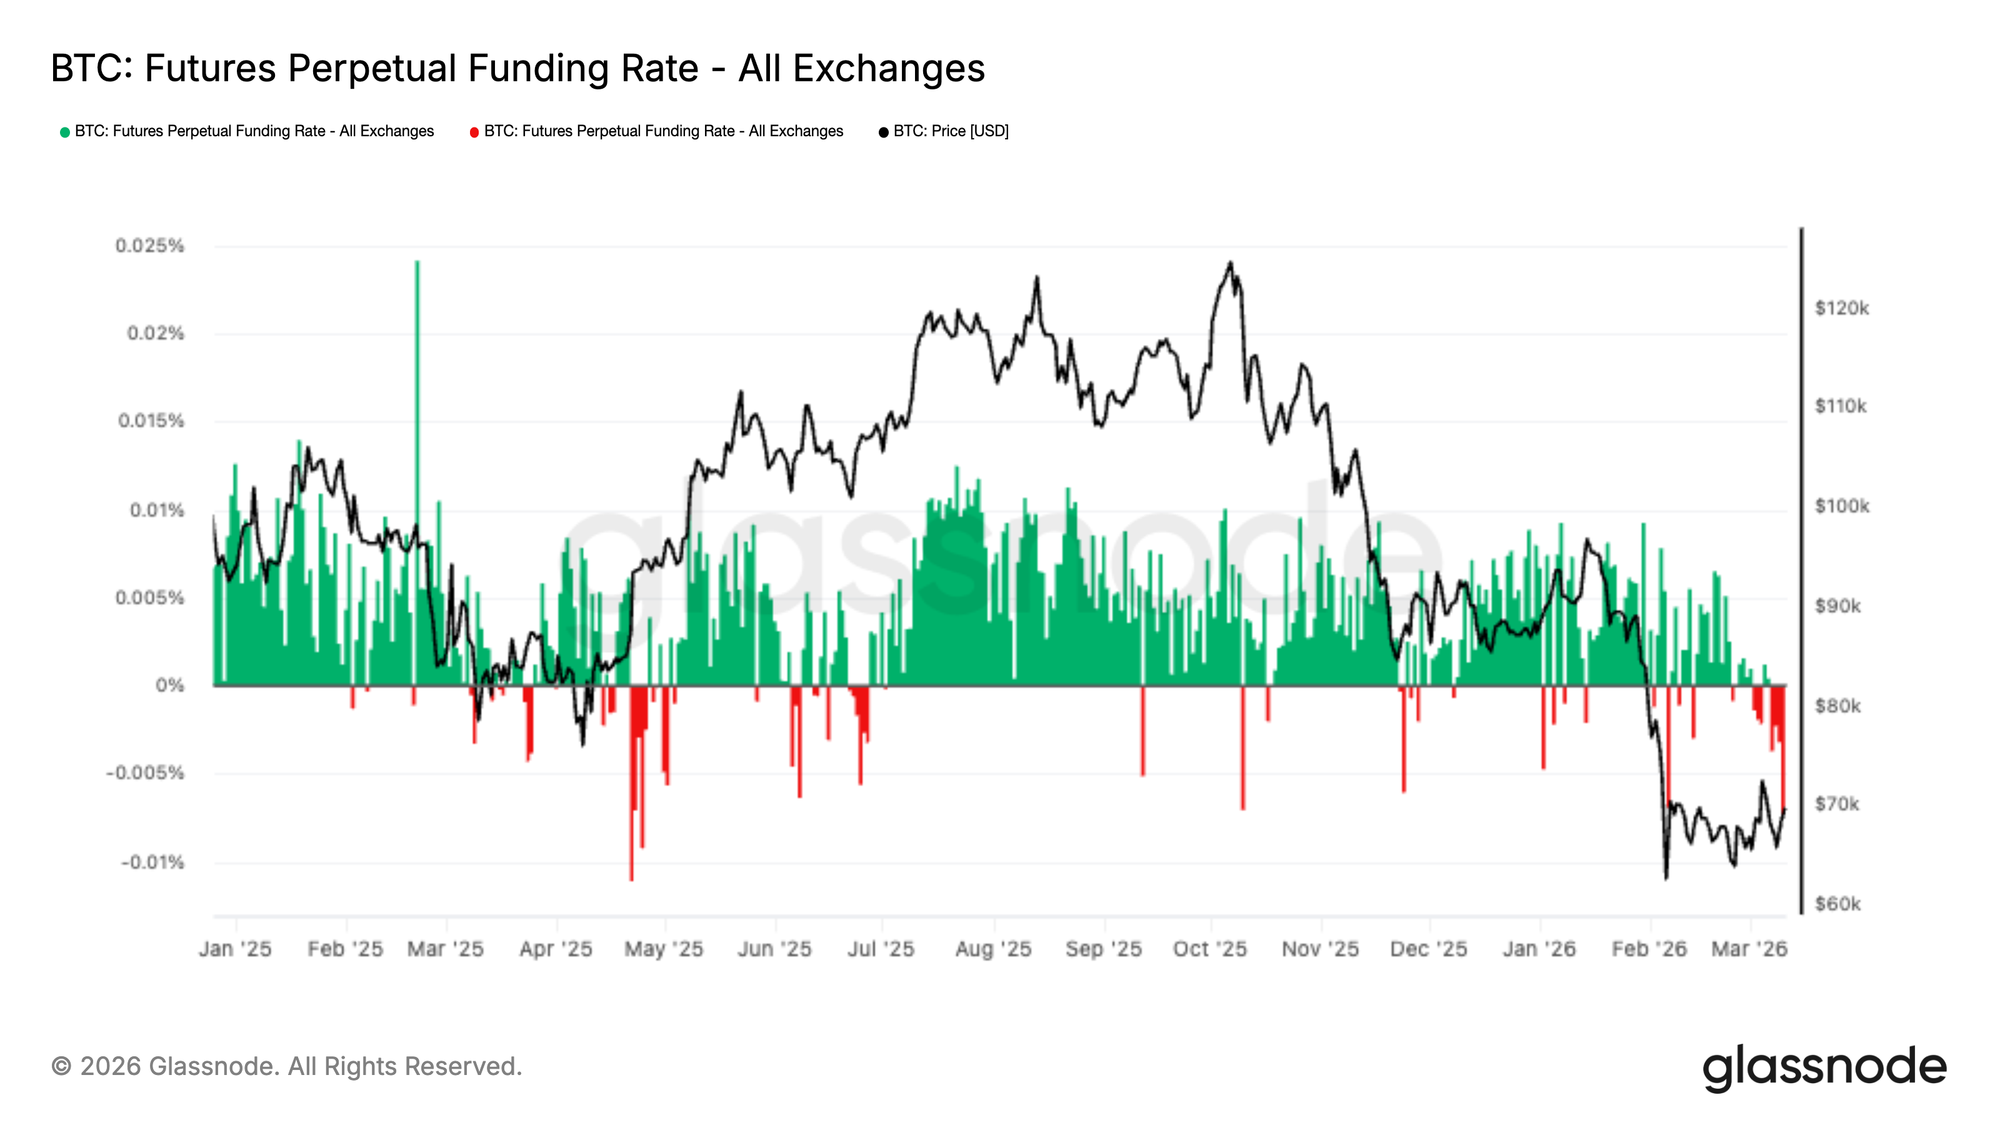
Perpetual futures funding rates have shifted decisively negative in recent sessions, reflecting an increasing dominance of short-side positioning across derivatives markets. This shift comes as Bitcoin trades near the lower end of its recent range following the sharp drawdown toward the $60k–$70k region.
Negative funding indicates that short sellers are now paying a premium to maintain their positions, suggesting a growing consensus around downside continuation. However, such crowded short positioning can also create asymmetric conditions, where a sharp upward move forces shorts to cover.
Should spot demand continue to recover, the build-up of short exposure raises the potential for a short squeeze, which could amplify upside volatility if forced liquidations begin to cascade.
Implied Volatility: Front-End Premium Starts to Ease
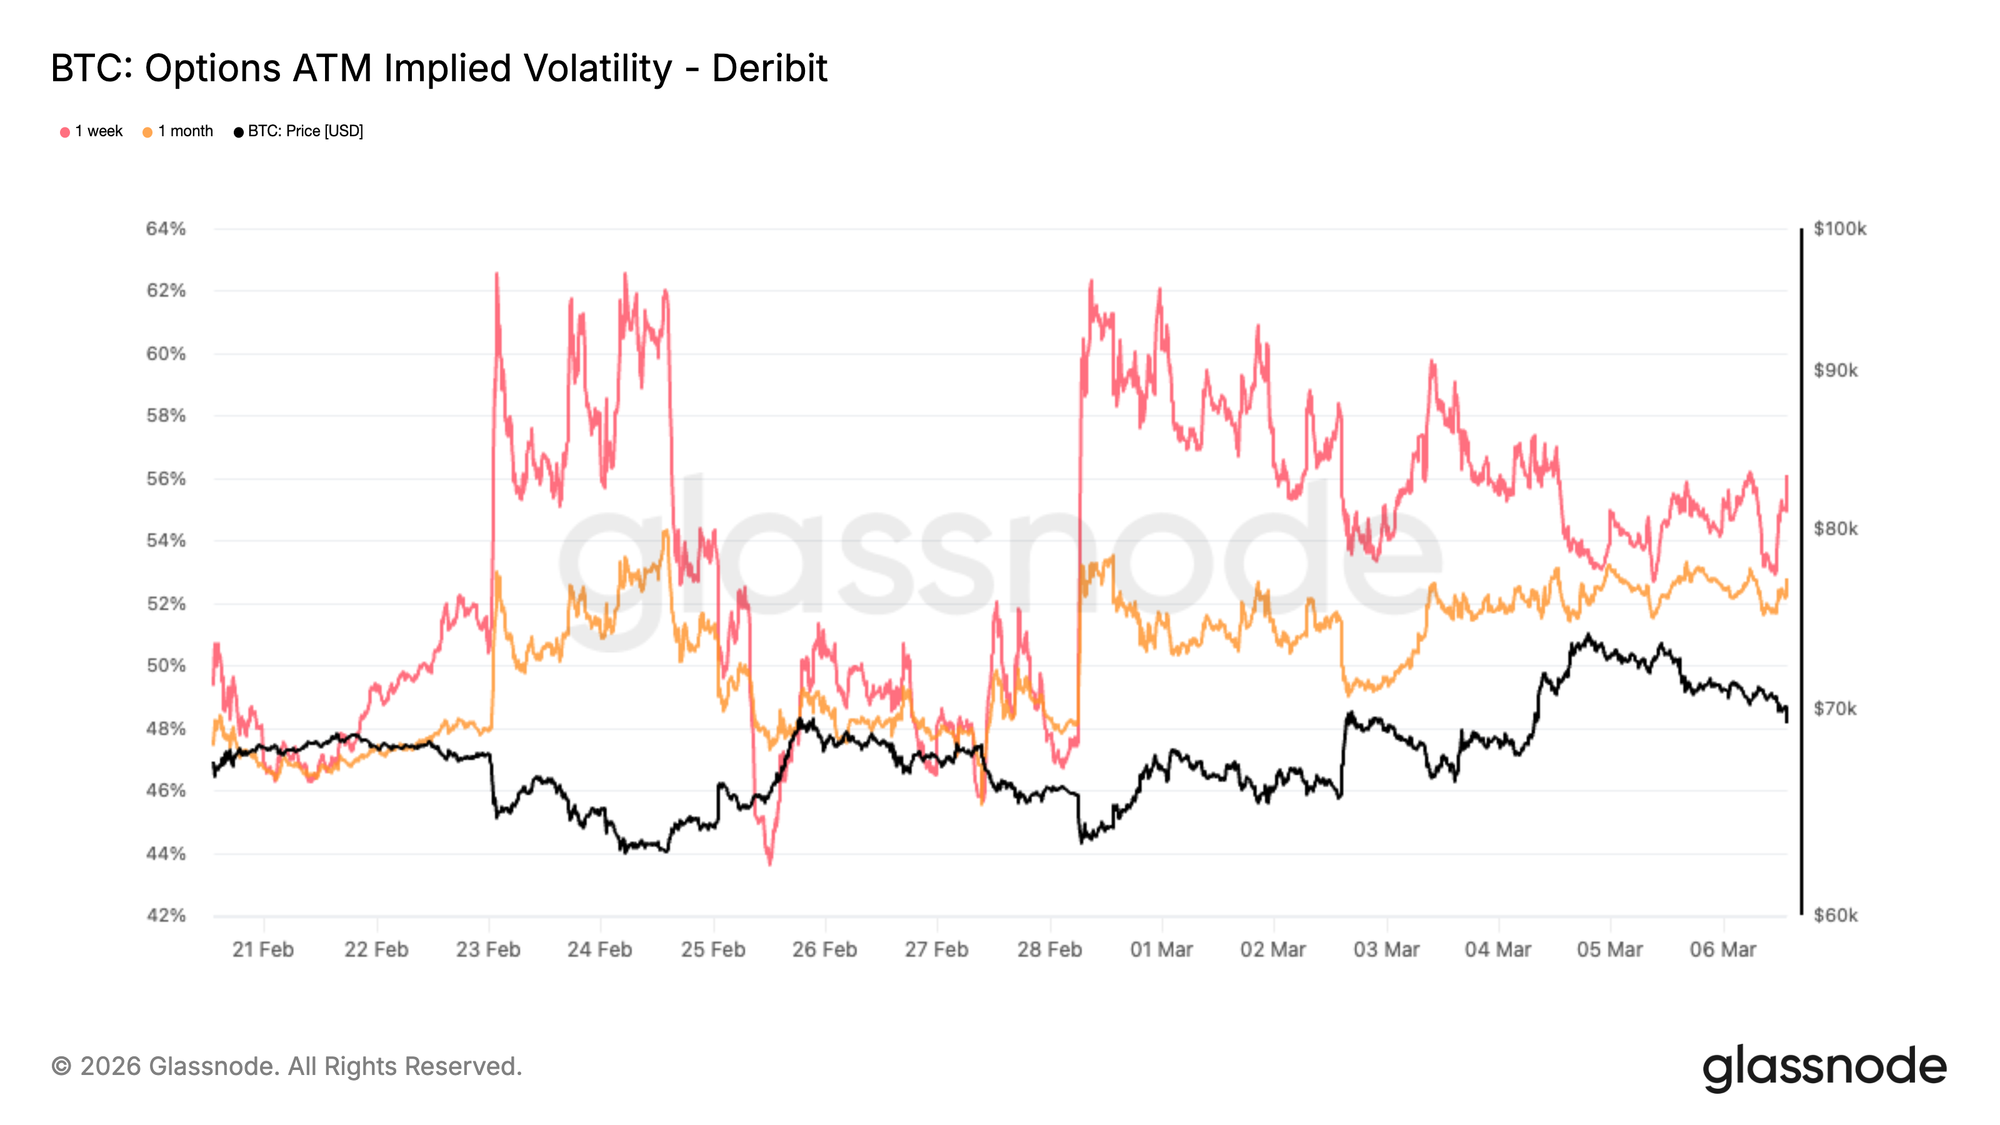
Bitcoin has remained surprisingly resilient following the recent geopolitical shock. That resilience is now reflected in the options market, where short-dated implied volatility has begun to ease.
Over the last week, the decline has been most visible at the front of the curve, with near-term implied volatility falling back toward the mid-50 percent area. Implied volatility represents the price traders are willing to pay for optionality. When uncertainty spikes, protection becomes expensive. The recent move lower suggests that the market sees less immediate event risk than it did earlier in the week.
The chart shows that front-end volatility, represented by the 1-week tenor, is compressing faster than longer maturities such as the 1-month, confirming that immediate event risk is fading. This shift does not mean volatility has fully normalized. Levels remain elevated compared with recent months, showing that the market is still pricing a degree of uncertainty.
What has changed is the urgency. Traders appear less focused on immediate downside shocks and are gradually moving away from aggressive short-term hedging.
25 Delta Skew: Defensive Positioning Begins to Ease
With volatility cooling, skew offers insight into how traders are positioning for directional risk.
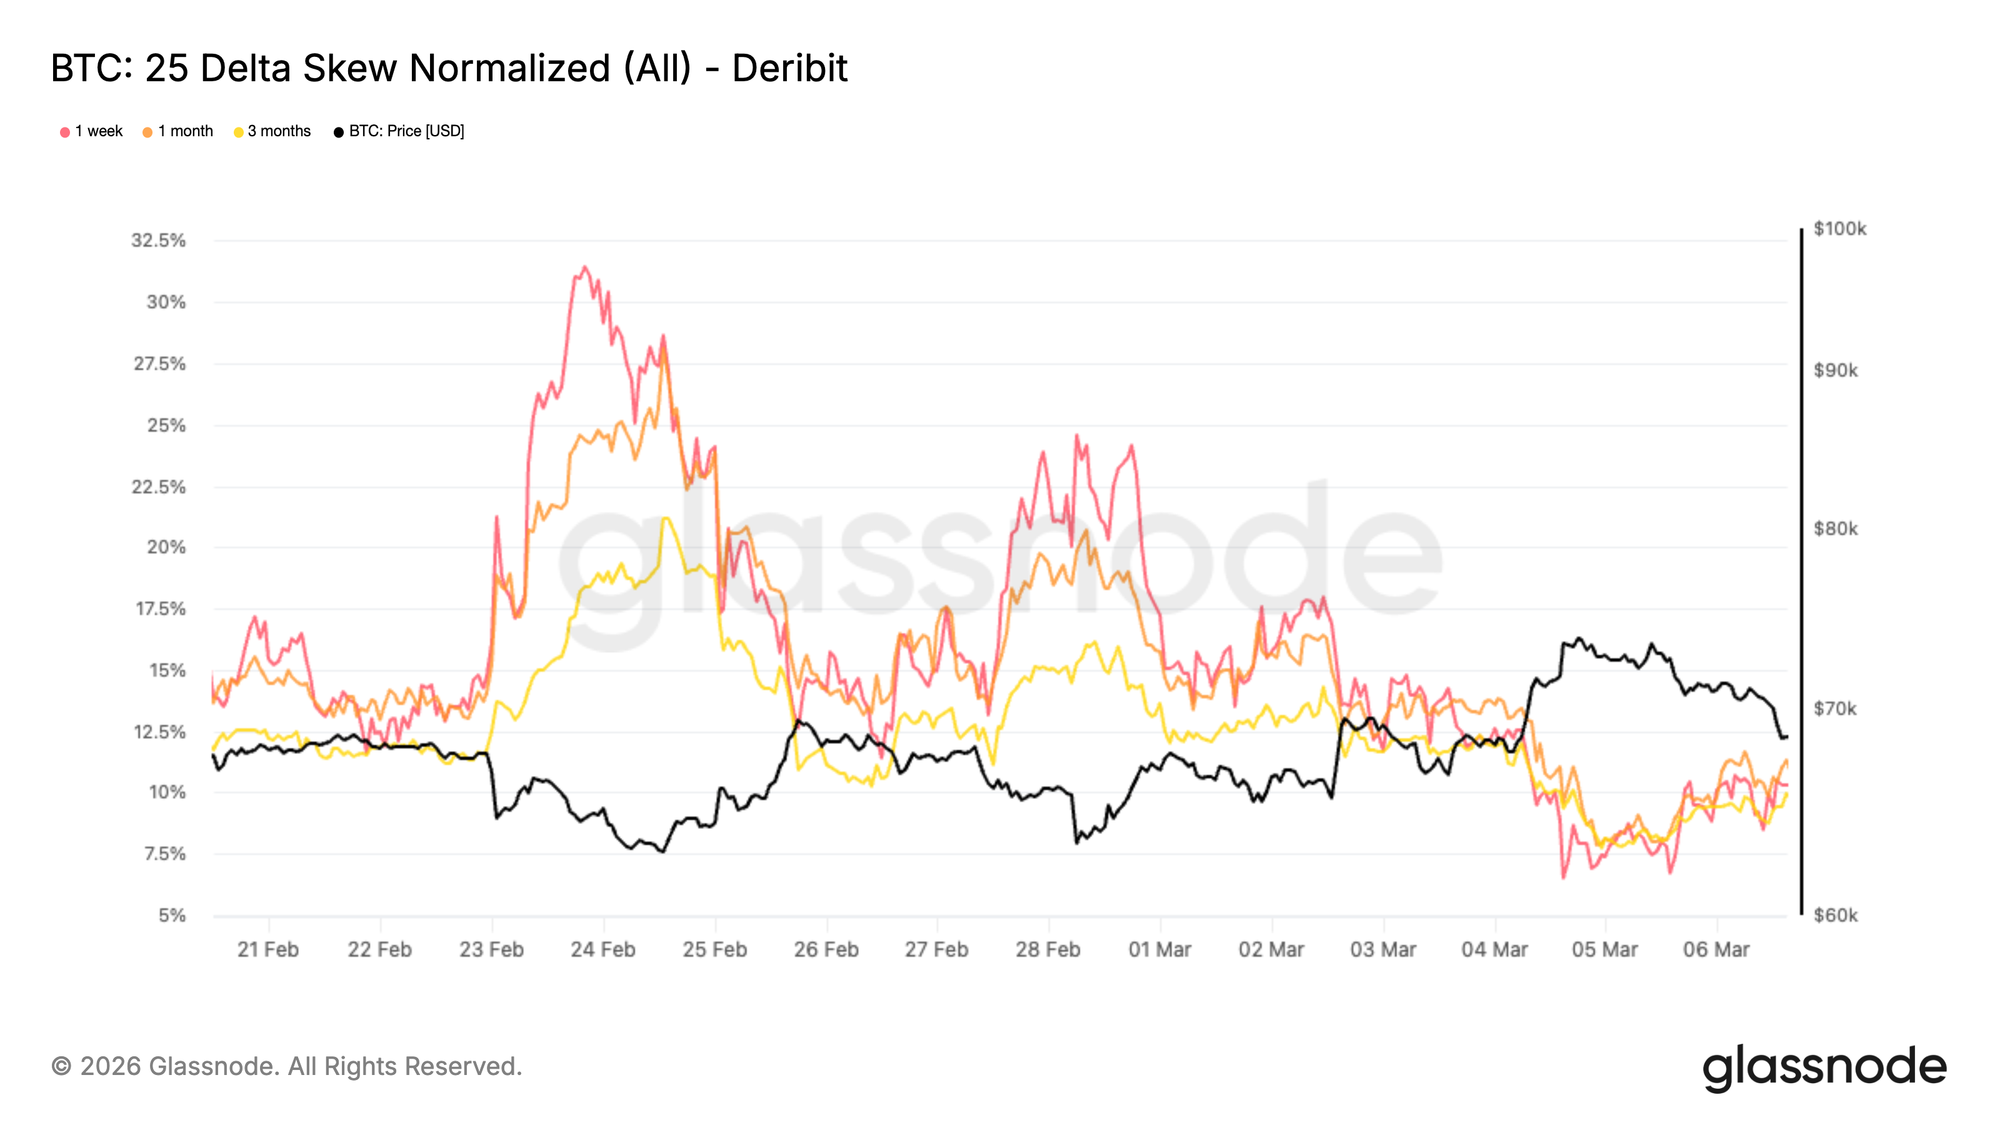
Across maturities, 25 delta risk reversals remain negative, meaning put options continue to trade at higher implied volatility than comparable calls. This reflects the fact that demand for downside protection is still present across the market.
However, the magnitude of that skew has started to compress. Over the past sessions, skew has tightened meaningfully, indicating that the intensity of defensive positioning is beginning to fade.
Skew essentially measures the relative demand for protection versus participation. When traders aggressively hedge downside risk, puts become significantly more expensive than calls. As that imbalance narrows, it typically signals that the market is becoming more comfortable taking directional exposure again.
As shown in the chart, the 1-week skew is now sitting around 10% put skew, down from the recent high of 31% reached on March 23. This shift suggests that while caution remains, the defensive tone that dominated during the shock is gradually easing.
Options Flow: Upside Exposure Gaining Traction
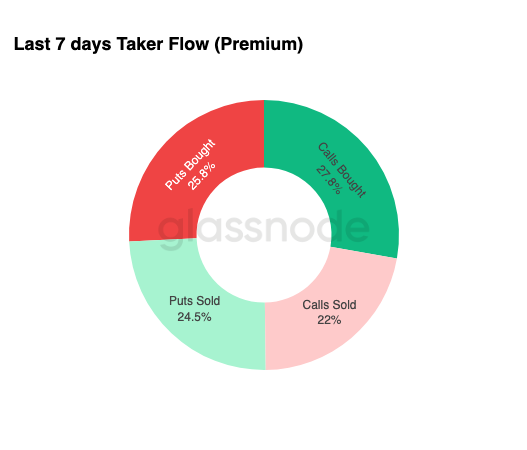
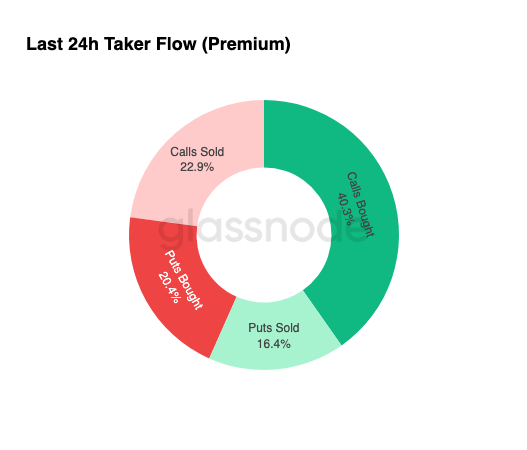
The largest options transactions observed over the past 24 hours have been concentrated in call buying, accounting for 40.3% of total options activity. Over the past week, call buying was already the dominant flow, representing 27.8% of options activity. This trend has accelerated, with the share of call buying climbing to 40.3% over the last 24 hours.
Calls provide exposure to upside moves while limiting downside risk, making them a common instrument for positioning during the early stages of a recovery.
What makes the current setup particularly interesting is the contrast between flow and pricing. Skew remains negative, meaning downside protection is still relatively expensive, yet traders are increasingly accumulating upside exposure through calls.
This pattern often appears when sentiment begins to improve but the broader market has not fully repriced risk. Participants start positioning for upside opportunities while still keeping some defensive structures in place.
Rather than signaling an outright bullish shift, the flow suggests a gradual transition, with traders cautiously testing the upside while maintaining protection against potential downside risks.
Gamma Exposure: $75K as the Key Upside Magnet
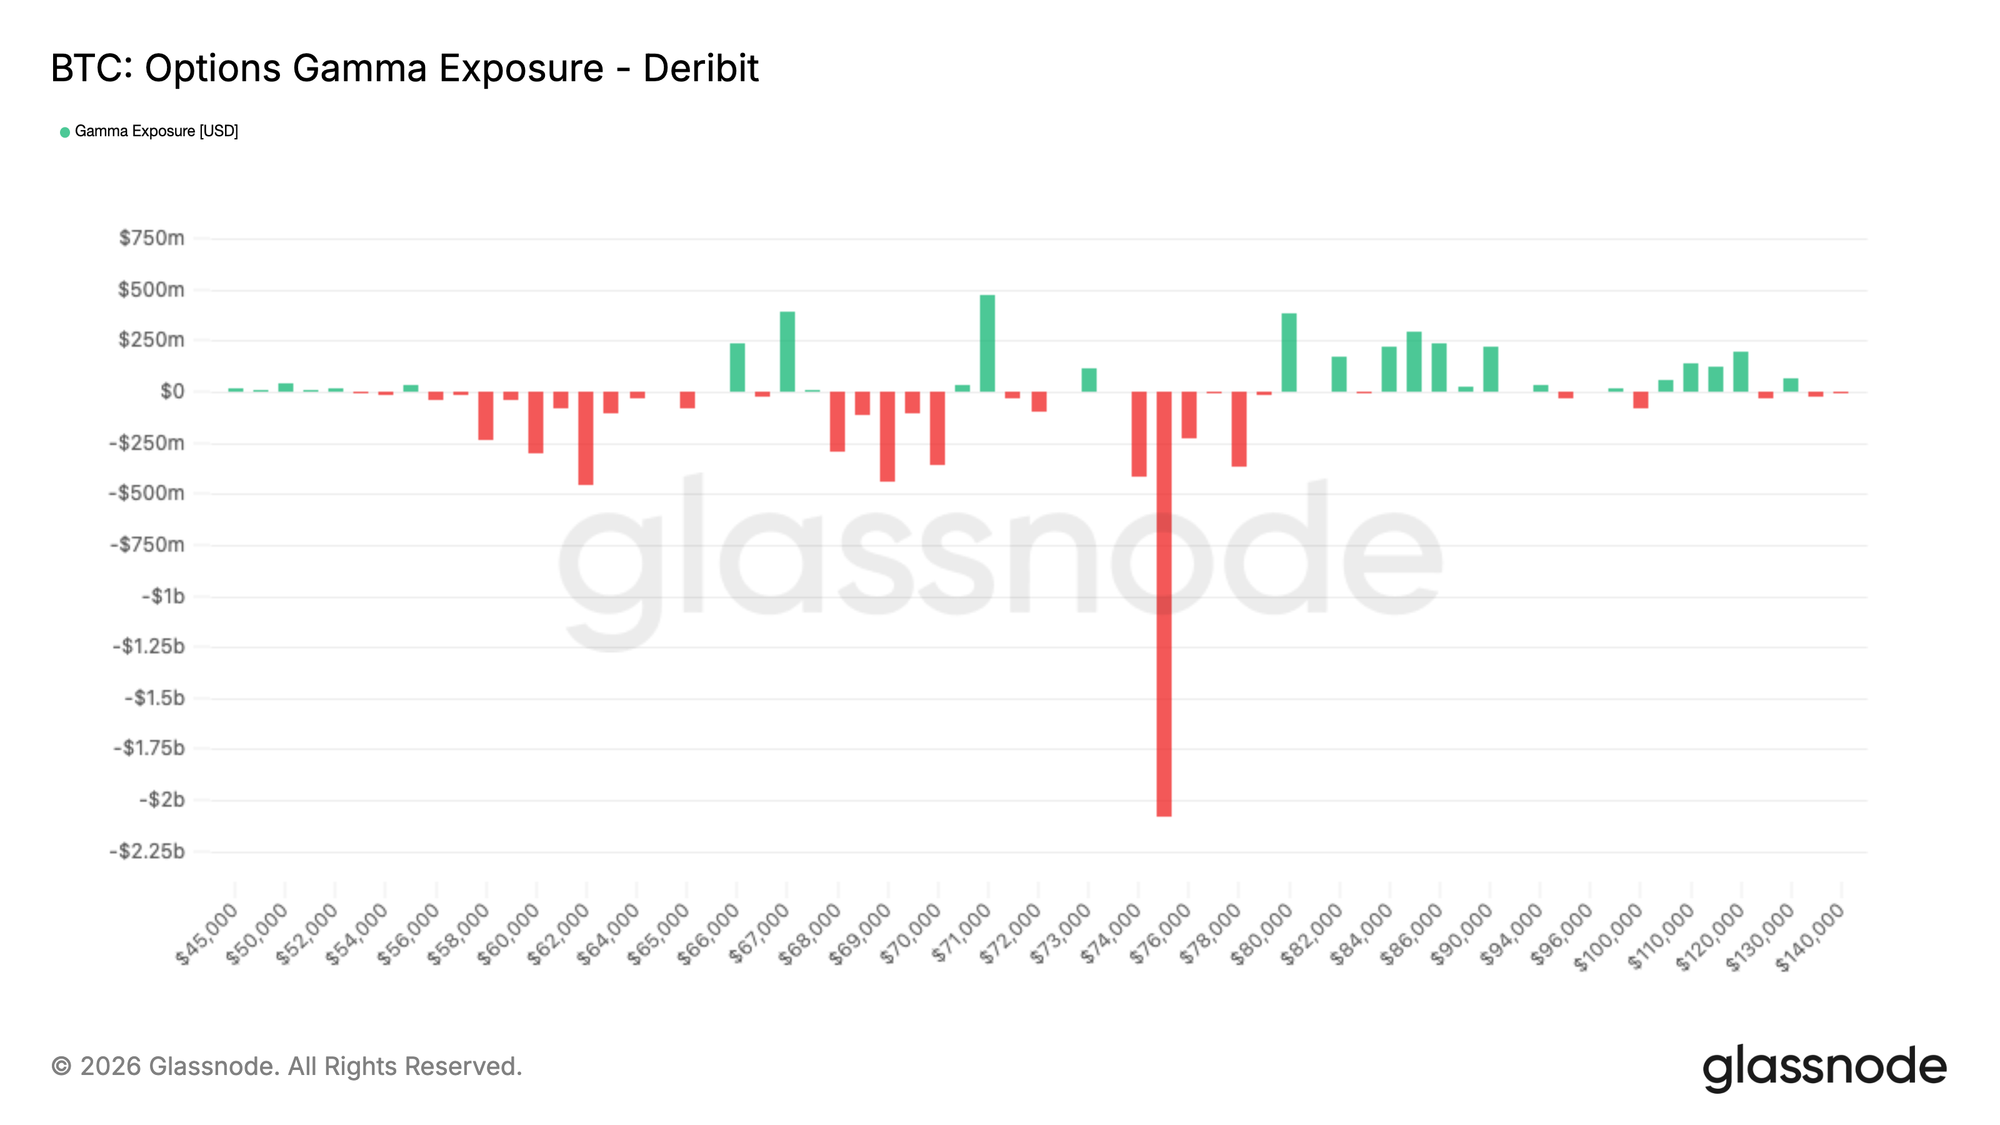
With Bitcoin trading around $69.5K at the time of writing, spot currently sits in a mild short gamma corridor between roughly $67K and $71K. Around $400 million of positive gamma sits on each side of this range, creating nearby levels where dealer hedging can temporarily stabilize price.
Gamma describes how dealer hedging flows react to price changes. When dealers hold positive gamma around a strike, they tend to sell rallies and buy dips to stay hedged, which can slow price movements and create short term support and resistance.
However, it would not take significant volume to break through either side of this corridor. The more important level sits higher.
Around the $75K strike, roughly $2 billion of negative gamma is concentrated. In a short gamma zone, dealer hedging flows reinforce the move. If price pushes into that region, hedging activity can accelerate the move higher toward the $80K area.
Notably, around $1.8 billion of this positioning expires on March 27, the end of Q1 expiry, meaning the gamma landscape could shift meaningfully once these options roll off.
Conclusion
Bitcoin remains under pressure, but several signals suggest the market may be entering a more stabilised phase. Illiquid supply continues to expand, pointing to ongoing conviction among long-term holders even as price trades below key on-chain cost basis levels.
Across off-chain markets, conditions are beginning to improve. US Spot ETF flows have turned positive after a prolonged outflow regime, and spot CVD is starting to recover, indicating buyers are beginning to re-engage. At the same time, perpetual funding has moved negative, reflecting increasingly crowded short positioning that could amplify upside if demand continues to strengthen.
Options markets add to this picture, with front-end implied volatility compressing as traders reduce short-term hedging demand. Delta skew remains relatively balanced, while dealer gamma positioning appears broadly neutral, suggesting options markets are no longer heavily skewed toward immediate downside protection.
Taken together, the market appears to be shifting from forced deleveraging toward early stabilisation, with scope for recovery if spot demand continues to build.
Disclaimer: This report does not provide any investment advice. All data is provided for informational and educational purposes only. No investment decision shall be based on the information provided here, and you are solely responsible for your own investment decisions.
Exchange balances presented are derived from Glassnode’s comprehensive database of address labels, which are amassed through both officially published exchange information and proprietary clustering algorithms. While we strive to ensure the utmost accuracy in representing exchange balances, it is important to note that these figures might not always encapsulate the entirety of an exchange’s reserves, particularly when exchanges refrain from disclosing their official addresses. We urge users to exercise caution and discretion when utilizing these metrics. Glassnode shall not be held responsible for any discrepancies or potential inaccuracies.






