Polkadot jumps 11% after channel breakout – Can DOT breach $1.686?

ambcryptoPublicado em 2026-03-16Última atualização em 2026-03-16

Resumo

Polkadot (DOT) surged over 11% in 24 hours, accompanied by a 78% increase in trading volume, signaling renewed buyer interest. The price broke out of a prolonged descending channel, reaching toward the $1.686 resistance level—a key barrier that could determine the next directional move. Technical indicators strengthened, with the RSI climbing to 57.51, indicating bullish momentum. Market data revealed aggressive buy-dominant order flow and strong accumulation pressure in spot markets. Additionally, top Binance traders showed a long-biased stance, with 61.66% holding long positions. A sustained break above $1.686 could open a path toward the $2.000 resistance zone.

Polkadot has surged over 11% in 24 hours as trading volume jumped nearly 78%, signaling renewed market activity as buyers returned aggressively to the DOT market.

Rising participation has accompanied the move toward the $1.59 region, suggesting that traders have stepped back into the market after weeks of subdued activity.

Increased liquidity has strengthened short-term price dynamics while expanding volatility across spot markets.

As a result, Polkadot [DOT] traded closer to an important resistance barrier that could influence the next directional move.

Descending channel breakout reshapes DOT structure

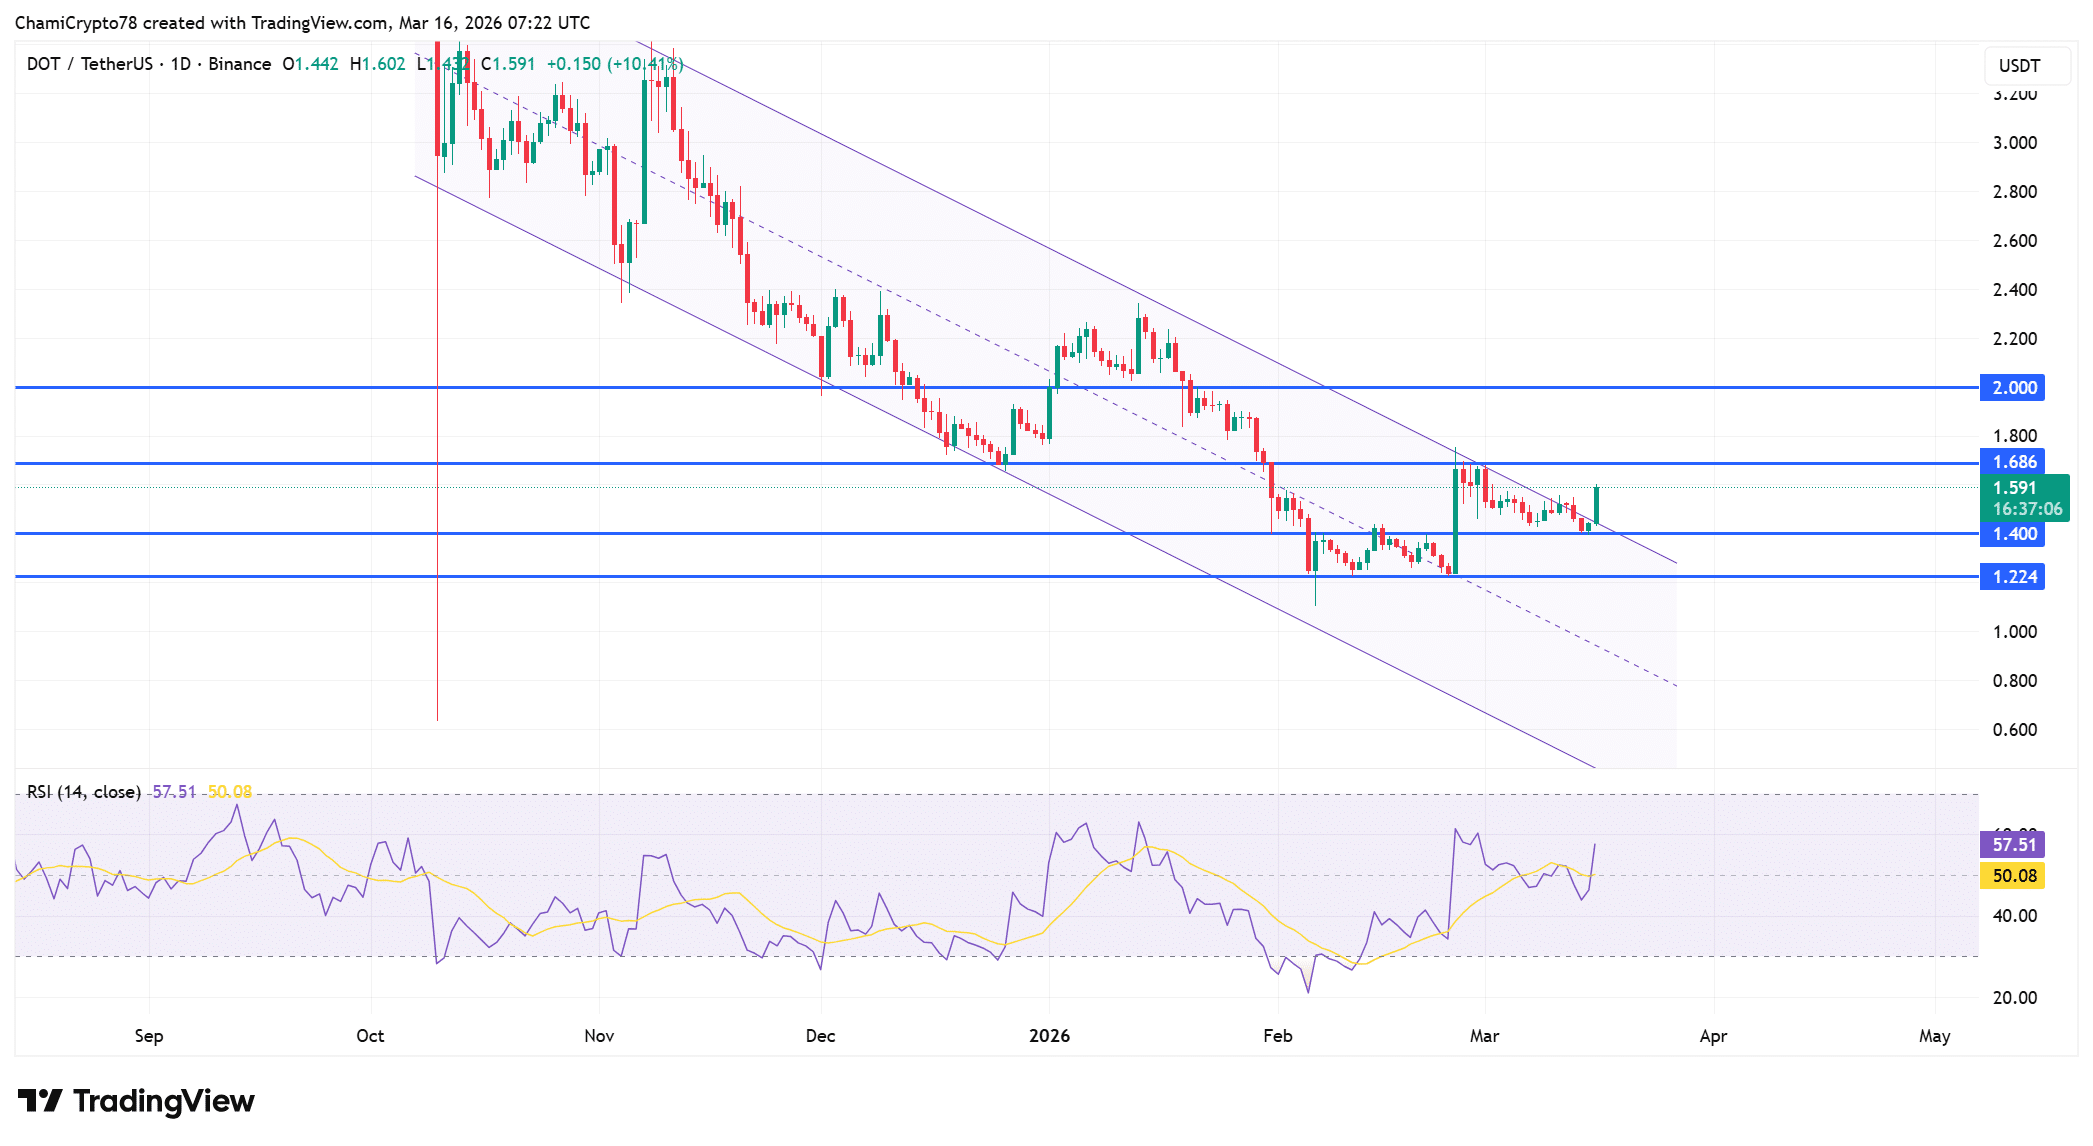
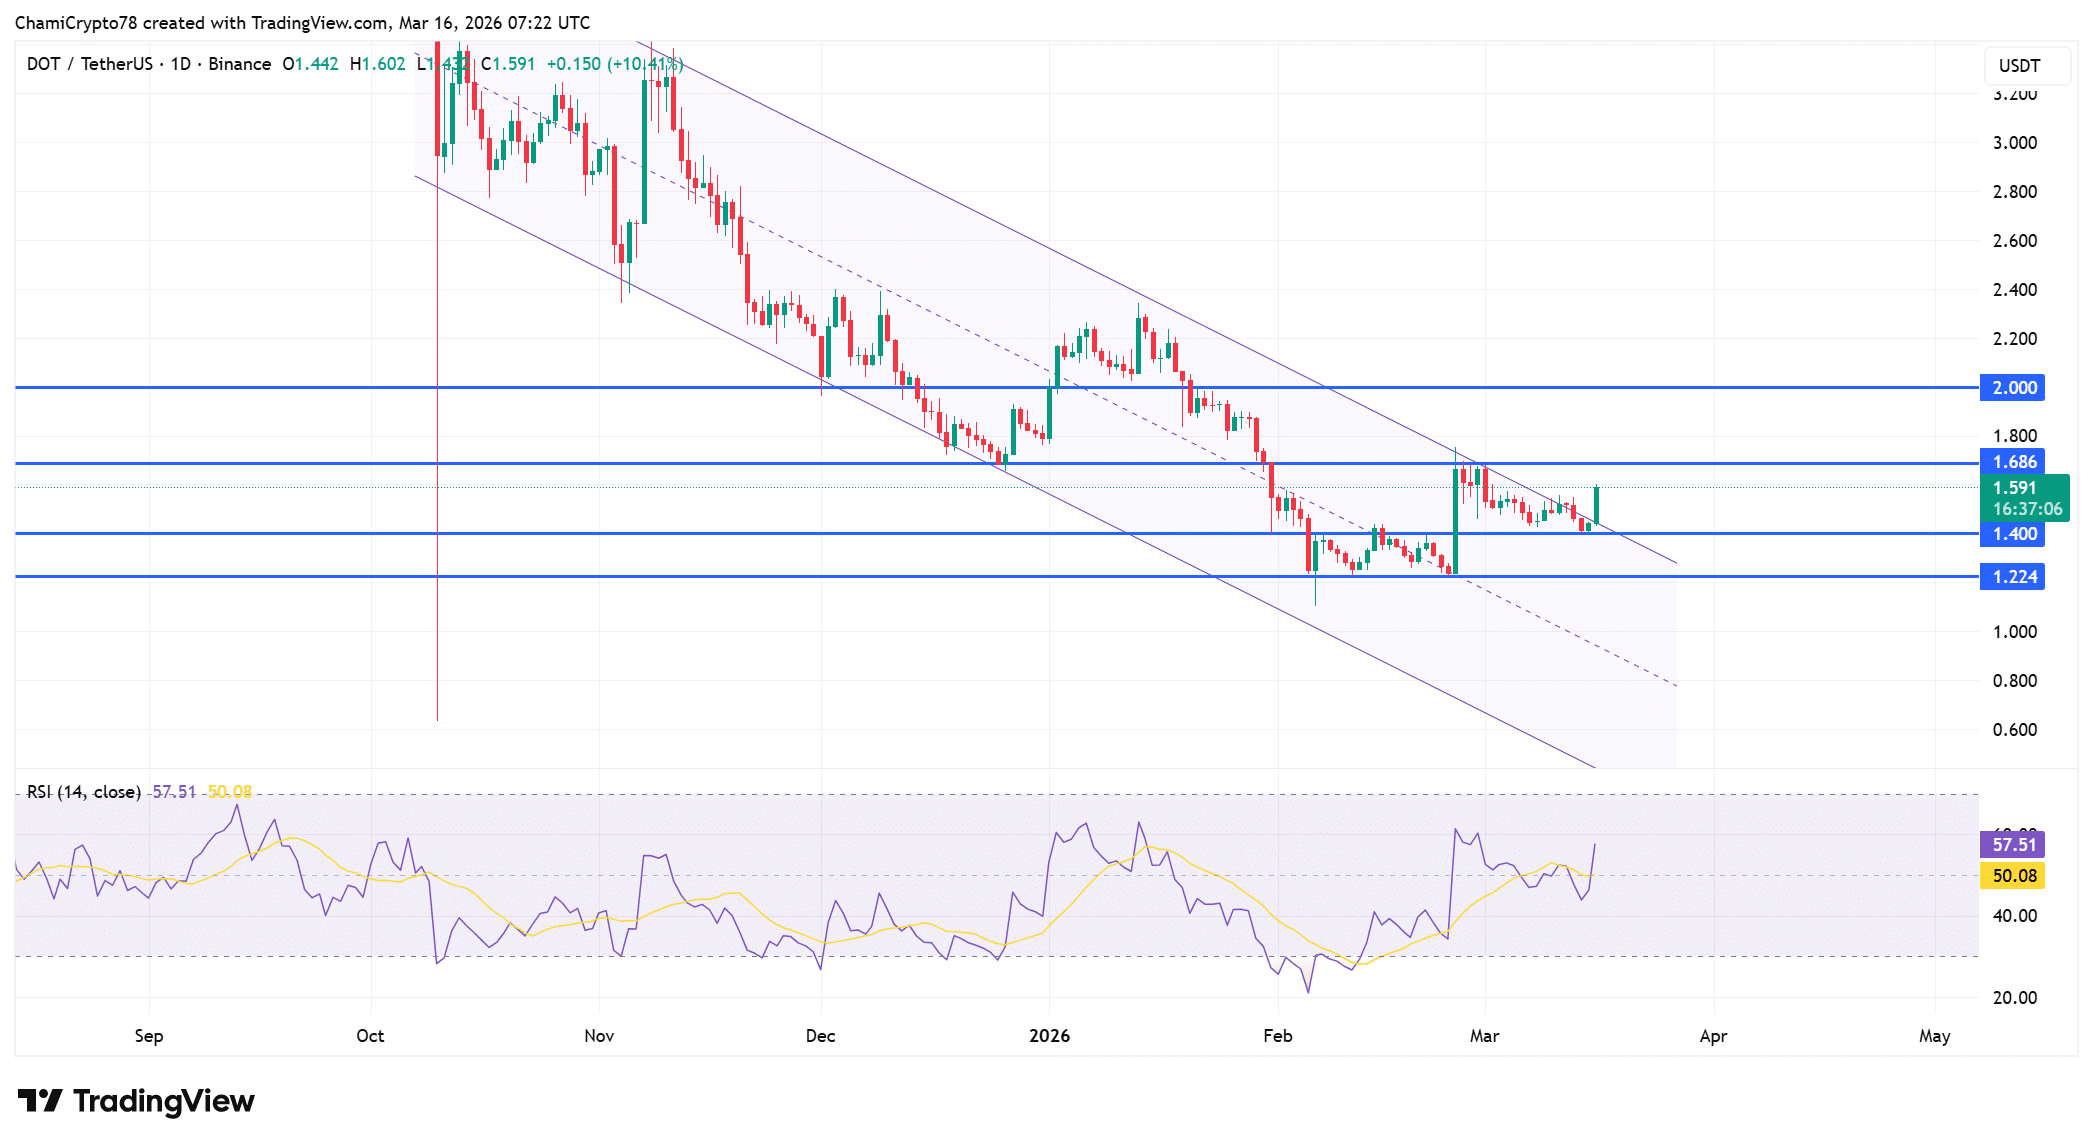
Price action reflected a notable structural shift after DOT had broken above a prolonged descending channel.

The breakout has followed the sharp rally that pushed the price toward the $1.686 resistance zone, placing the asset near a technical inflection point.

Earlier price compression inside the channel had restricted recovery attempts for months.

However, the recent surge has lifted the price above that declining boundary, signaling that bearish control has weakened considerably.

Technical indicators now reflect strengthening buyer activity as the RSI has climbed to 57.51, clearly above the 50 neutral threshold.

This shift suggests that demand has strengthened steadily following earlier weakness during the prolonged downtrend.

As buyers regained control of short-term price swings, the indicator has gradually advanced into bullish territory.

Meanwhile, DOT continued trading near $1.591, which places it between the $1.400 support level and the $1.686 resistance barrier.

Buyers have defended the lower zone repeatedly during recent sessions.

As a result, the breakout structure now attracts attention because a sustained push above $1.686 could open the path toward the $2.000 resistance region.
Source: TradingView

Buy-dominant order flow strengthens DOT demand

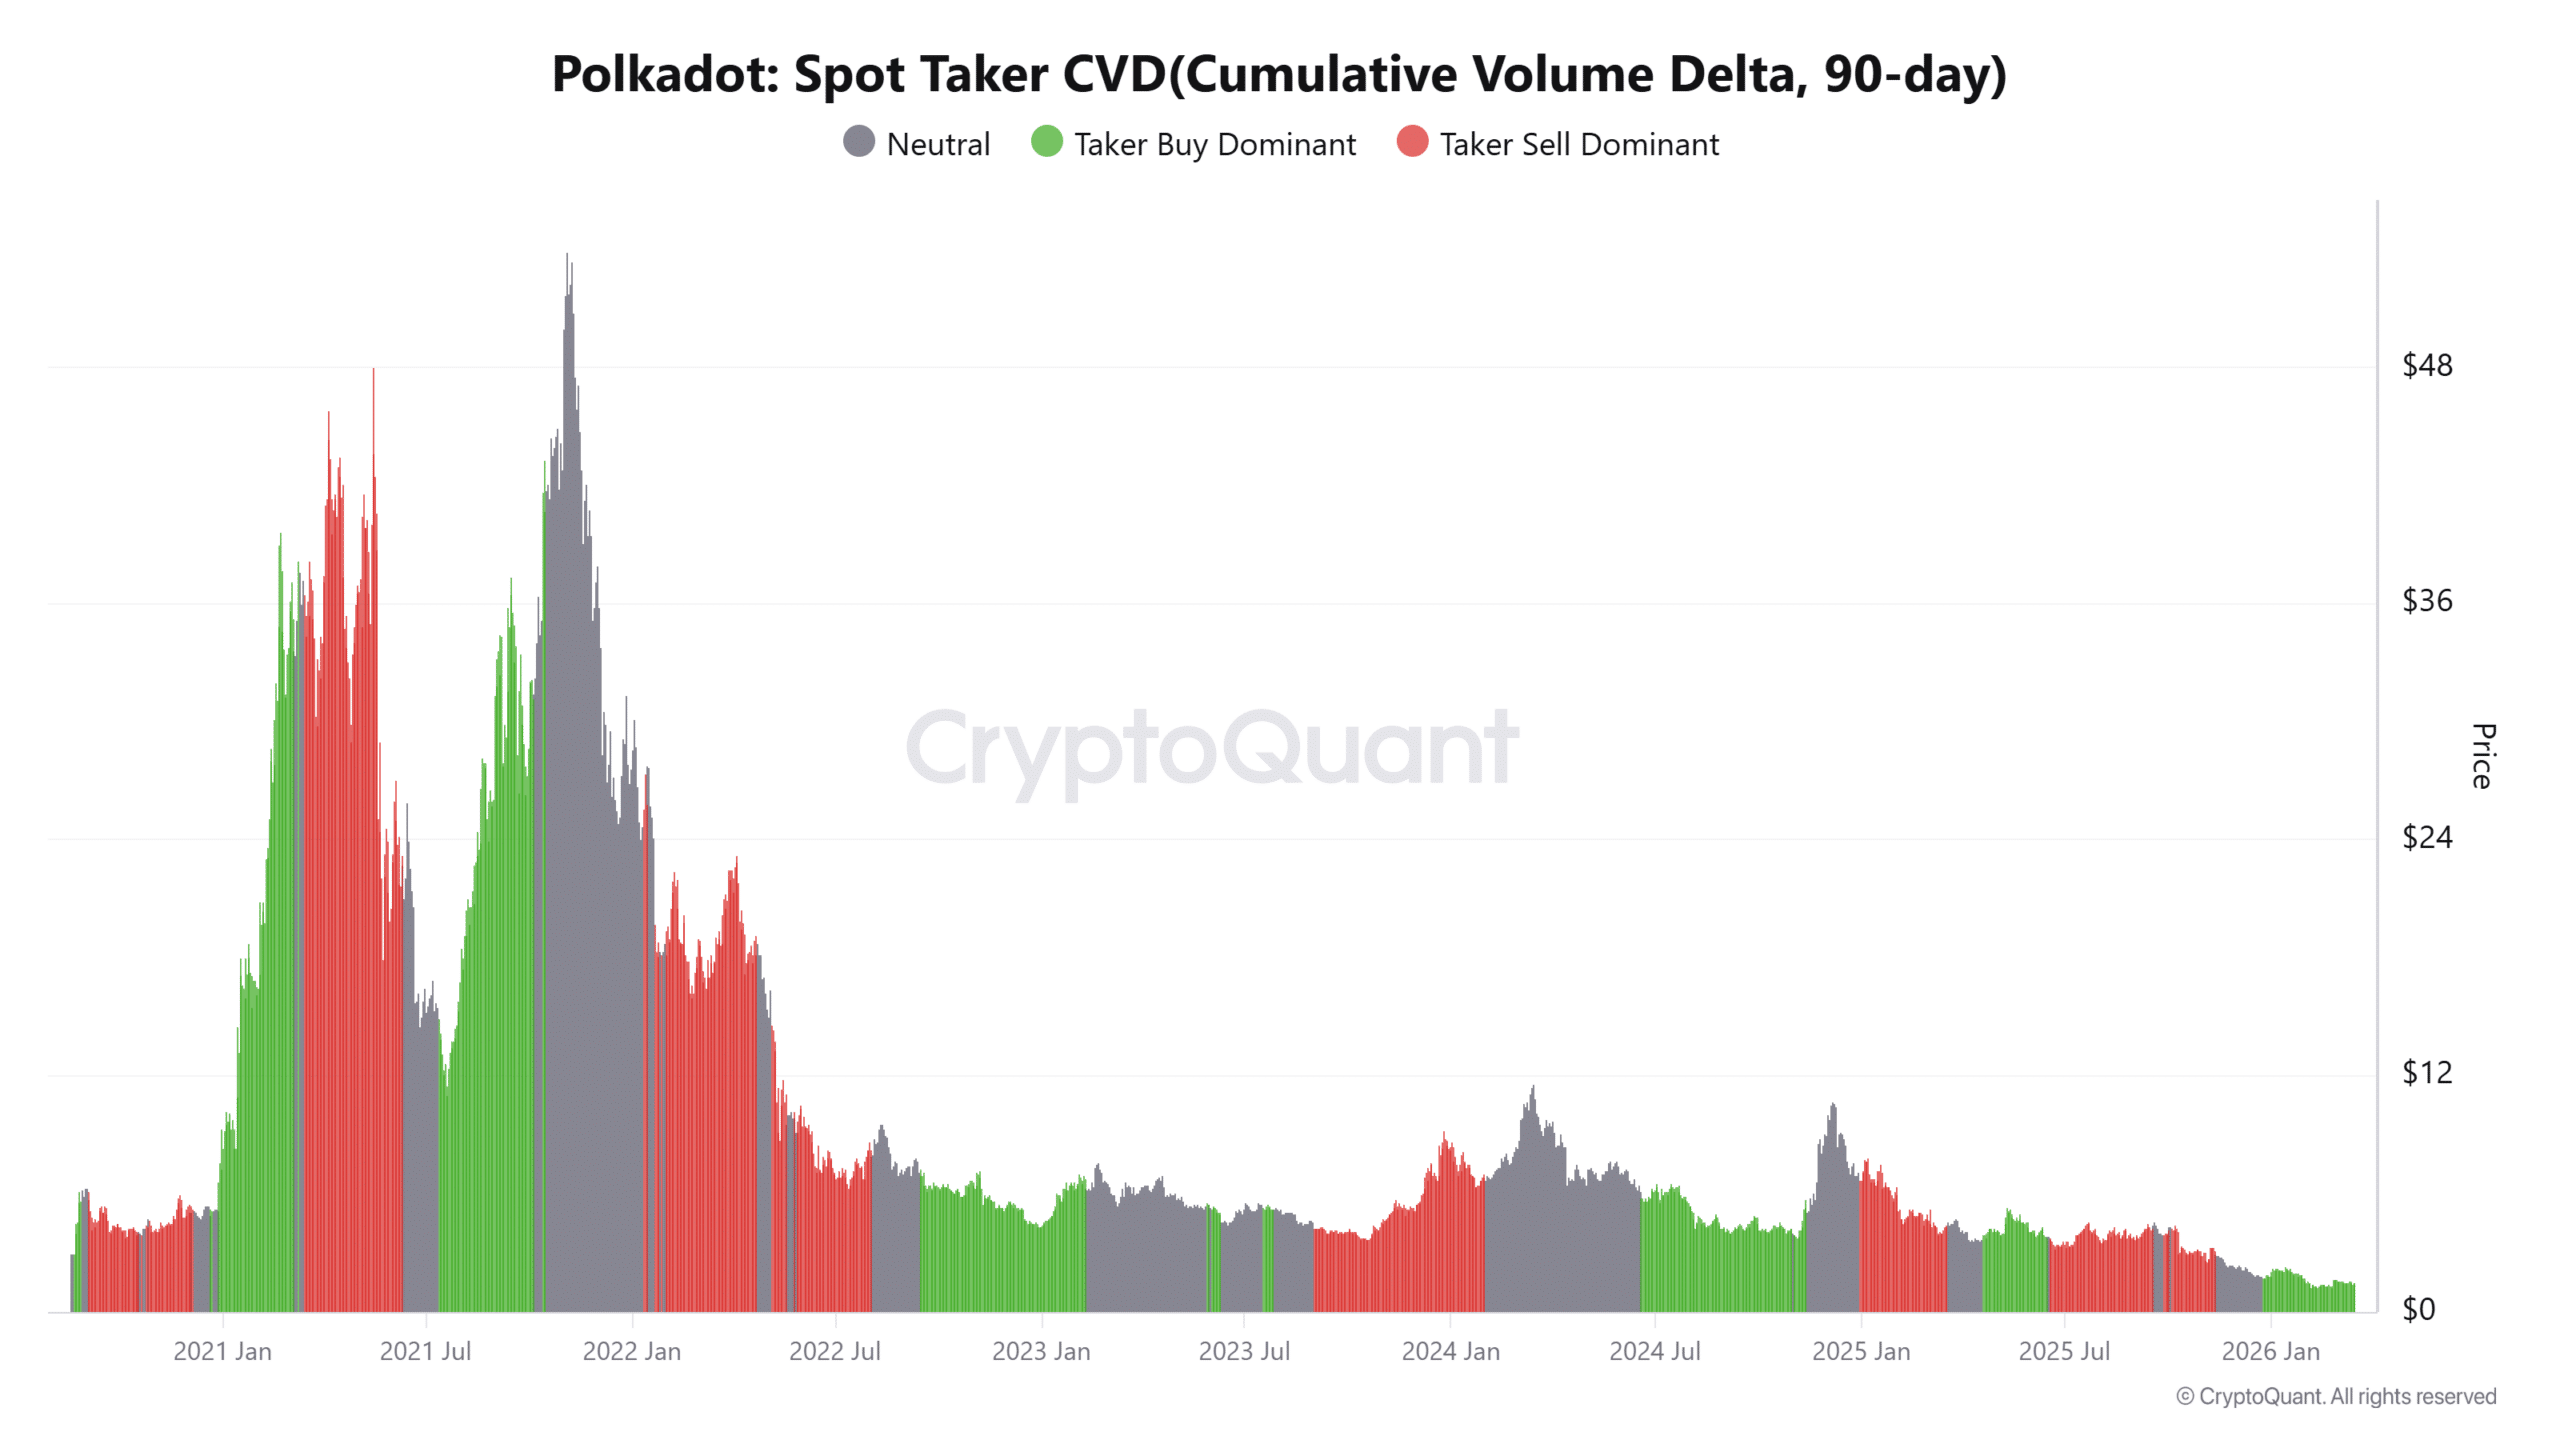
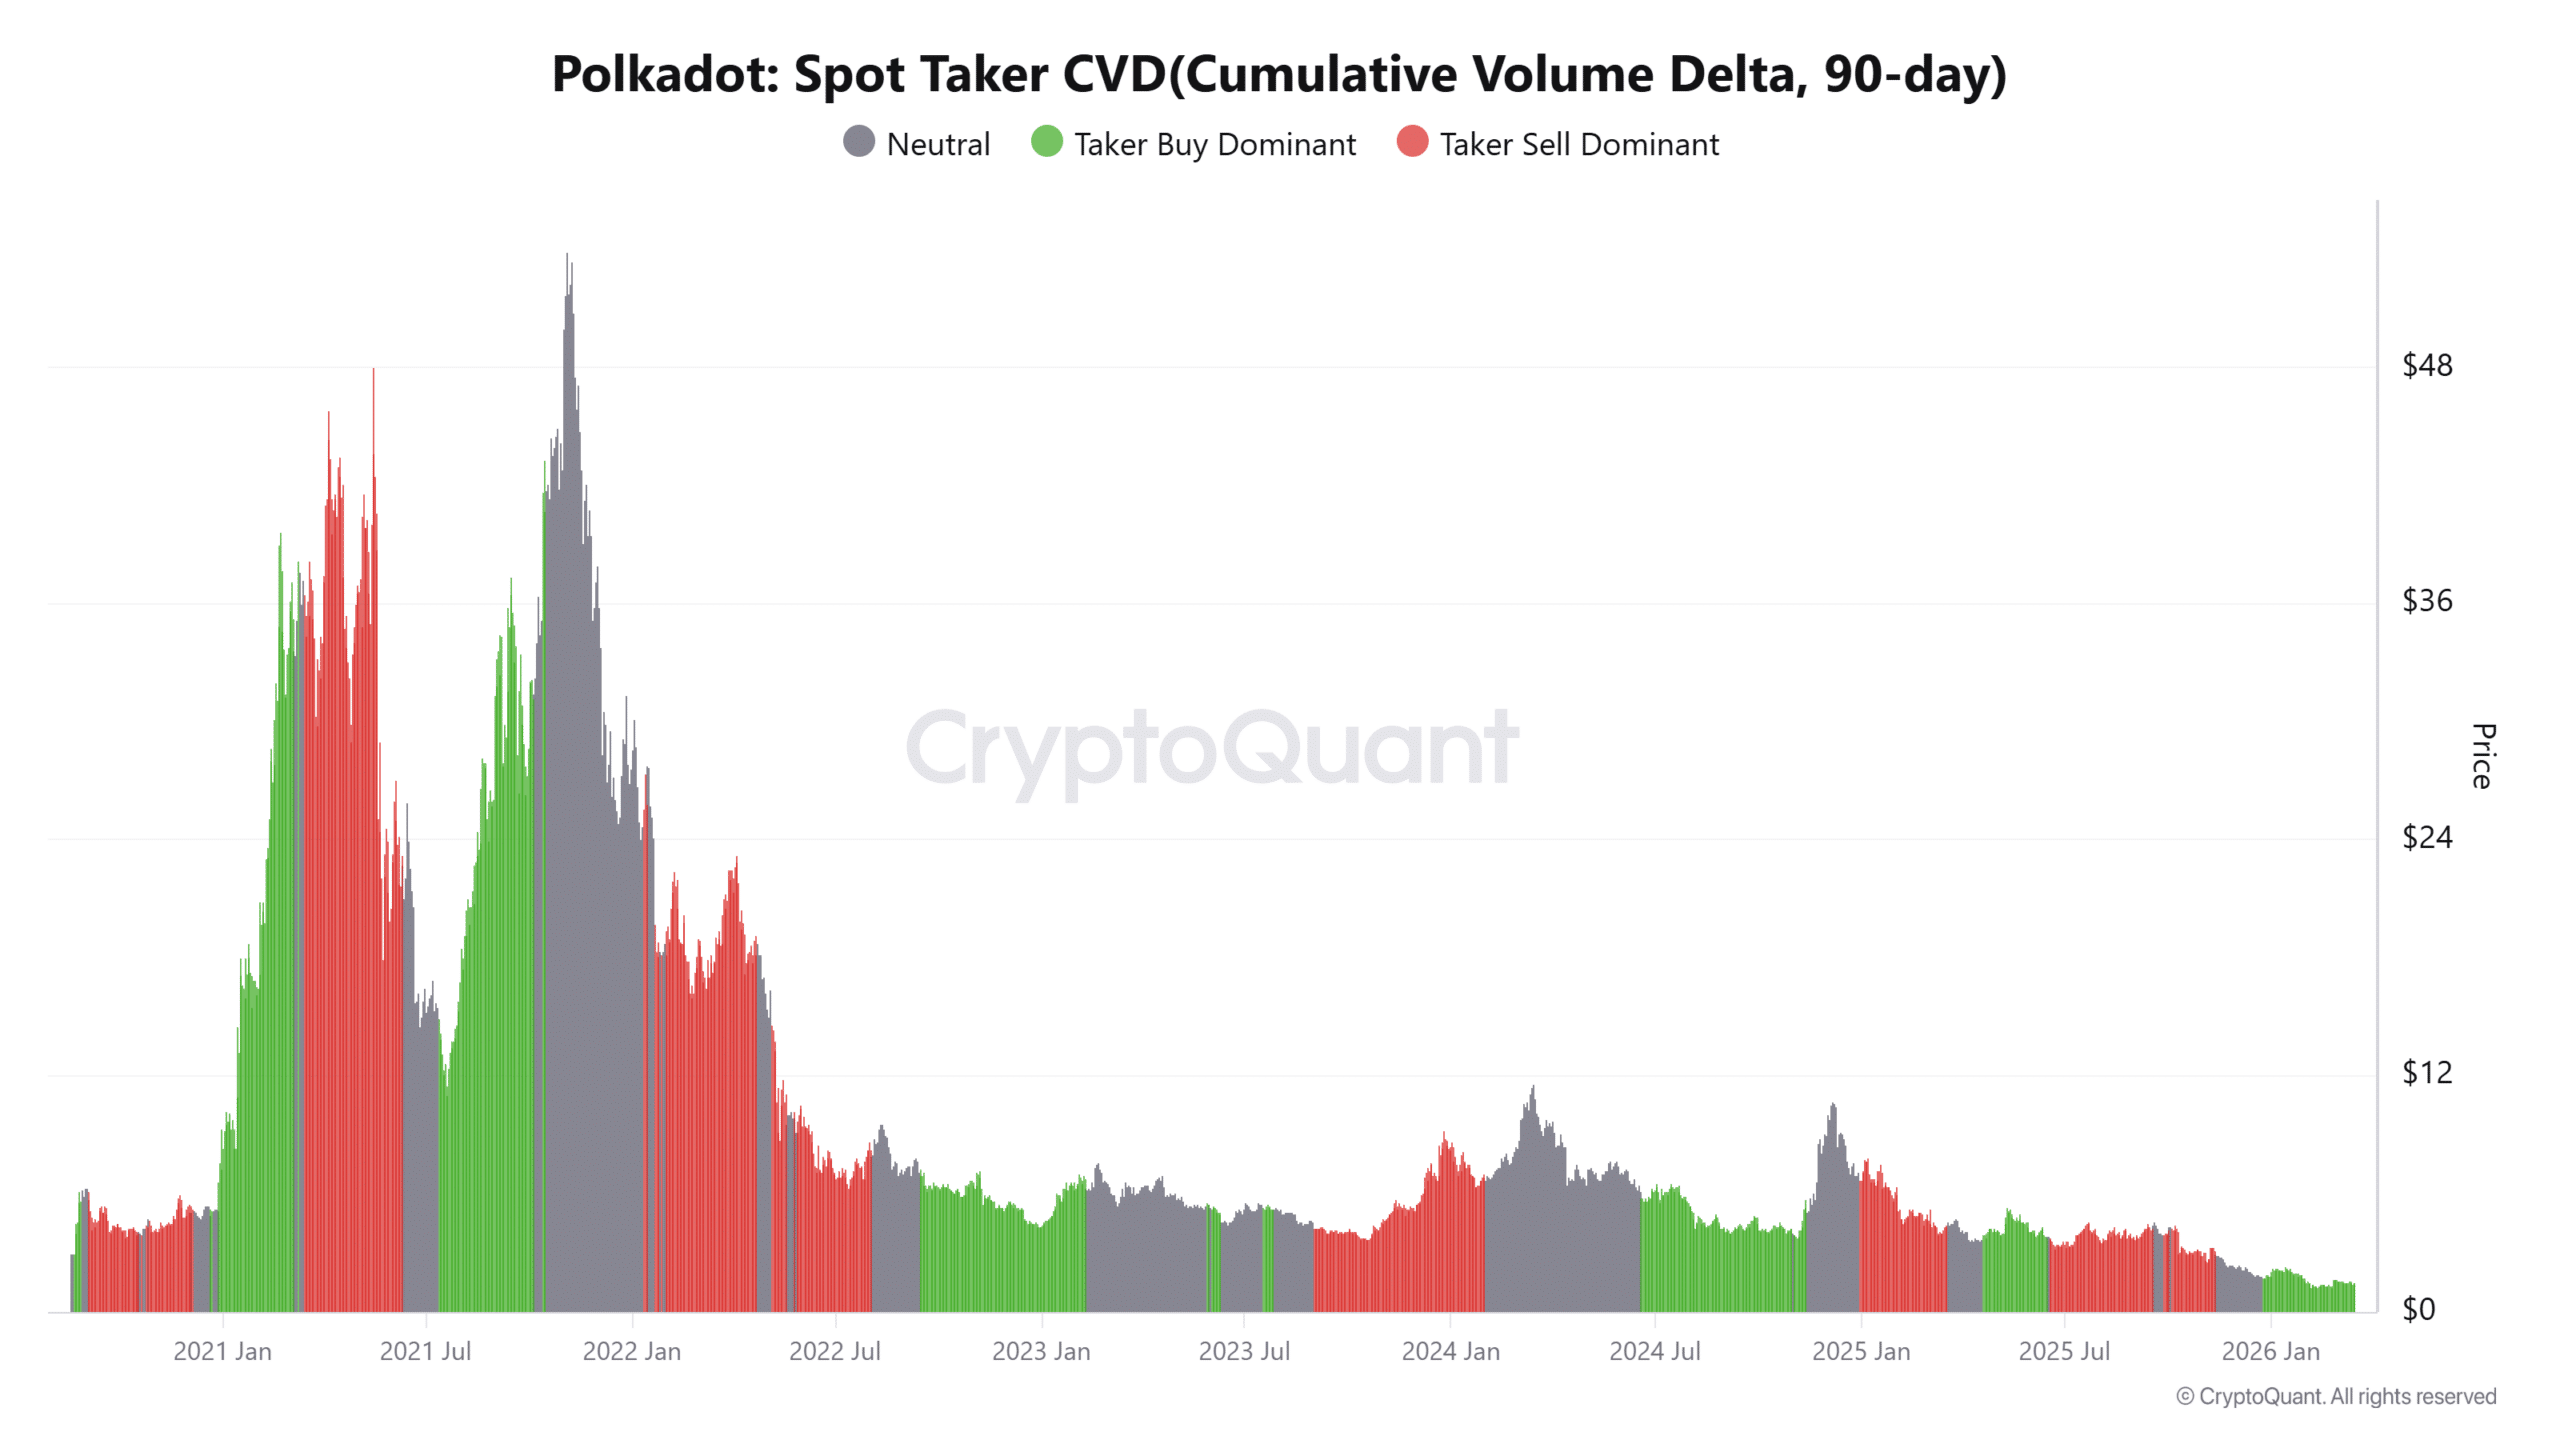
Market activity across spot exchanges now reflects strong buyer aggression as Spot Taker CVD has shifted into buy-dominant territory.

This metric tracks the cumulative difference between aggressive buy orders and sell orders, providing insight into trader conviction.

Recent readings suggest that market participants have increasingly executed buy orders at market prices rather than waiting for passive liquidity.

Such behavior often reflects stronger directional conviction among traders. In DOT’s case, this buyer-led order flow has emerged alongside rising trading activity and the recent price breakout.

As aggressive demand continues driving transactions, traders increasingly interpret the data as a signal that accumulation pressure has strengthened across spot markets.
Source: CryptoQuant

Top Binance traders lean heavily long on DOT

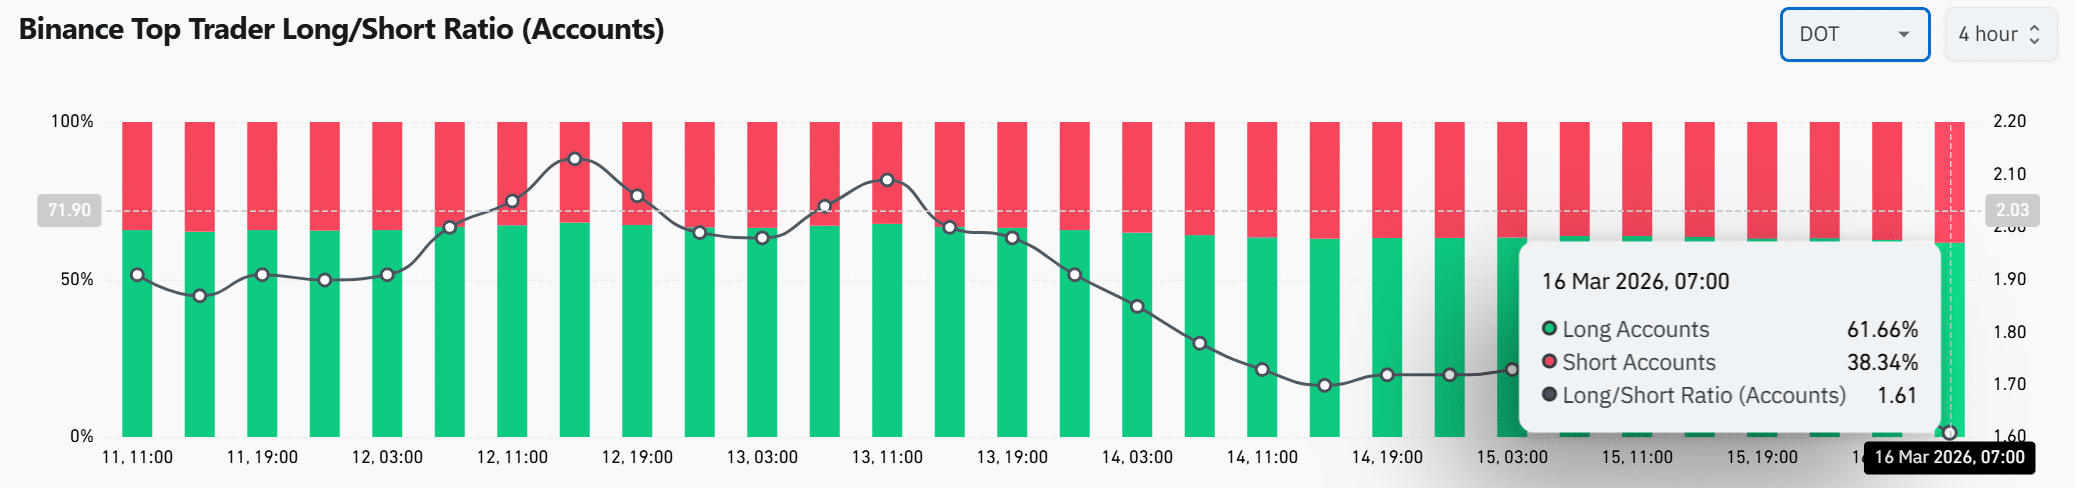
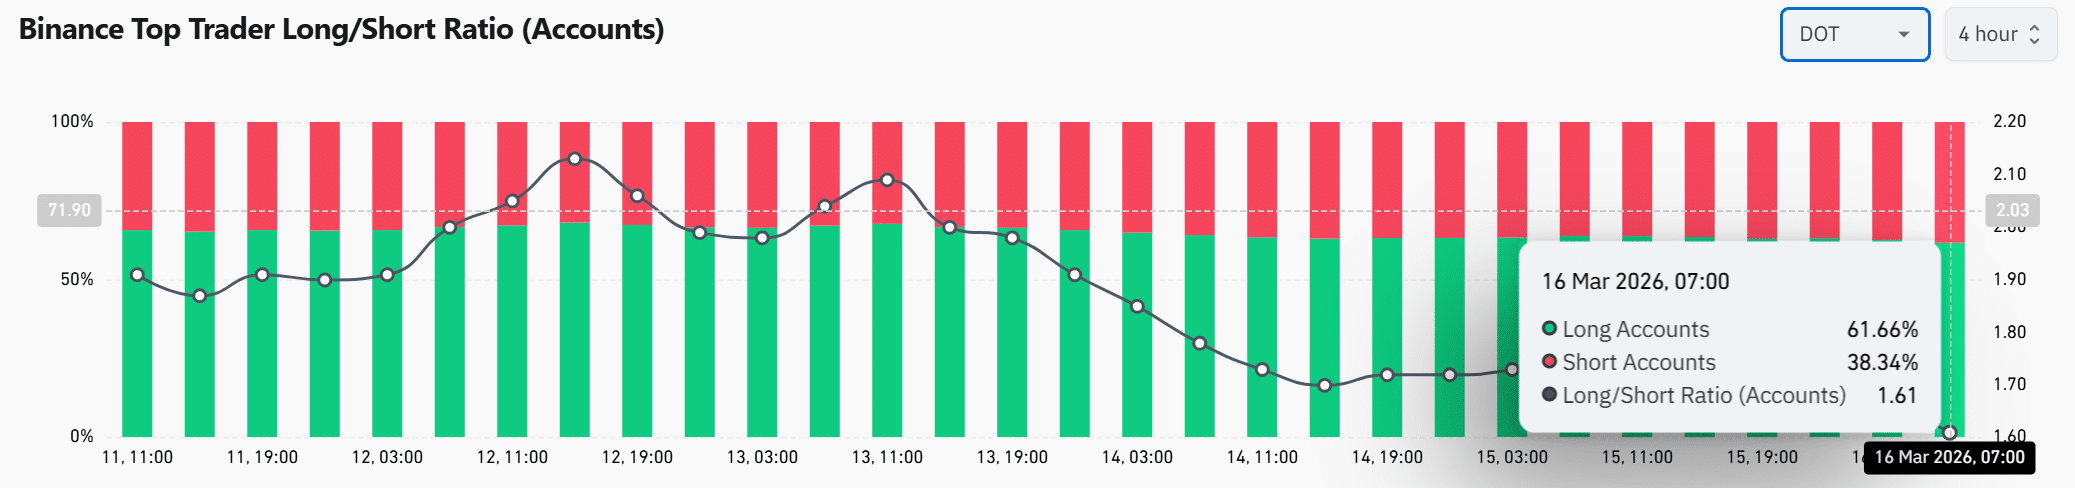
Data from CoinGlass on Binance Top Trader Long/Short Ratio showed that 61.66% of accounts held long positions at press time, while 38.34% maintain short exposure, resulting in a long/short ratio of 1.61.

This distribution indicates that experienced traders have largely positioned themselves for further upside.

Earlier sessions showed fluctuating positioning among top traders. However, recent readings show that long exposure has remained dominant while price attempted recovery.

This alignment between derivatives positioning and strengthening spot demand often signals growing conviction among market participants as they anticipate continued upside pressure.
Source: CoinGlass

Polkadot has strengthened significantly as the price surged above its descending channel while buyers expanded trading activity and aggressive order flow.

Technical indicators and derivatives positioning now support improving sentiment. However, the $1.686 resistance remains the next critical barrier.

A decisive break above that level could drive DOT toward the $2.000 zone as buyer conviction continues strengthening across the market.


Final Summary

  • Polkadot [DOT] jumped over 11% in 24 hours, with trading volume rising nearly 78%.
  • DOT broke above a prolonged descending channel, indicating weakening bearish control after months of price compression.


Criptomoedas em alta

Perguntas relacionadas

QWhat was the percentage increase in Polkadot's price and trading volume over 24 hours?

APolkadot's price surged over 11% and its trading volume jumped nearly 78% in 24 hours.

QWhat key resistance level is DOT approaching after the breakout?

ADOT is approaching the key resistance level at $1.686 after the breakout.

QWhat does the RSI value of 57.51 indicate about the market sentiment for DOT?

AThe RSI value of 57.51, which is above the 50 neutral threshold, indicates strengthening buyer activity and a shift into bullish territory.

QWhat does the Spot Taker CVD metric reveal about current market behavior?

AThe Spot Taker CVD metric has shifted into buy-dominant territory, indicating that traders are aggressively executing buy orders at market prices, reflecting stronger directional conviction.

QWhat is the long/short ratio for top Binance traders regarding DOT, and what does it suggest?

AThe long/short ratio for top Binance traders is 1.61, with 61.66% holding long positions, indicating that experienced traders are largely positioned for further upside price movement.

Leituras Relacionadas

Bitcoin Boom in Full Swing: Saylor's Latest Statement Fuels Buying Speculation

MicroStrategy's Executive Chairman Michael Saylor has fueled speculation about a new Bitcoin purchase by posting "Bitcoin Drive engaged" on August 2, accompanied by the company's customary purchase tracker. This aligns with his pattern of hinting at treasury changes ahead of weekly reports. The accompanying report showed MicroStrategy's Bitcoin holdings at 843,775 BTC, with an average cost of $75,653 per coin and an unrealized loss of -$10.58B. A similar signal preceded the company's July 27 announcement, strengthening expectations for a treasury update on Monday. However, MicroStrategy's real-time ledger reflects two recent Bitcoin sales totaling 3,588 BTC, reducing holdings from 847,363 BTC to the current 843,775 BTC. The company stated these sales funded preferred stock dividends and replenished its U.S. dollar reserve. Recent reports indicate the company made no Bitcoin purchases the week ending July 26 while increasing its dollar reserve to approximately $3.75B. The company faces financial headwinds after reporting an $8.33B operating loss for Q2 2026, including an $8.32B unrealized loss on its digital assets. Management may sell up to $1.25B more in Bitcoin to meet cash obligations. The expected Monday update will reveal if the "Bitcoin Drive" signal marks a return to accumulation as MicroStrategy balances its massive Bitcoin stash against growing cash commitments.

cryptonews.ruHá 1h

Bitcoin Boom in Full Swing: Saylor's Latest Statement Fuels Buying Speculation

cryptonews.ruHá 1h

Trading

Spot

Artigos em Destaque

Como comprar DOT

Bem-vindo à HTX.com!Tornámos a compra de Polkadot (DOT) simples e conveniente.Segue o nosso guia passo a passo para iniciar a tua jornada no mundo das criptos.Passo 1: cria a tua conta HTXUtiliza o teu e-mail ou número de telefone para te inscreveres numa conta gratuita na HTX.Desfruta de um processo de inscrição sem complicações e desbloqueia todas as funcionalidades.Obter a minha contaPasso 2: vai para Comprar Cripto e escolhe o teu método de pagamentoCartão de crédito/débito: usa o teu visa ou mastercard para comprar Polkadot (DOT) instantaneamente.Saldo: usa os fundos da tua conta HTX para transacionar sem problemas.Terceiros: adicionamos métodos de pagamento populares, como Google Pay e Apple Pay, para aumentar a conveniência.P2P: transaciona diretamente com outros utilizadores na HTX.Mercado de balcão (OTC): oferecemos serviços personalizados e taxas de câmbio competitivas para os traders.Passo 3: armazena teu Polkadot (DOT)Depois de comprar o teu Polkadot (DOT), armazena-o na tua conta HTX.Alternativamente, podes enviá-lo para outro lugar através de transferência blockchain ou usá-lo para transacionar outras criptomoedas.Passo 4: transaciona Polkadot (DOT)Transaciona facilmente Polkadot (DOT) no mercado à vista da HTX.Acede simplesmente à tua conta, seleciona o teu par de trading, executa as tuas transações e monitoriza em tempo real.Oferecemos uma experiência de fácil utilização tanto para principiantes como para traders experientes.

502 Visualizações TotaisPublicado em {updateTime}Atualizado em 2026.06.02

Como comprar DOT

Discussões

Bem-vindo à Comunidade HTX. Aqui, pode manter-se informado sobre os mais recentes desenvolvimentos da plataforma e obter acesso a análises profissionais de mercado. As opiniões dos utilizadores sobre o preço de DOT (DOT) são apresentadas abaixo.

活动图片












