Author: Frank, PANews
Original Title: When "Old Maps" No Longer Apply: A Review of 8 Failed Classic Crypto Indicators and Their Structural Causes
In early 2026, the crypto market is filled with frustration and confusion.
Bitcoin has retraced about 36% from its all-time high in October 2025, with the market seesawing between bullish and bearish sentiments. However, what makes many crypto investors even more uneasy is not the price itself, but the fact that the set of indicator systems they used to judge market positions in the past have almost all failed.
The S2F model's $500,000 prediction deviated from reality by more than three times, the four-year cycle failed to deliver an explosive rally post-halving, the Pi Cycle Top indicator remained silent throughout the entire cycle, the fixed thresholds of the MVRV Z-Score were no longer triggered, and the top regions of the Rainbow Chart became unreachable. Meanwhile, the contrarian signals of the Fear and Greed Index repeatedly misfired, and the highly anticipated "altcoin season" never arrived.
Why have these indicators collectively failed? Is it a temporary deviation, or has the market structure undergone fundamental changes? PANews has systematically reviewed and analyzed the 8 widely discussed failing indicators.
Four-Year Cycle Theory: The Supply Shock from Halving Is Becoming Negligible
The four-year cycle theory is one of the most widely accepted patterns in the crypto market. This theory posits that Bitcoin follows a fixed rhythm driven by halving events: accumulation before the halving,爆发式爆发 12-18 months after the halving, a peak crash of 75%-90%, bottoming out in a bear market, and then restarting. The three halvings in 2012, 2016, and 2020 validated this pattern relatively well.
However, after the halving in April 2024, the market did not experience the typical explosive rally seen in previous cycles. Bitcoin's annualized volatility dropped from historically over 100% to about 50%, showing more characteristics of a "slow bull" market. Bear market declines have also narrowed; the drop from peak to trough in 2022 was 77%, less than the 86% in 2014 and 84% in 2018.
Discussions about the failure of the four-year cycle theory are widespread on social media. The mainstream view is that the entry of institutional funds has fundamentally altered the market's microstructure.
First, the launch of Bitcoin spot ETFs in the US has continuously absorbed funds, creating sustained demand and breaking the simple narrative driven solely by halvings.
Second, on the supply side, the 2024 halving reduced the block reward to 3.125 BTC, decreasing the daily new supply from about 900 BTC to 450 BTC. The annualized reduction in supply is approximately 164,000 coins. This reduction lowered Bitcoin's annualized inflation rate (supply growth rate) from about 1.7% pre-halving to about 0.85%. The annual reduction in supply represents only 0.78% of the total 21 million coins issued. Relative to Bitcoin market capitalization in the trillions of dollars, the actual impact of this supply reduction has become minimal.
Pi Cycle Top: Declining Volatility Removes the Conditions for Moving Average Crossovers
The Pi Cycle Top, developed by Philip Swift, identifies market tops by observing when the 111-day moving average crosses above twice the 350-day moving average. This indicator accurately signaled the top three times: in 2013, 2017, and April 2021.
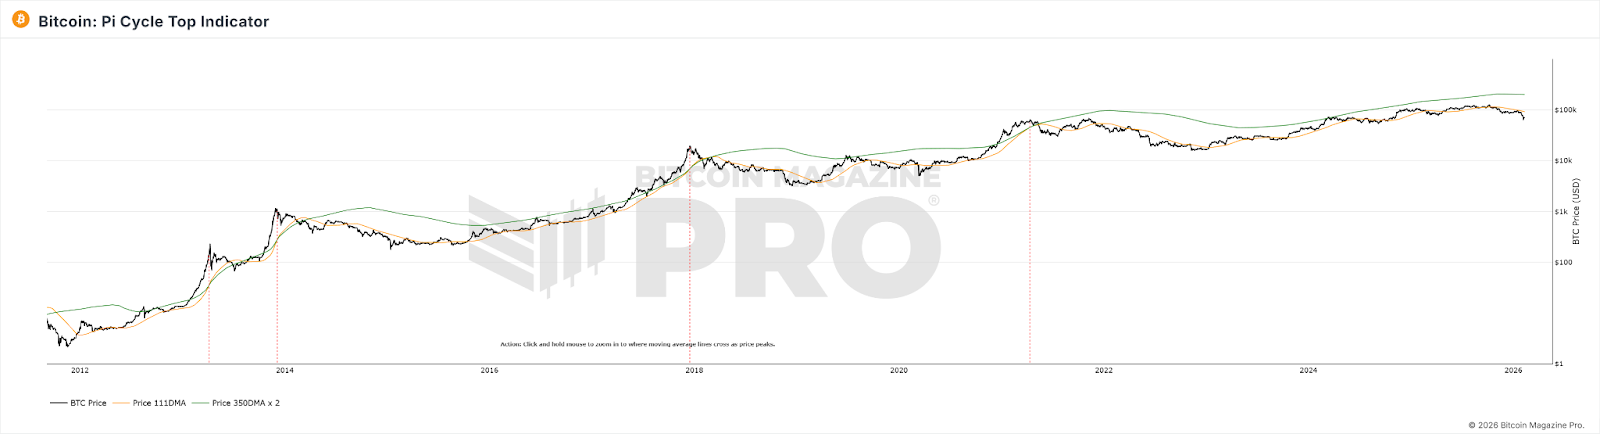
In the 2025 bull cycle, the two moving averages never produced a valid crossover, and the indicator remained "silent." Yet, the market's downward trend was already quite evident.
The failure of this indicator is likely because the Pi Cycle Top relies on剧烈 price volatility, causing the short-term average to deviate significantly from the long-term average before crossing. As Bitcoin's volatility has structurally declined, with ETF and institutional participation leading to smoother price movements and reduced parabolic rallies driven by retail investors, the prerequisite for moving average crossovers is no longer easily met. Furthermore, this indicator is essentially a curve fit to data from the early adoption phase (2013-2021). After a qualitative change in market participant structure, the parameters fitted from early data are likely no longer applicable.
MVRV Z-Score: Market Size and Holding Patterns Have Altered the Calculation Basis
The MVRV Z-Score is an on-chain valuation indicator that judges market valuation by comparing the degree of deviation between Bitcoin's market value (current market cap) and its realized value (the total value of each bitcoin calculated at the price of its last on-chain movement). Traditionally, a Z-Score above 7 is considered an overbought sell signal, while below 0 is considered an extremely undervalued buy signal.
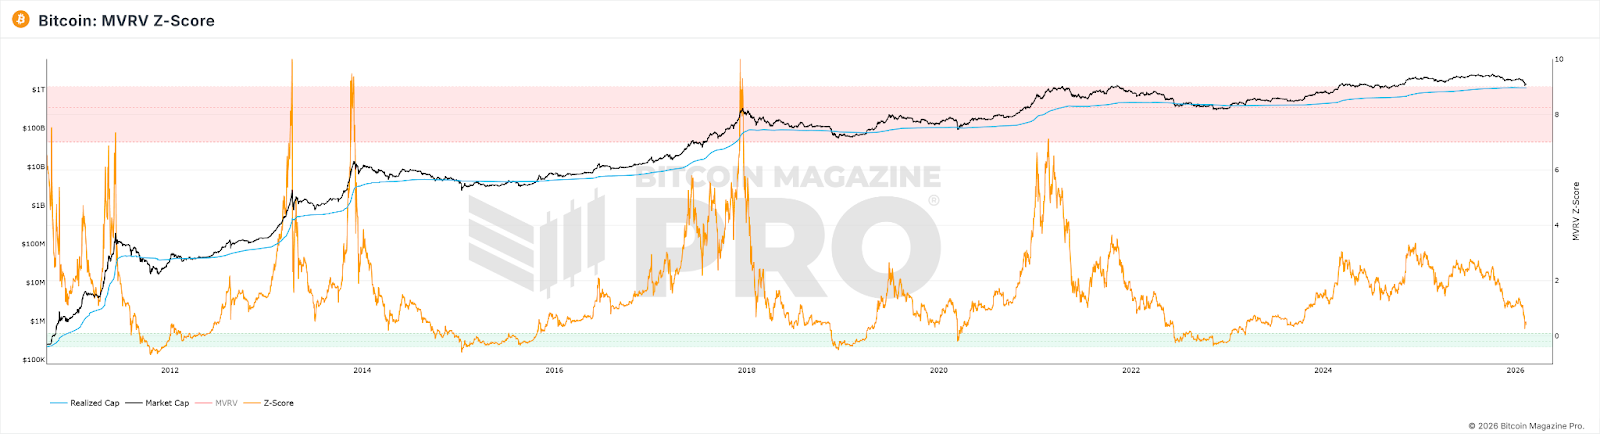
In terms of performance, even at the peak of the 2021 bull market, the Z-Score did not reach the heights of previous cycles, and the traditional fixed threshold (>7) was no longer triggered. By 2025, although Bitcoin's price peaked, the highest Z-Score value was only 2.69.
Investigating the reasons, the following aspects may exist:
1. Institutions bought at high prices and held long-term, systematically raising the Realized Value closer to the market value, compressing the fluctuation space of MVRV.
2. Frequent movements by short-term active traders continuously "refresh" the RV of active supply to near the current price, further narrowing the MV-RV gap.
3. After the market capitalization expanded, the amount of funds required to generate the same extreme Z-Score values as in the early days grew exponentially.
The combined result of these three factors is: the ceiling of the Z-Score has been structurally lowered, and the originally set fixed threshold of "7=overheated" is impossible to reach again.
Rainbow Chart: The Logarithmic Growth Assumption Is Being Broken
The Bitcoin Rainbow Chart uses logarithmic growth curves to fit long-term price trends, dividing price ranges into colored bands from "Extremely Undervalued" to "Maximum Bubble," allowing investors to judge buying and selling timing. In 2017 and 2021, prices touching the high-color bands indeed corresponded to cycle tops.
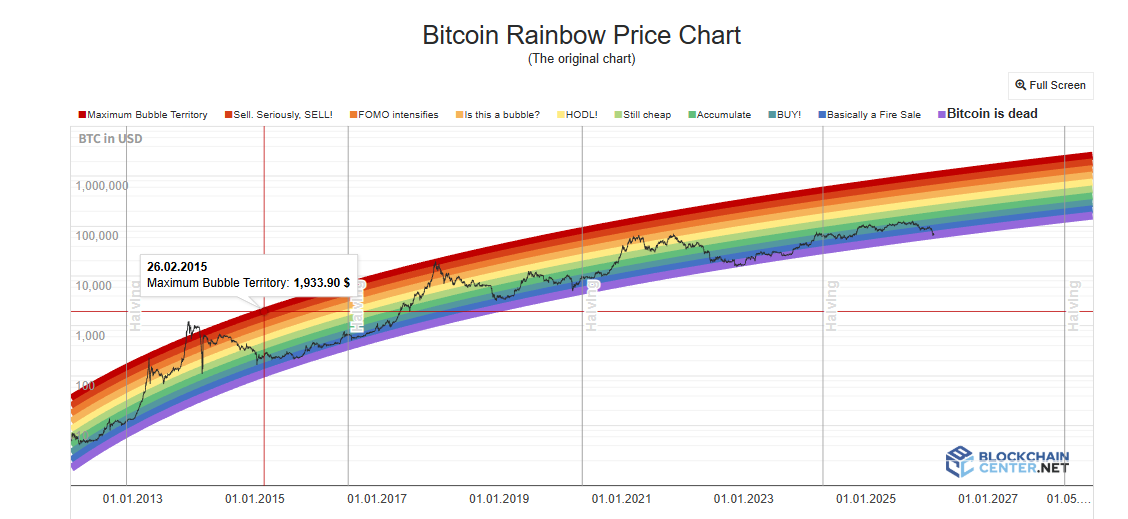
However, throughout the 2024-2025 bull cycle, Bitcoin's price only stayed in the "HODL!" neutral zone, never approaching the deep red zone representing extreme bubbles. The chart's top function hardly worked.
For the Rainbow Chart indicator, in this model, price is only a function of time. It does not consider halvings, ETFs, institutional funds, macro policies, or any other variables. Additionally, institutionalization has led to decreased volatility, causing the deviation of price around the trend line to systematically shrink, making fixed-width color bands no longer reachable. Furthermore, Bitcoin's growth is transitioning from the "steep segment of the adoption S-curve" to the "slow growth segment of a mature asset." The extrapolated growth rate of the logarithmic function is systematically higher than the actual growth rate, causing the price to land long-term in a position slightly below the center line.
Altcoin Season Index & BTC Dominance: The Premise of "Fund Rotation" Has Changed
The Altcoin Season Index measures the percentage of the top 100 altcoins that have outperformed BTC over the past 90 days, with a value exceeding 75 considered an "altcoin season." BTC Dominance (the proportion of BTC's market cap to the total market cap) is seen as a signal of funds flowing from BTC to altcoins when it falls below 50% or even 40%. In 2017, BTC Dominance fell from 85% to 33%, and in 2021, it dropped from 70% to the 40% range, both corresponding to large-scale altcoin rallies.
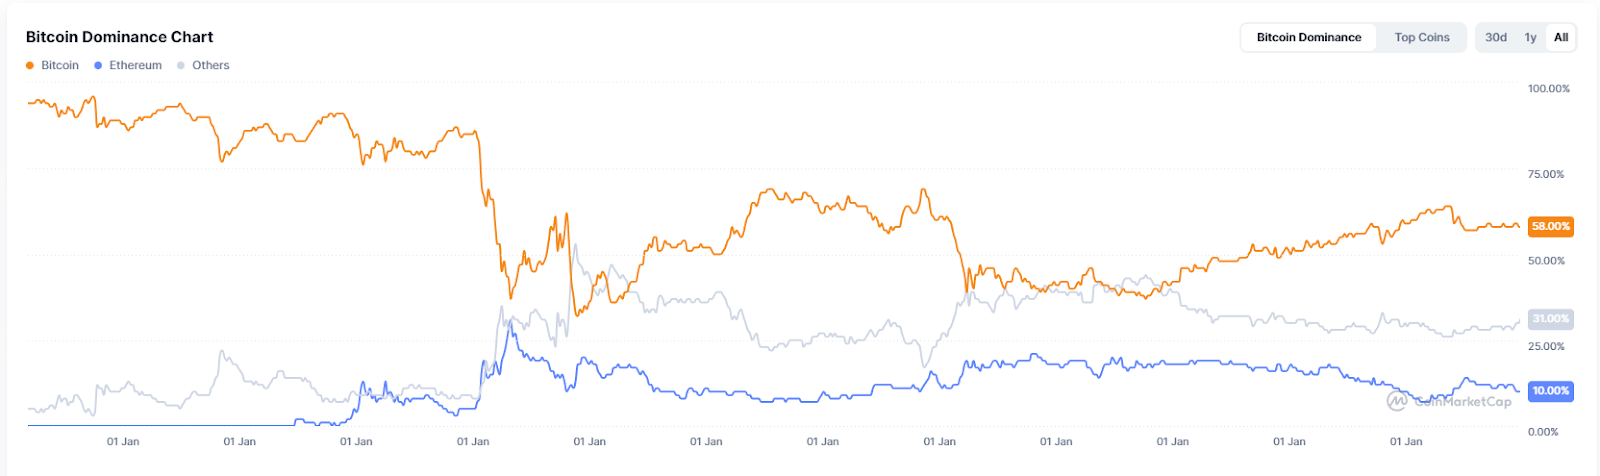
However, throughout 2025, the Altcoin Season Index was consistently below 30, remaining in "Bitcoin season." BTC Dominance reached a high of 64.34% and never fell below 50%. By early 2026, the so-called "Altseason" was more manifested as局部轮动 driven by precise narratives, with only specific sectors like AI and RWA benefiting, rather than the universal rally seen in the previous two cycles.
The deep-seated reasons for the failure of these two indicators also lie in the current market structure. With institutions and ETF funds becoming dominant, these funds clearly have a higher risk preference for Bitcoin than for altcoins. Additionally,大量资金被AI和贵金属的市场狂热大量虹吸, meaning less inflow into the crypto market overall. The incremental funds attracted by Bitcoin ETFs flow directly into BTC, and these funds are structurally unlikely to "rotate" into altcoins. ETF holders are buying a financial product, not an entry ticket to the crypto ecosystem. Moreover, the narrative exhaustion in the altcoin ecosystem and weakened liquidity support for new projects are also important reasons why the altcoin season has been delayed.
Fear and Greed Index: Retail Sentiment Is No Longer the Decisive Force for Price
The Crypto Fear and Greed Index synthesizes factors like volatility, market momentum, social media sentiment, and Google Trends to produce a score from 0-100. The classic usage is contrarian: buy when there is extreme fear, sell when there is extreme greed.
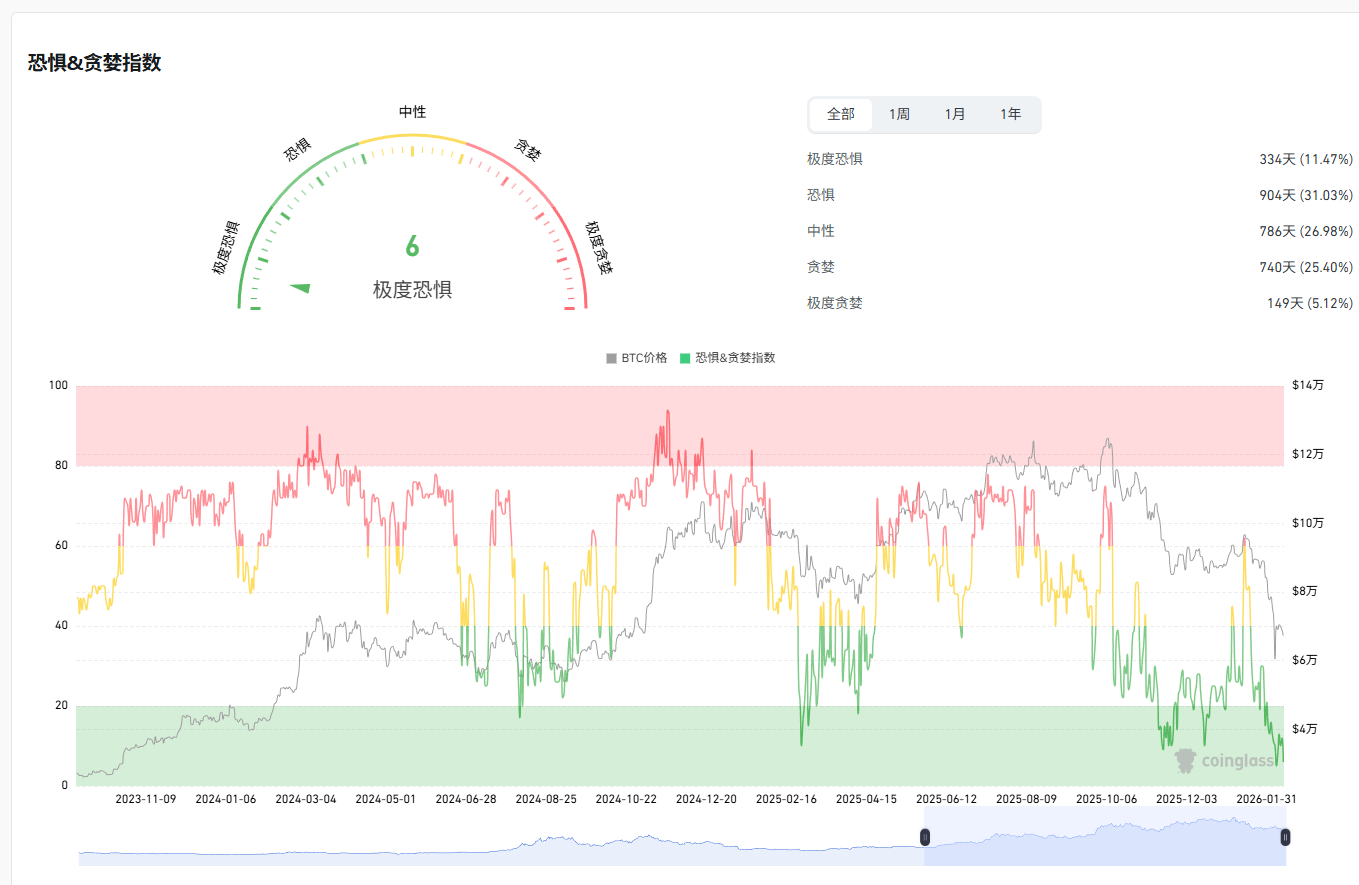
In April 2025, the index fell below 10, lower than during the FTX collapse, but BTC did not experience the expected significant rebound thereafter. The 30-day average for the year was only 32, with 27 days in the fear or extreme fear zone. As a top signal, the indicator was equally unreliable; at the market peak in October 2025, the index was only around 70.
The core reason for the failure of the Crypto Fear and Greed Index is that the transmission mechanism between sentiment and price has been interrupted by institutional funds. When retail investors are fearful, institutions might be buying the dip; when retail investors are greedy, institutions might be hedging with derivatives. This means retail sentiment is no longer the dominant force driving price changes.
NVT Ratio: On-Chain Transaction Volume No Longer Represents Real Economic Activity
The NVT Ratio, known as the "crypto version of the P/E ratio," divides the network's market capitalization by the daily on-chain transaction volume. A high NVT might indicate overvaluation, while a low NVT might indicate undervaluation.
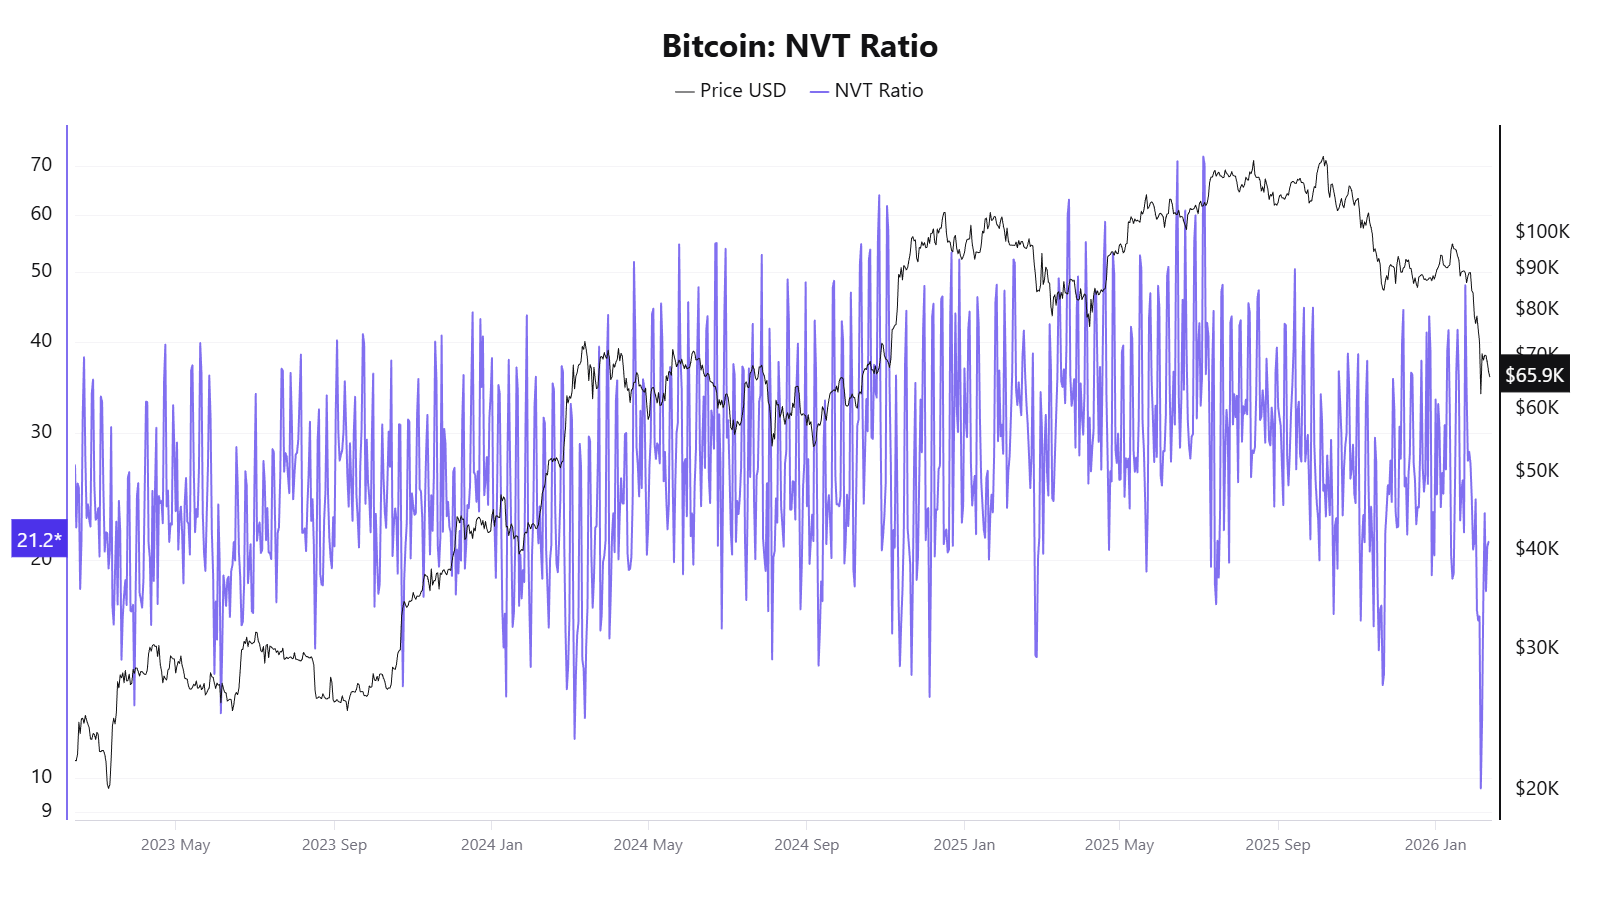
In 2025, this indicator showed contradictory signals. In April, before prices had risen significantly, the NVT Golden Cross was as high as 58, but by October, when prices reached around $120,000, it indicated the price was undervalued.
The fundamental reason for NVT's failure lies in its denominator, on-chain transaction volume, which can no longer represent the real economic activity of the Bitcoin network.
S2F Model: The Cost of Ignoring Demand While Only Looking at Supply
The Stock-to-Flow (S2F) model was proposed by anonymous analyst PlanB in 2019. Borrowing valuation logic from precious metals, it uses the ratio of Bitcoin's stock (existing supply) to its flow (annual new supply) to measure scarcity and fits a price prediction curve through logarithmic regression. The core assumption is: after each halving, the S2F ratio doubles, and the price should rise exponentially.
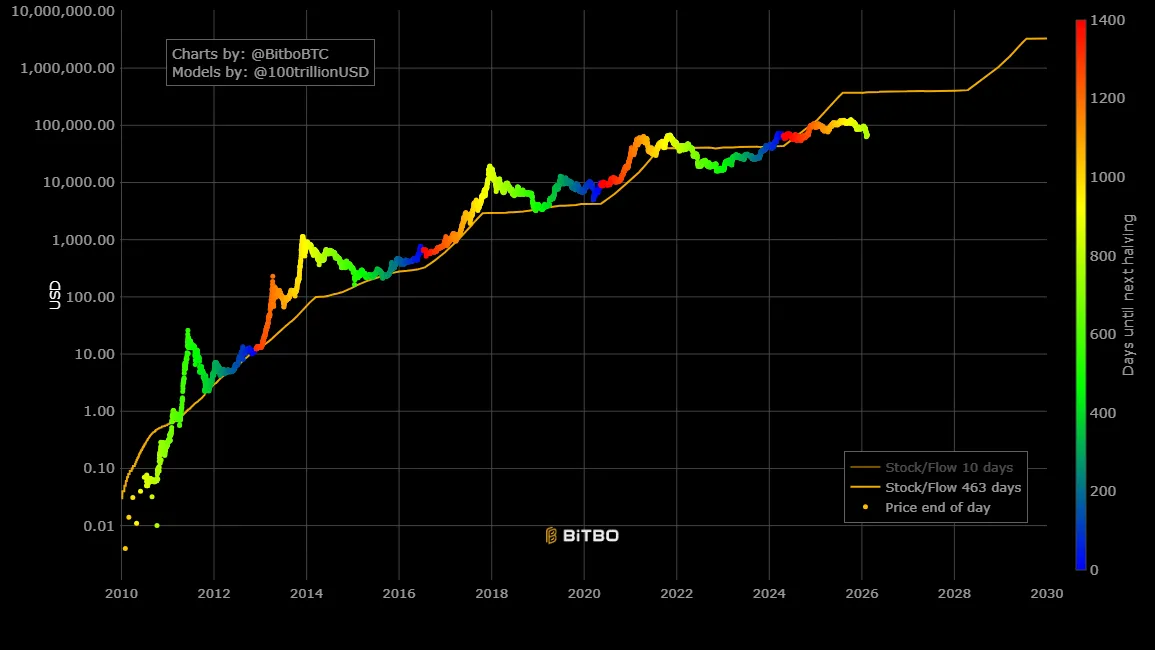
In terms of failure performance, in December 2021, the model predicted BTC should reach about $100,000, but the actual price was around $47,000, a deviation of over 50%. In 2025, the model target was $500,000, but the actual price was around $120,000, widening the gap to more than 3 times.
The fundamental reason for S2F's failure is that it is a purely supply-side model, completely ignoring demand-side variables. Furthermore, as Bitcoin's market capitalization reaches the trillions, exponential growth becomes physically harder to sustain, and the law of diminishing marginal returns is an unavoidable reality.
What's Failing Isn't a Single Indicator, But the Market Assumptions These Indicators Rely On Collectively
Looking at the failure of these indicators together, it becomes clear that their失灵 are not isolated events but point to the same set of structural changes:
Institutionalization has changed the market microstructure: Bitcoin ETFs, corporate treasury allocations, CME derivatives, and pension fund entries have altered the fund structure and price discovery mechanism. Institutions tend to buy the dip and hold long-term, smoothing out the剧烈波动 previously driven by retail sentiment. This makes it difficult for all indicators relying on extreme volatility or sentiment signals to operate in their original way. Additionally, the虹吸 of funds by AI and precious metals has reduced liquidity in the crypto market.
Structural decline in volatility is the direct technical reason for the failure of multiple indicators: Pi Cycle Top and Rainbow Chart require extreme price increases to trigger signals; MVRV requires a huge deviation between market cap and cost basis; funding rates require extreme long-short imbalances. When volatility drops from 100% to 50%, these conditions become harder to meet.
Bitcoin's "asset type" is migrating: From a digital commodity to a macro financial asset, Bitcoin's price drivers are shifting from on-chain variables (halvings, on-chain activity) to macro factors like Fed policy, global liquidity, and geopolitics. Those indicators focused on analyzing on-chain data are facing a market increasingly dominated by off-chain factors.
The representativeness of on-chain data itself is declining: Layer 2 transactions, internal exchange settlements, and ETF custody models are eroding the data foundation of on-chain indicators, making it increasingly difficult for indicators like NVT and MVRV, which rely on on-chain transaction data, to capture the full picture.
Furthermore, most classic indicators are essentially curve fits based on 3-4 halving cycles, with an extremely small sample size. They are prone to failure after a qualitative change in the market environment.
For ordinary investors, the collective failure of these indicators might convey a simpler signal: understanding the assumptions and applicable boundaries of each indicator might be more important than pursuing a universal prediction tool. Over-reliance on any single indicator can lead to misjudgment. In a phase where the underlying rules of the market are being rewritten, maintaining cognitive flexibility might be more practical than searching for the next "universal indicator."
Twitter:https://twitter.com/BitpushNewsCN
Bitpush TG Discussion Group:https://t.me/BitPushCommunity
Bitpush TG Subscription: https://t.me/bitpush