Measuring Market Asymmetry: The Glassnode Skew Index

insights.glassnodePublicado em 2025-12-11Última atualização em 2025-12-11

Resumo

The Glassnode Skew Index is a new metric designed to measure market asymmetry by analyzing the entire volatility smile in options markets, rather than relying on the traditional 25-delta skew which only samples two points. It aggregates information from out-of-the-money puts and calls to produce a more comprehensive signal of where risk is priced. The index is calculated as the difference between UpVol (volatility from OTM calls, reflecting upside potential and bullish sentiment) and DownVol (volatility from OTM puts, indicating downside protection and fear). A positive value suggests optimism and call-buying demand, while a negative value signals hedging and risk aversion. The Skew Index helps identify market sentiment regimes, confirms or diverges from spot price movements, and interprets different tenors (e.g., 1-week, 3-month) to distinguish between short-term stress and longer-term outlooks. It is available for multiple assets (BTC, ETH, SOL, XRP, PAXG) and tenors, providing a cross-asset view of options market sentiment.

When assessing options markets, one of the most powerful signals is skew: how the market prices risk on the upside versus the downside. The standard approach for traders is to look at the 25-delta skew: a simple comparison between the implied volatility of a 25-delta call and a 25-delta put. This method is effective, simple and familiar, but it samples only two points on the volatility curve. As a result, it often misses structure embedded in the rest of the surface.

The Glassnode Skew Index addresses this by aggregating information across the full smile, producing a more robust signal of where risk is being priced. We explain the purpose of the new metric, how it is constructed, and how it can fit into the broader toolkit of options analysis.

To access the new metrics visit Glassnode Studio. Available to Professional plan users.

View metric

Introducing the Glassnode Skew Index

Instead of focusing on two isolated strikes, the Glassnode Skew Index condenses the entire shape of the volatility smile into a single, intuitive measure of market asymmetry.

We divide the curve into two regions: one representing downside risk, and one representing upside potential. Each region is transformed into a standardized volatility measure as we calculate how much volatility the market is pricing into that segment.

  • DownVol represents the total implied volatility from out-of-the-money put options — protection against falling prices. When traders rush to buy puts, DownVol rises, signalling fear or a desire to hedge.
  • UpVol captures the opposite: the total volatility priced into out-of-the-money call options. This reflects how much traders are willing to pay for upside exposure or potential short-squeeze gains. When call demand increases, UpVol rises, often alongside strong bullish sentiment.

The difference between these two components gives us the skew index: Glassnode Skew Index = UpVol - DownVol

  • Positive values indicate a market that’s paying more for upside volatility – typically driven by optimism, momentum, or speculative call buying.
  • Negative values mean downside protection dominates, as investors prioritize safety and hedging over chasing upside.

In practical terms, The Glassnode Skew Index shows whether option traders are more concerned about a crash down, or more excited about a breakout up – and by how much.
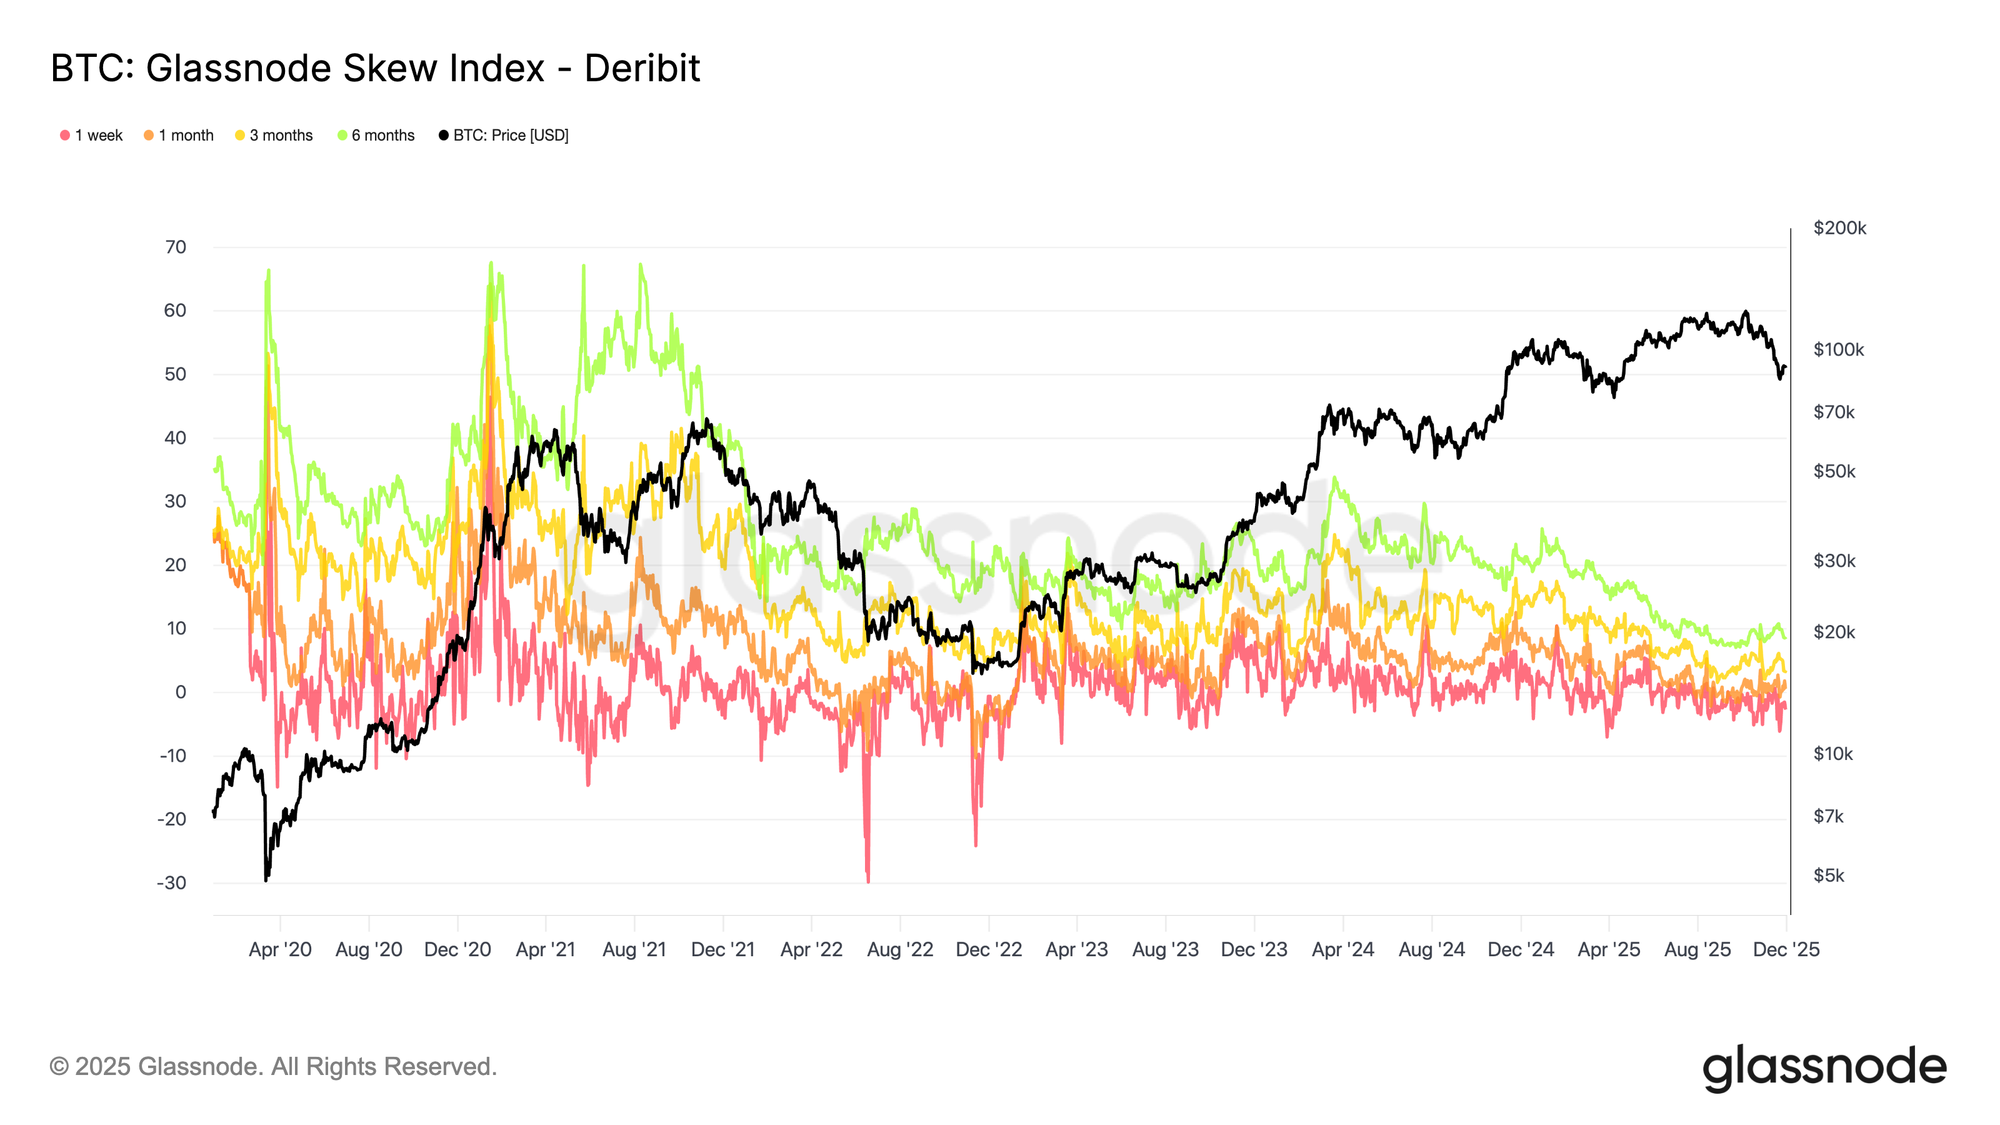
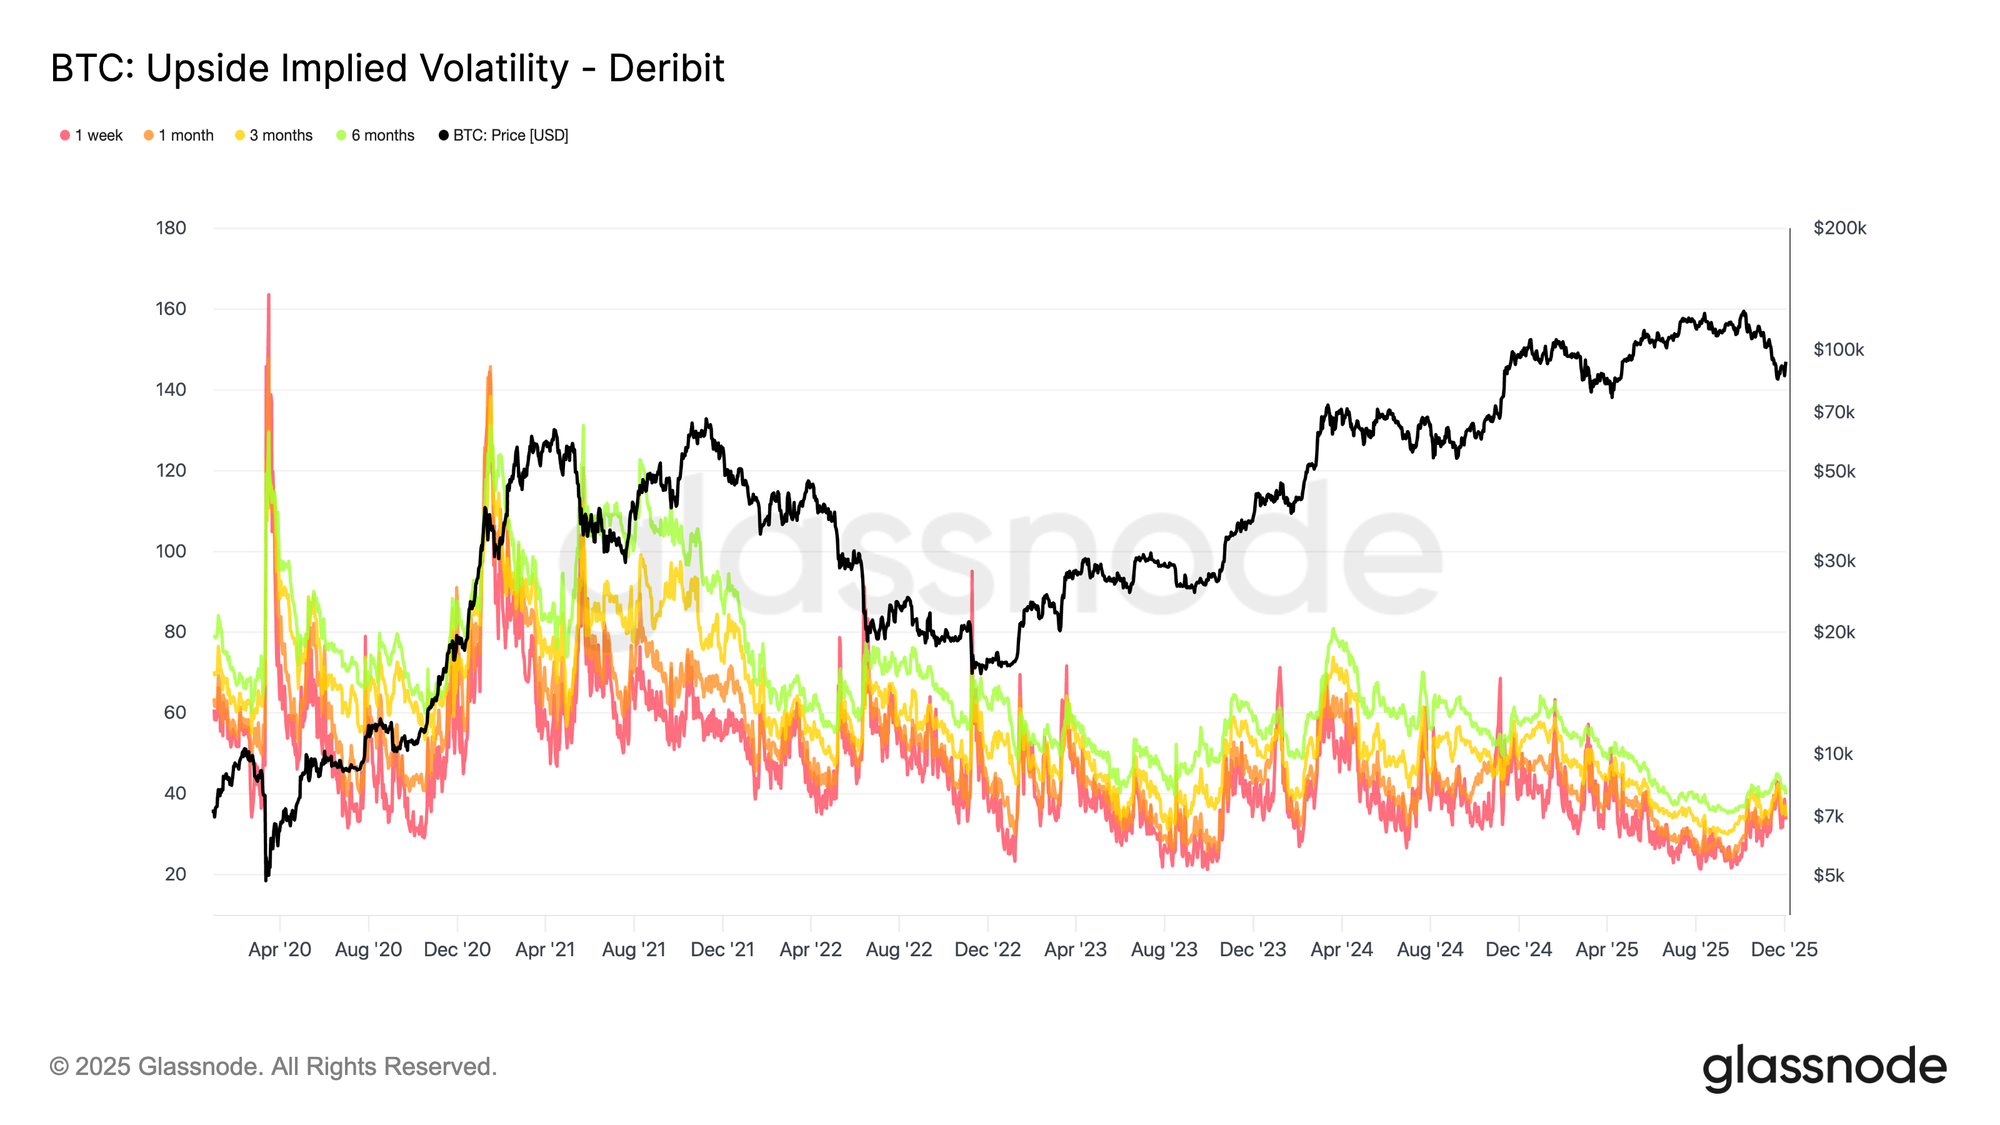
How to Use the Skew Index

The Skew Index can be applied in several ways to interpret options market positioning, identify sentiment regimes, and understand how traders are distributing risk across upside and downside scenarios.

Map the Current Sentiment Regime

The index can help contextualize prevailing market conditions:

  • Deeply negative values indicate a market that is paying a premium for downside protection, consistent with defensive positioning.
  • Strongly positive values indicate that investors are paying more for upside participation, often in the context of strong trends and speculative call activity.

Monitoring these extremes helps identify when fear or euphoria dominates the options market.

Use it as a Confirmation or Divergence Tool

The index can complement movements in spot price:

  • A rising Skew Index alongside a rising spot price suggests that the options market is reinforcing the move through increased demand for upside volatility.
  • A rally in spot with a Skew Index that stays sharply negative points to a distrusted move, where traders remain hedged and cautious.
  • A falling market with a heavily negative Skew Index confirms a classic risk-off environment with significant demand for protection.
  • A falling market with a positive Skew Index can indicate that traders are already looking through the weakness and positioning for a recovery.

This makes the index useful for evaluating whether options flows validate or contradict price action.

Interpreting Tenor Combinations

Different tenors can convey different layers of sentiment:

  • A negative 1-week skew with neutral or positive 3- and 6-month values often indicates temporary stress overlaying a constructive medium- and long-term outlook.
  • A very positive 1-week skew with subdued longer tenors suggests that traders are enthusiastic about the near-term, but reluctant to extend risk far into the future.
  • When skew is consistently elevated or depressed across all tenors, it points to a stable, regime-like sentiment environment rather than a short-lived spike.

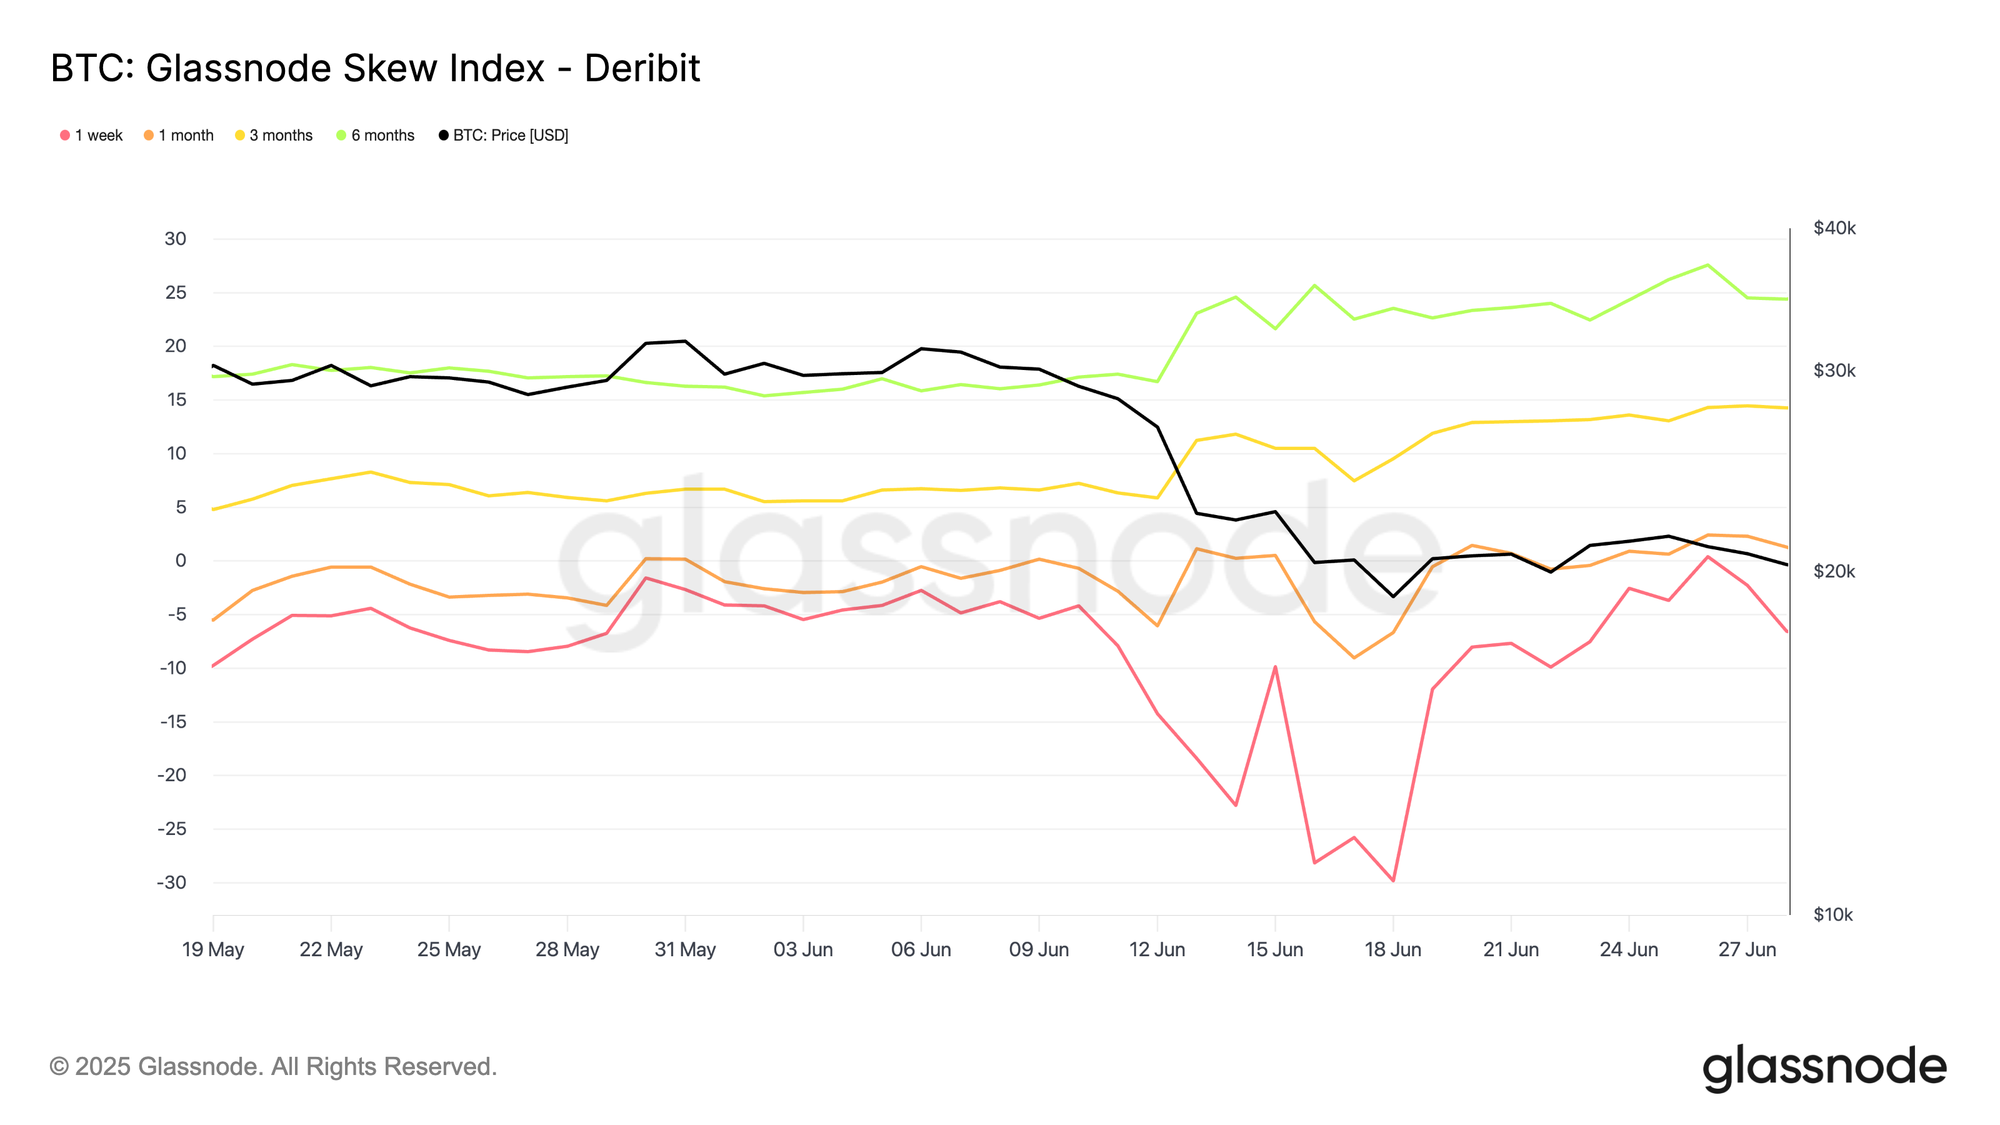
For example, in June 2022, we saw a clear tenor divergence: the 1-week Skew Index (red) plunged into deeply negative territory, signalling aggressive demand for short-dated puts over calls. Meanwhile, the 3-month (yellow) and 6-month (green) skews moved higher, indicating that investors were still willing to pay relatively more for upside exposure further out the curve.

In other words, the fear was mainly short-term, and longer-dated options continued to lean towards upside scenarios, implying that many participants expect better prices further out on the horizon.
How it works under the hood

We calculate the Glassnode Skew Index by aggregating option prices across many strikes on both sides of the distribution. These prices are transformed into standardized measures of upside and downside implied volatility, aligned to fixed maturities such as 1 week, 1 month, 3 months, and 6 months.

We then combine data across major venues so traders can compare BTC, ETH, SOL, XRP, or PAXG on consistent terms. This standardization removes the distortions that arise from strike irregularities, liquidity gaps, or exchange-specific conventions.

The result is a cross-asset, cross-tenor gauge of options market sentiment that captures the full structure of the volatility smile rather than relying on a single-point skew measure.

Available for:

  • Resolutions: 10 minutes, hourly, daily
  • Tenors: 1 week, 1 month, 3 months, 6 months
  • Assets: BTC, ETH, SOL, XRP, PAXG
  • Exchanges: Deribit, OKX

  • Follow us on X for timely market updates and analysis
  • Join our Telegram channel for regular market insights
  • For on-chain metrics, dashboards, and alerts, visit Glassnode Studio

Disclaimer: This report is for informational and educational purposes only. The analysis represents a limited case study with significant constraints and should not be interpreted as investment advice or definitive trading signals. Past performance patterns do not guarantee future results. Always conduct thorough due diligence and consider multiple factors before making investment decisions.


Criptomoedas em alta

Leituras Relacionadas

Gate Research Institute: The 'Wall Street-ization' Wave of Crypto Financial Products – Competition or Integration?

The article titled "Gate Research Institute: Are Crypto Financial Products Sparking a 'Wall Street' Wave—Competition or Convergence?" explores the evolving relationship between the crypto ecosystem and traditional finance (TradFi). The piece begins by reflecting on Bitcoin's original 2009 vision of decentralization, disintermediation, and moving away from banks. It then contrasts this with the 2024 landscape, where key crypto assets like Bitcoin are increasingly held through Wall Street products like ETFs issued by giants like BlackRock. The article questions whether this signifies that TradFi is systematically taking over the rights to issue, price, custody, and distribute crypto financial assets. The core argument is that this is not a zero-sum takeover but rather a bidirectional convergence where each side addresses the other's weaknesses. Crypto offers 24/7 global markets, programmable settlement, and open access but lacks compliant channels, institutional-grade custody, deep fiat liquidity, and mainstream distribution. TradFi possesses these but is constrained by legacy systems, limited operating hours, and slow settlement. Two primary convergence paths are highlighted: * **Path A (CEX to TradFi):** Exemplified by Gate, which has progressed from offering tokenized stocks and CFDs to providing direct, real stock trading (US, Hong Kong, South Korea) within its platform, using USDT. * **Path B (TradFi to Crypto):** Exemplified by Robinhood, which has integrated crypto trading, acquired exchanges like Bitstamp, and is moving traditional assets like stocks onto the blockchain via tokenization and its own Layer 2. Both paths are ultimately competing to become the next-generation, unified financial account—a "super account" where users can seamlessly trade cryptocurrencies, stocks, ETFs, RWA (Real World Assets), and tokenized treasury products in one interface. The growth of RWA and tokenized treasuries (e.g., BlackRock's BUIDL) is presented as the asset-layer fusion, providing stable, yield-bearing assets on-chain and acting as a bridge between the two worlds. In conclusion, the "Wall Street-ization" of crypto is framed as a mutual transformation. Decentralized ideals persist in the protocol layer, while at the application layer, a more efficient, global, and accessible unified capital market is emerging from this convergence. The future competition lies not between crypto exchanges and stockbrokers, but between platforms vying to offer the most comprehensive asset coverage, liquidity, and user experience within a single account.

marsbitHá 3m

Gate Research Institute: The 'Wall Street-ization' Wave of Crypto Financial Products – Competition or Integration?

marsbitHá 3m

Claude's Major New Feature: Screen Recording + Voice, Distilling Your Skills into AI Tasks in One Click

Claude has introduced a major new feature called "Record a Skill," available for Pro, Max, and Team users. This function, found in the Claude desktop app's CoWork menu, allows users to create reusable AI skills simply by recording their screen and providing voice narration while performing a task. Claude then automatically analyzes the recording and generates a functional Skill. A hands-on test confirmed the feature works seamlessly. Users start recording via the Skills manager, perform their workflow while verbally explaining the steps and logic, and avoid including sensitive information. After recording, Claude processes the content and creates the Skill, which can be saved and later invoked with a slash command (/). This eliminates the need for manual adjustments or writing complex instruction files. The innovation goes beyond mere efficiency. Previously, creating a Skill required writing a detailed SKILL.md file in Markdown—a significant barrier for non-technical users. "Record a Skill" bypasses this by directly capturing both actions and the implicit reasoning shared in the narration. This lowers the barrier to knowledge transfer and automation, addressing a core challenge in corporate knowledge management: the difficulty of getting experts to write and maintain documentation. However, the feature also highlights a shift in the nature of work. A case study from March 2026 showed a freelancer whose five-year client relationship was effectively replaced by a hand-coded Claude Skill automating their content workflow. With the even lower barrier of screen recording, the ability to distill personal expertise into automatable skills accelerates this trend. The "moat" for work is moving from simply knowing how to do a task to mastering tasks that are difficult or impossible to automate.

marsbitHá 8m

Claude's Major New Feature: Screen Recording + Voice, Distilling Your Skills into AI Tasks in One Click

marsbitHá 8m

Feeding AI "Noise" Can Also Boost Scores, This Work Enables Positive Transfer with Noise

Feeding "Noise" to AI Can Improve Performance: A Method Enables Positive Transfer from Noise This work, Semi-Supervised Noise Adaptation (SSNA), introduces a Noise Adaptation Framework (NAF) that challenges traditional transfer learning. Instead of requiring a labeled source domain of real data (e.g., images, text), NAF uses randomly generated Gaussian noise as the source. For a target task with C classes, it constructs C noise clusters by sampling from Gaussian distributions. Although this synthetic noise contains no semantic meaning, NAF trains it to form a discriminative class structure in a shared representation space—clustering same-class noise and separating different classes. The key is aligning this learned structure from the noise domain to the real, sparsely labeled target domain. A small number of target labels are still essential to establish the correspondence between noise clusters and actual classes. The training objective combines: 1) supervised loss on the few labeled target samples, 2) classification loss for the noise to build its structure, and 3) a distribution alignment loss (using Negative Domain Similarity) to minimize the gap between the noise and target domains in the shared space. Experiments show significant gains in few-label settings. With just 4 labels per class, NAF with a ResNet-18 backbone improves accuracy over a standard supervised baseline (ERM) by +12.35% on CIFAR-10, +7.61% on CIFAR-100, +4.38% on DTD-47, and +2.74% on Caltech-101. It also benefits fine-grained datasets and scales to ImageNet-1K (with 100 labels/class) and text classification (AG News). NAF can be integrated into existing semi-supervised methods like FixMatch for further gains. Ablation studies confirm the transferred benefit comes from the discriminative structure of the noise, not randomness itself. Collapsing all noise into a single point causes negative transfer, while increasing separation between noise cluster centers improves performance. The amount of noise per class is less critical once a basic structure forms. In conclusion, this work demonstrates that for positive transfer, the semantic content of source data may not be necessary. What can be effectively transferred is the *organizational structure* of categories within a representation space. This offers a promising alternative for scenarios where real source data is unavailable due to privacy, copyright, or procurement constraints.

marsbitHá 9m

Feeding AI "Noise" Can Also Boost Scores, This Work Enables Positive Transfer with Noise

marsbitHá 9m

Trading

Spot

Artigos em Destaque

Como comprar ONE

Bem-vindo à HTX.com!Tornámos a compra de Harmony (ONE) simples e conveniente.Segue o nosso guia passo a passo para iniciar a tua jornada no mundo das criptos.Passo 1: cria a tua conta HTXUtiliza o teu e-mail ou número de telefone para te inscreveres numa conta gratuita na HTX.Desfruta de um processo de inscrição sem complicações e desbloqueia todas as funcionalidades.Obter a minha contaPasso 2: vai para Comprar Cripto e escolhe o teu método de pagamentoCartão de crédito/débito: usa o teu visa ou mastercard para comprar Harmony (ONE) instantaneamente.Saldo: usa os fundos da tua conta HTX para transacionar sem problemas.Terceiros: adicionamos métodos de pagamento populares, como Google Pay e Apple Pay, para aumentar a conveniência.P2P: transaciona diretamente com outros utilizadores na HTX.Mercado de balcão (OTC): oferecemos serviços personalizados e taxas de câmbio competitivas para os traders.Passo 3: armazena teu Harmony (ONE)Depois de comprar o teu Harmony (ONE), armazena-o na tua conta HTX.Alternativamente, podes enviá-lo para outro lugar através de transferência blockchain ou usá-lo para transacionar outras criptomoedas.Passo 4: transaciona Harmony (ONE)Transaciona facilmente Harmony (ONE) no mercado à vista da HTX.Acede simplesmente à tua conta, seleciona o teu par de trading, executa as tuas transações e monitoriza em tempo real.Oferecemos uma experiência de fácil utilização tanto para principiantes como para traders experientes.

348 Visualizações TotaisPublicado em {updateTime}Atualizado em 2026.06.02

Como comprar ONE

Discussões

Bem-vindo à Comunidade HTX. Aqui, pode manter-se informado sobre os mais recentes desenvolvimentos da plataforma e obter acesso a análises profissionais de mercado. As opiniões dos utilizadores sobre o preço de ONE (ONE) são apresentadas abaixo.

活动图片