Author: Coingecko
Compiled by: Felix, PANews
As of June 24, the current Bitcoin bear market has lasted 233 days, making it the fourth-longest bear market cycle among the 7 cycles since 2014. This article defines a "bear market cycle" as a period during which Bitcoin's closing price remains below its 200-day moving average (200 DMA) for 30 consecutive days or longer.
A moving average is a technical indicator that smooths out short-term price fluctuations to identify broader trends. The 200-day moving average (200 DMA) specifically tracks the average closing price over the past 200 days and is a widely used benchmark for assessing long-term market direction.
Overview of Past Bear Market Cycles:
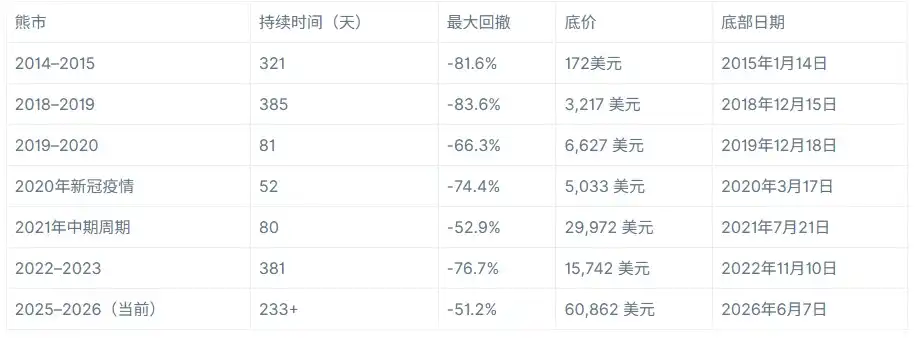
Daily closing price data sourced from CoinGecko, covering January 1, 2014, to June 24, 2026.
The two longest-lasting bear market cycles in Bitcoin's history were the 2018–2019 cycle (385 days) and the 2022–2023 cycle (381 days). Both followed all-time highs and were structural crashes driven by excessive leverage and loss of confidence. The 2018–2019 bear market came right after the peak of the ICO craze in late 2017, gradually subsiding as retail speculation waned and global regulatory pressure increased. The 2022–2023 bear market was triggered by the collapse of the Terra/LUNA ecosystem in May 2022, subsequently causing a chain of bankruptcies including Three Arrows Capital, Celsius, and ultimately FTX, which shattered institutional confidence and dragged Bitcoin below $16,000 in November 2022.
The 2014–2015 bear market (lasting 321 days) was caused by the failure of Mt. Gox, then the world's largest Bitcoin exchange, which completely destroyed trust in the nascent market.
The remaining four bear markets were shorter in duration and triggered by more isolated shock events. The 2019–2020 pullback (81 days) and the 2021 mid-cycle correction (80 days) were relatively brief; the former was a consolidation phase during a market recovery, while the latter resulted from a temporary crash in hash rate and sentiment due to China's mining ban. The 2020 "COVID-19 crash" (52 days) was the most intense but bottomed out the fastest—a macro liquidity shock that eased as global stimulus flooded the market.
The current 2025–2026 bear market (233 days as of the time of analysis) appears to stem from broader macro shifts: rising interest rate uncertainty, fading post-halving momentum, and the rise of AI as a speculative asset class. These factors have all pressured Bitcoin since it reached its all-time high of $124,773 in January 2025.
How Severe Were Past Bear Markets?
The current 2025–2026 bear market is actually the mildest on record (so far, hopefully), with a maximum drawdown of 51.2% from Bitcoin's all-time high of $124,773. Every previous bear market cycle had larger declines, with the three major bear markets experiencing drops between 76.7% and 83.6%.
The closest comparable event is the 2021 mid-cycle correction (a 52.9% drop), though that event lasted only 80 days and occurred within a broader bull trend rather than as a standalone bear market cycle.
Historically, the most destructive cycles were the 2018–2019 bear market (83.6% drop) and the 2014–2015 bear market (81.6% drop), both erasing the vast majority of Bitcoin's previous gains before bottoming and recovering. The 2022–2023 cycle (76.7% drop) was similarly severe, with Bitcoin falling from its all-time high of $67,617 to a low of $15,742 in November 2022.
Even the shorter, shock-driven crashes resulted in significant losses: the 2020 COVID-19 crash caused a 74.4% drawdown despite lasting only 52 days, highlighting how quickly crypto market sentiment and liquidity can deteriorate. The current cycle has so far avoided such severe damage, possibly reflecting more resilient market structure, higher institutional participation, or simply because the bear market isn't over yet.
Is Recovery in Sight?
As of June 24, Bitcoin's 200 DMA stands at $76,450, while the spot price is $62,651, representing a 22% gap. This means that reclaiming the 200 DMA would require a sustained rally of over one-fifth from current levels. Historically, the 200 DMA has acted as a strong resistance level during price recoveries, not just as support during declines.
Currently, Bitcoin is about 2.9% above the cycle low of $60,861 reached on June 7, 2026. In past bear markets, the time span from confirming a bottom to finally reclaiming the 200 DMA has ranged from 65 days (2022–2023 cycle) to 166 days (2014–2015 cycle). If June 7 indeed marks the bottom of this bear market (which needs more time to confirm), then even at the historically fastest recovery pace, reclaiming the 200 DMA would not occur until August 2026 at the earliest.
Related Read: Bitwise: Bullish on Bitcoin in H2, AI and Regulation to Usher in New Altcoin Season
![Assessing Sonic’s [S] 12% price drop and why more selling may be next](https://d1x7dwosqaosdj.cloudfront.net/images/2026-06/161e3d66eea4402796d2e6a66d93d453.jpg)