Keeta rallies 36% in a day – Should KTA holders take profits now?

ambcryptoPublicado em 2026-04-01Última atualização em 2026-04-01

Resumo

Keeta (KTA), an altcoin with a $109 million market cap, surged 36.7% in 24 hours, accompanied by a 400% increase in daily trading volume. This rally occurred amid broader market uncertainty, with Bitcoin facing rejection near $76k and retesting $66k as support. The 1-day chart showed KTA reclaiming the $0.20 resistance level, with the Chaikin Money Flow (CMF) indicating strong buying pressure and the RSI suggesting sustainable upward momentum. However, the 1-hour chart revealed a potential short-term pullback toward $0.176, supported by a bearish RSI divergence and a declining CMF. Traders are advised to consider taking profits, as the longer-term structure remains bearish, and further losses may follow.

The $109 million market cap altcoin Keeta [KTA] experienced a 36.7% rally in the past 24 hours, at press time. CoinMarketCap data showed that it had a 400% surge in daily trading volume as traders and investors raced to capture some gains the altcoin was posting.

These gains came at a time of wider market uncertainty and drawdown. Bitcoin [BTC] faced rejection from the $76k level in the past two weeks and retested the $66k level as support on Tuesday, the 31st of March.

Can KTA keep its rally going, or is this rally one for holders to sell?

Right time to take profits?

Source: KTA/USDT on TradingView

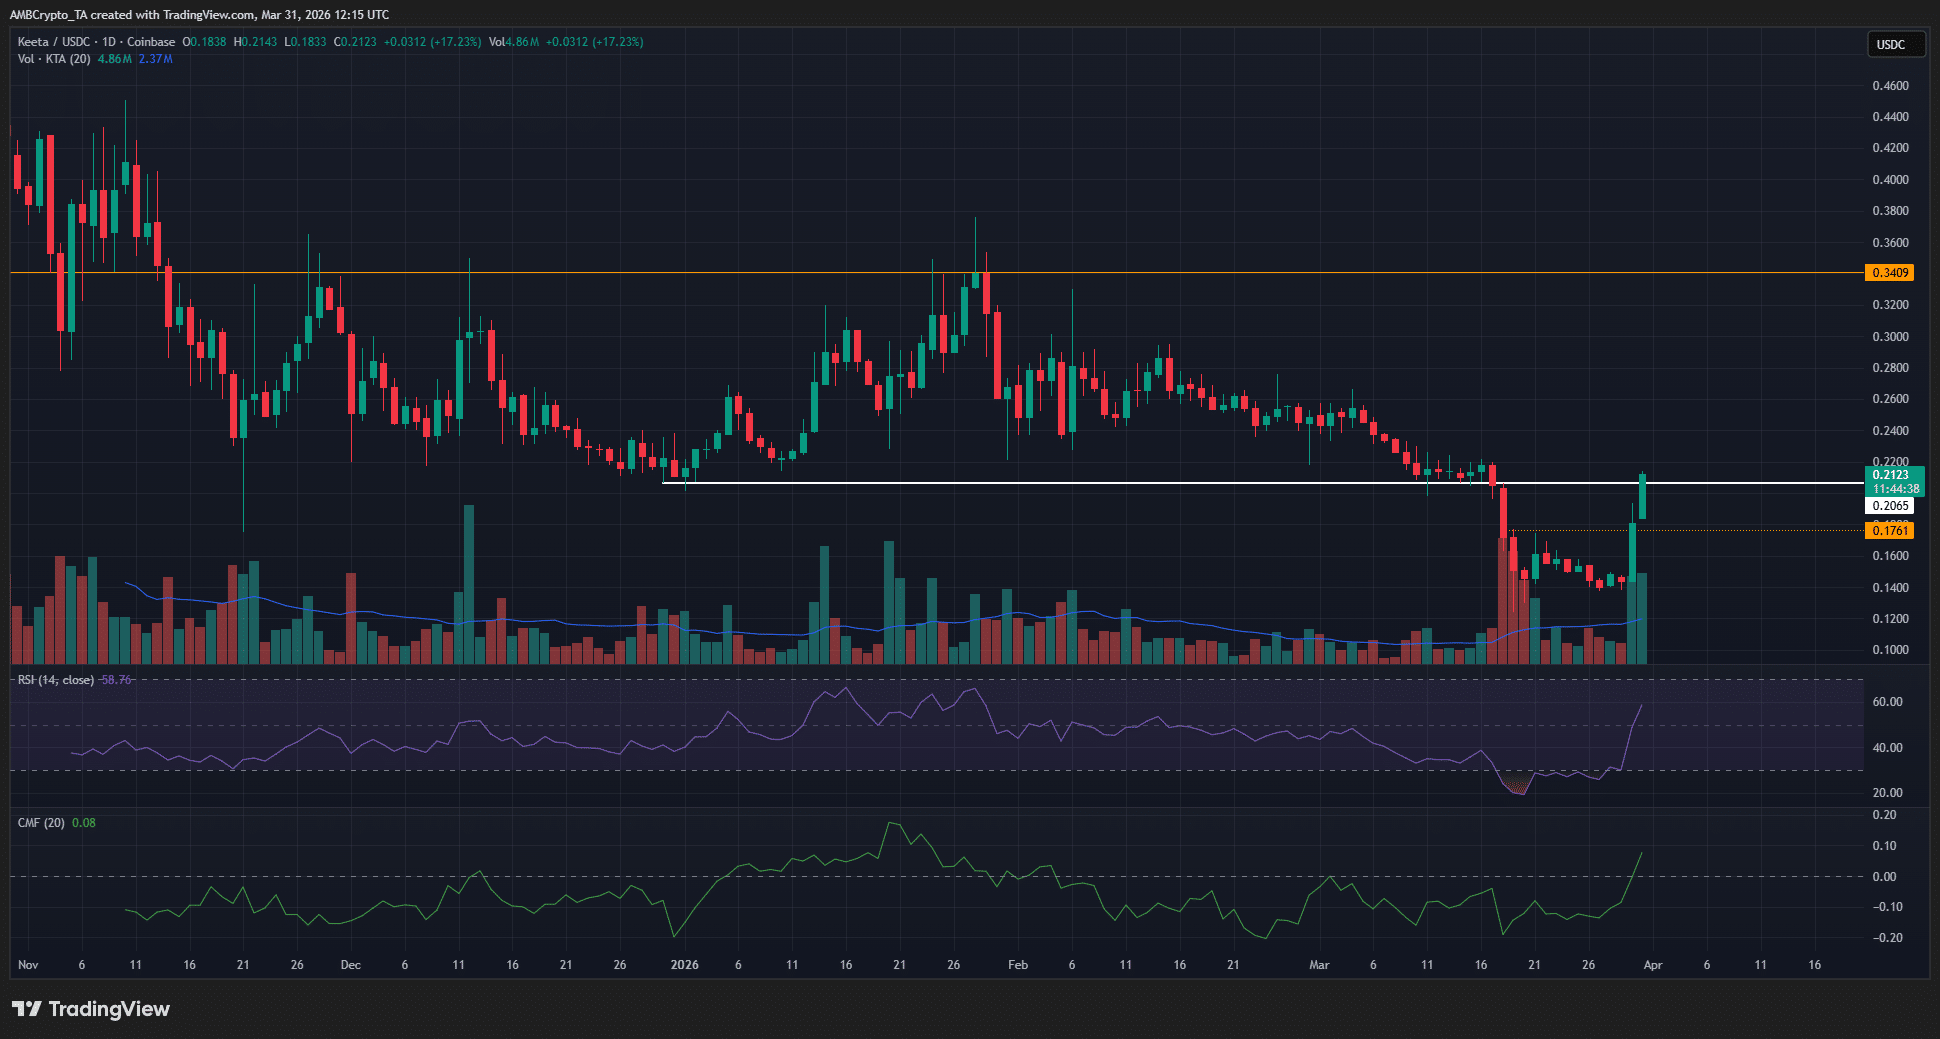
The 1-day chart of the altcoin showed the breakdown below the $0.2 support zone in mid-March. The trading volume on Wednesday, the 18th of March, was the highest single-day volume since Friday, the 12th of December 2025.

The high-volume breakdown below a support level that has held throughout 2026 was significant.

Yet, at the time of writing, KTA was poking its head back above the same resistance zone, which coincides with a psychological round number resistance.

The CMF climbed to +0.08 to indicate heavy buying pressure and sizeable capital inflows. It must be noted that the daily CMF has been negative since the market crash in the first week of February.

Meanwhile, the daily RSI has also recovered to push past neutral 50. This indicated sustainable upward momentum.

Traders’ call to action: Sell!

Source: KTA/USDT on TradingView

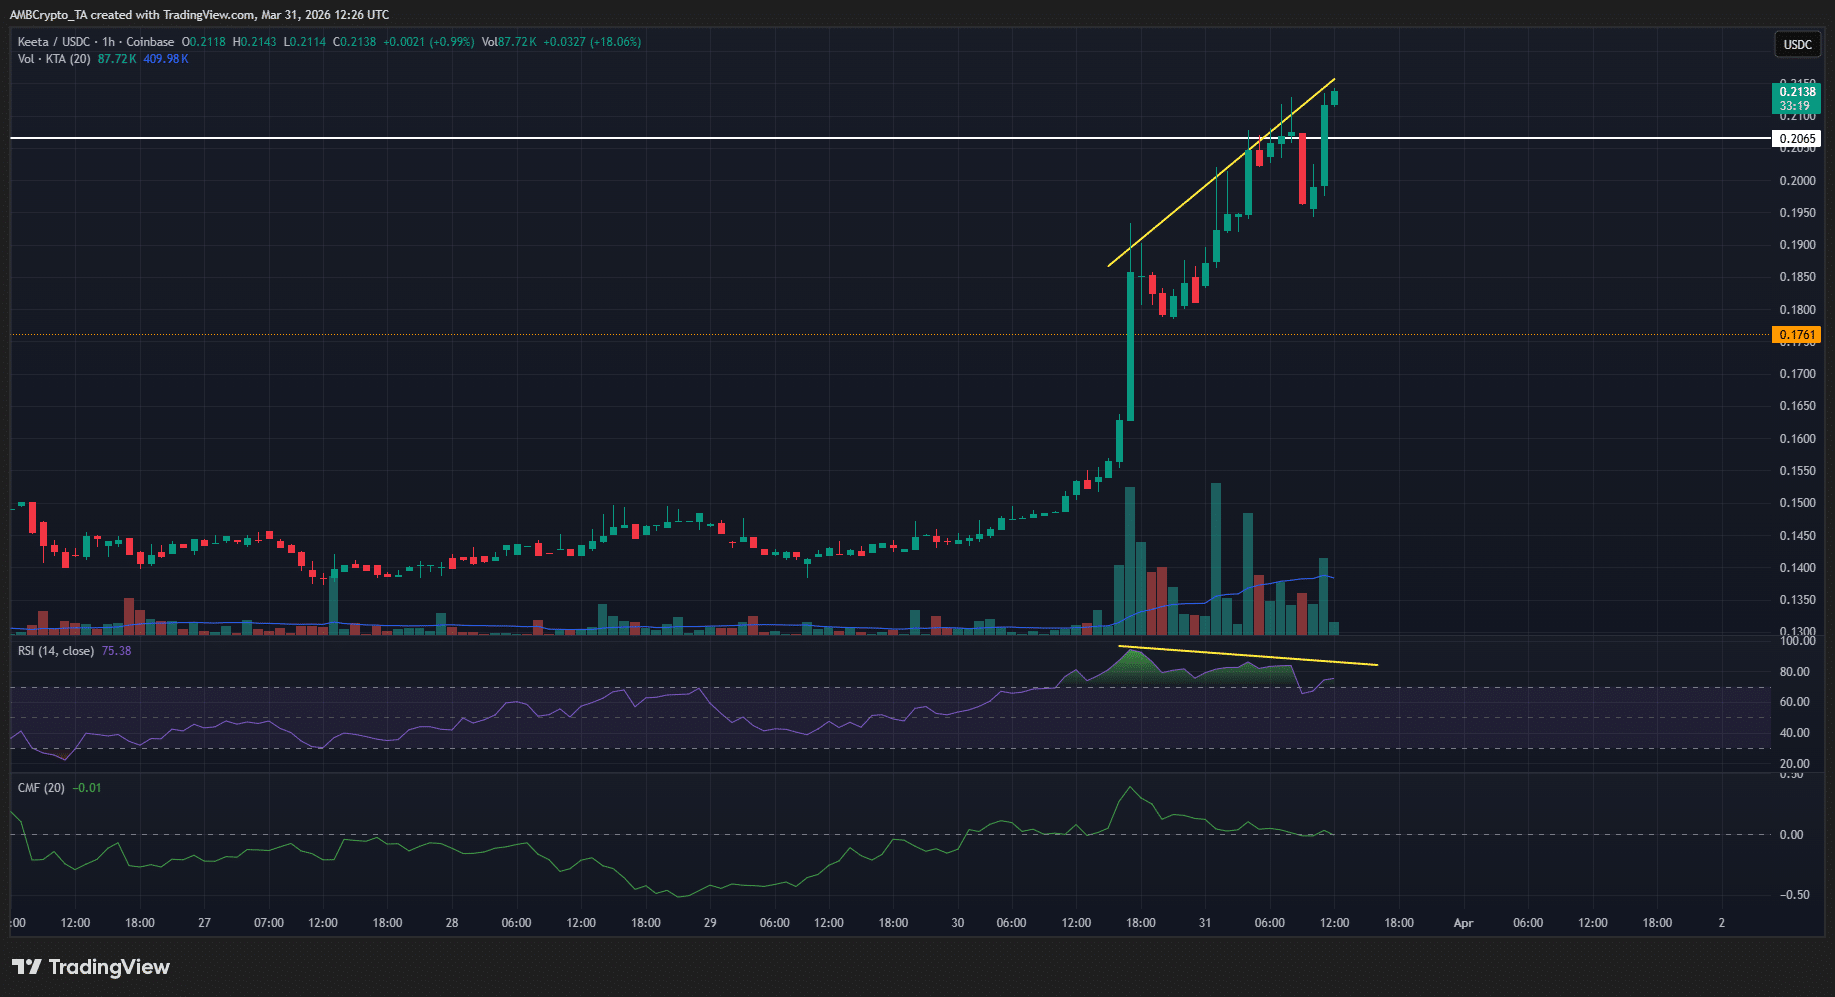
The 1-hour chart showed bullish volume and momentum indicators, but the run could be ending. While the 1-day chart stressed a bearish long-term structure, the 1-hour chart hinted at a pullback toward the $0.176 level, a support from earlier in March.

The CMF was back below +0.05 and, more importantly, the RSI was making a bearish divergence.

This was a clear sign that short-term holders should consider taking profits. As things stand, the longer-term bias means that they should be wary of buying a pullback and expect further losses instead.


Final Summary

  • Keeta saw a 36% rally in the past 24 hours and was back above a support level it lost to the bulls in mid-March.
  • The lower timeframe price chart showed that a pullback is likely, and there was a clear momentum divergence in progress.

Perguntas relacionadas

QWhat was the percentage increase in Keeta's value in the past 24 hours?

AKeeta experienced a 36.7% rally in the past 24 hours.

QAccording to the article, what is a clear sign that short-term holders should consider taking profits?

AA clear sign is the bearish divergence on the RSI (Relative Strength Index) on the 1-hour chart.

QWhat key support level did KTA break down below in mid-March?

AKTA broke down below the $0.2 support zone in mid-March.

QWhat did the Chaikin Money Flow (CMF) indicator climbing to +0.08 signify?

AThe CMF climbing to +0.08 indicated heavy buying pressure and sizeable capital inflows into KTA.

QDespite the recent rally, what is the longer-term bias for KTA according to the analysis?

AThe longer-term bias is bearish, and the analysis suggests traders should be wary of buying a pullback and expect further losses instead.

Leituras Relacionadas

Raising Interest Rates Is Not a Tech Killer, EPS Is: A Strategy for Discarding the Weak and Retaining the Strong After the AI Theme's Sharp Decline

**Summary: Rising Interest Rates Are Not the Killer of Tech; EPS Is: The "Keep the Strong, Ditch the Weak" Strategy After the AI Theme Plunge** The author argues that the sharp sell-off in tech and AI-related stocks, triggered by a strong US jobs report that heightened Fed rate hike fears, represents a "pullback to pick up passengers" rather than a "car crash." The true end of a tech bull market is not determined by an extra 25 basis point hike, but by industry overcapacity and the disproval of earnings per share (EPS) expectations. Historical analysis shows that during past rate hike cycles, the Nasdaq-100 often outperformed, provided EPS growth remained strong. The current phase is seen as a shift from a "broad narrative-driven rally" to a "focused verification stage" for AI. The investment strategy should be to "keep the strong, ditch the weak." * **Retain exposure** to high-conviction AI infrastructure leaders with clear order visibility, stable margins, strong cash flow, and upward EPS revisions (e.g., AI servers, advanced packaging, optical modules, key cloud suppliers). * **Reduce exposure** to high-beta, narrative-driven stocks with unclear profit paths (e.g., some quantum computing, space, or speculative chip stocks), especially on rebounds. Valuation concerns should focus on whether earnings can catch up to high multiples, not on high P/E alone. Crowded positioning signals a concentration into quality assets, not necessarily a market top. The upcoming Q2 earnings season will be a key validation point. The core principle is to hold stocks with proven EPS, while using macro events (CPI data, central bank meetings) to manage timing and risk.

marsbitHá 32m

Raising Interest Rates Is Not a Tech Killer, EPS Is: A Strategy for Discarding the Weak and Retaining the Strong After the AI Theme's Sharp Decline

marsbitHá 32m

The Largest IPO in History Ignites Heated Debate: Is SpaceX Worth $1.77 Trillion?

SpaceX's potential IPO is priced at $135 per share, aiming to raise $75 billion and valuing the company at approximately $1.77 trillion, which would make it the largest IPO in history. This valuation has sparked intense debate among investors. Bullish analysts, including major underwriters Goldman Sachs and Morgan Stanley, argue the valuation is justified by SpaceX's long-term potential. They see it not just as a rocket company but as a future leader in space infrastructure, with key growth drivers being Starlink satellite internet, low-cost rocket launches, and future AI-related ventures. They project revenues reaching hundreds of billions to trillions of dollars by 2030-2040. ARK Invest's model suggests a 2030 enterprise value could reach $2.5 trillion. Bearish analysts from independent research firms like Morningstar, PitchBook, and New Constructs contend the IPO price is excessively high, already pricing in unrealistic future growth. Using DCF and sum-of-the-parts models, they estimate fair value between $780 billion and $1.7 trillion, significantly below the IPO target. They highlight risks such as the speculative nature of AI projections, over-dependence on Elon Musk, high growth expectations, and corporate governance concerns. Trefis set a target price of just $79 per share. While both sides acknowledge SpaceX's unique position in commercial space, the core disagreement centers on whether the $135 share price offers a reasonable margin of safety or is overly optimistic. Despite the valuation controversy, reported strong demand for the IPO indicates significant market interest.

marsbitHá 2h

The Largest IPO in History Ignites Heated Debate: Is SpaceX Worth $1.77 Trillion?

marsbitHá 2h

After the Passage of the GENIUS Act and the CLARITY Act, What Is the Correct Architecture for On-Chain Yield?

The article discusses the evolution of on-chain credit, distinguishing three markets: overcollateralized crypto lending, unsecured lending (largely unsuccessful), and asset-backed credit (ABC). ABC, backed by identifiable real-world collateral with legal recourse, is identified as the fastest-growing category and the only one credibly addressing adverse selection—the core problem in credit where the riskiest borrowers self-select. Current growth in on-chain Real World Assets (RWAs), particularly tokenized private credit funds (e.g., Maple Finance, Centrifuge), is substantial but often merely "wraps" existing fund structures, inheriting their risks rather than solving adverse selection at the protocol level. The regulatory landscape is a key driver, with the US GENIUS Act (prohibiting stablecoin issuers from paying yield) and the proposed CLARITY Act (closing loopholes on indirect yield) set to redefine permissible yield-bearing products. This makes vaults (like ERC-4626) the critical architecture—they become the primary compliant vehicle for delivering yield, functioning as issuance, disclosure, distribution, and recovery mechanisms. The author's thesis is that the correct post-GENIUS/CLARITY architecture involves building ABC solutions where credit assessment, structure, and recovery are encoded directly into the smart contract vault layer, moving beyond mere tokenized fund wrappers to solve adverse selection fundamentally and ensure regulatory compliance.

Foresight NewsHá 2h

After the Passage of the GENIUS Act and the CLARITY Act, What Is the Correct Architecture for On-Chain Yield?

Foresight NewsHá 2h

Trading

Spot
Futuros
活动图片