Is the US Stock Market Rising Too Smoothly? BTIG Warns of Elevated Risk of Systematic Correction in August to October

marsbitPublicado em 2026-08-17Última atualização em 2026-08-17

Resumo

U.S. Stocks at Risk of Systemic Pullback in August-October, Warns BTIG BTIG's chief technical market strategist warns that the market is entering the most dangerous seasonal window of midterm election years—August through October—trading at all-time highs with extremely low volatility. Historically, since 1990, the equal-weight S&P 500 (SPW) has experienced at least a 7% pullback in this period almost every midterm year, with 2006 being the lone exception. This pattern is often triggered by unforeseen external shocks. Multiple technical indicators flash warning signs. The maximum drawdown for the Invesco S&P 500 Equal Weight ETF (RSP) since March has not exceeded 2.25%, an unusually calm period signaling risk buildup. RSP currently trades about 11% above its 200-day moving average, a stretched level historically. Furthermore, the NYSE has recorded zero "80% downside volume days" in 2024, a record-long streak far below the annual average of 21, indicating a lack of selling pressure that may be overdue. Market complacency is evident with the CBOE put/call ratio near multi-year lows and the VIX at yearly lows, showing minimal demand for downside protection. A macroeconomic divergence adds to concerns: despite recent soft economic data, long-term Treasury yields remain near cycle highs, contradicting the equity market's optimistic pricing. BTIG suggests this is an attractive time to reduce risk or hedge broad equity exposure. For sector positioning, healthcare has historicall...

Author: Zhao Ying, Wall Street Insights

The current "atmosphere is perfect" for US stocks, but historical records are not optimistic.

BTIG's Chief Technical Market Strategist issued a warning in the latest report, stating that the market is entering the most dangerous seasonal window of the year—August to October in a midterm election year—at all-time highs and with extremely low volatility. He bluntly stated that now is a highly attractive opportunity for investors to actively reduce risk exposure or hedge broad equity positions.

The equal-weighted S&P 500 Index (SPW) has gained about 16% year-to-date, with all sectors recording positive returns, indicating that "breadth expansion" has already been achieved. However, historical data shows that since 1990, the S&P index has experienced a correction of at least 7% every year during the period from August 18 to October 11 in midterm election years, with the exception of 2006. Entering this period at historical highs, with the VIX at yearly lows, and protective demand almost non-existent, multiple technical signals are simultaneously flashing warnings.

Seasonal Pattern: The "Cursed Window" of Midterm Election Years

BTIG's data shows that since 1990, the SPW has typically peaked around August 18 in midterm election years, subsequently entering a rather difficult downtrend until mid-October.

In 1990, 1998, 2002, 2010, 2014, 2018, and 2022, there were corrections of at least 7% between August and October. The decline in 1994 was 5%, but it further expanded to 8% by December of that year. The only exception was 2006, but that year had already recorded a 9% decline from May to July, essentially shifting the adjustment period earlier.
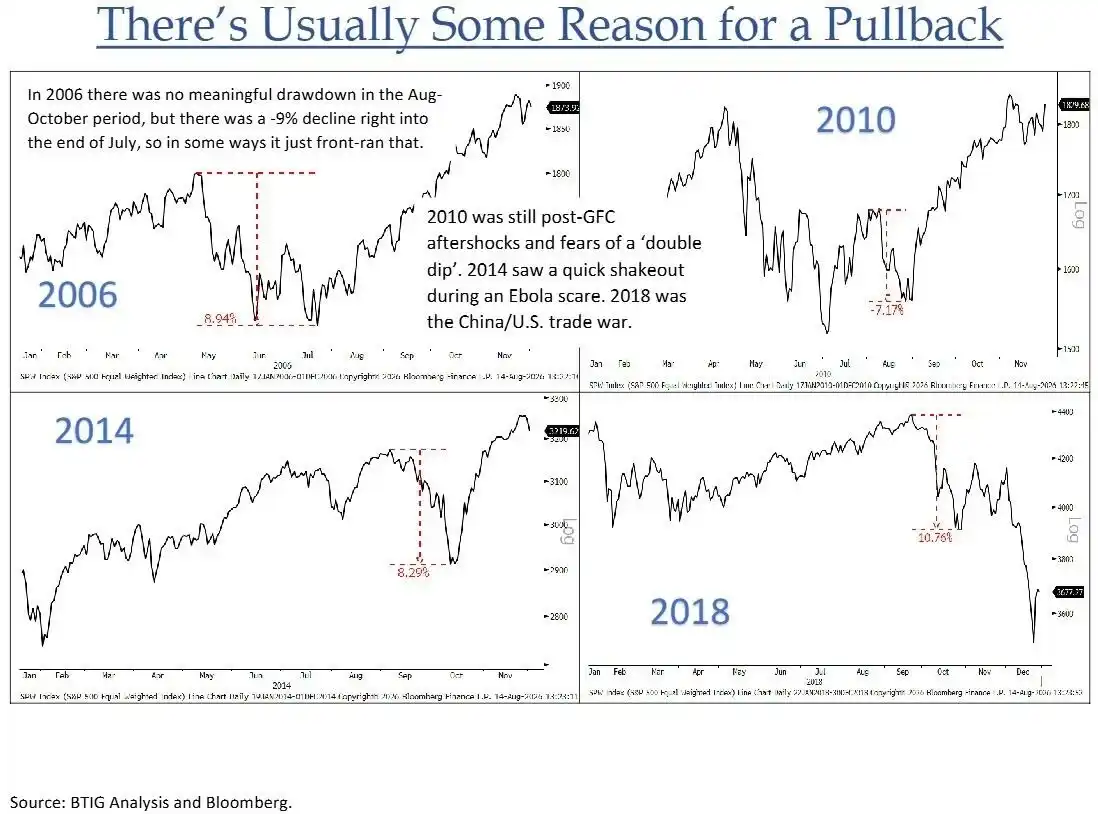
Notably, midterm elections themselves are not always the direct cause of volatility. BTIG points out that it is often an unforeseen external event that triggers the decline—such as the invasion of Kuwait in 1990, the Long-Term Capital Management (LTCM) crisis in 1998, and the Ebola outbreak in 2014. This suggests that the potential risks facing the current market are equally difficult to predict.

Technical Picture: Multiple Indicators Simultaneously Flash Yellow Lights

In addition to seasonal patterns, several current technical indicators point to rising market fragility.

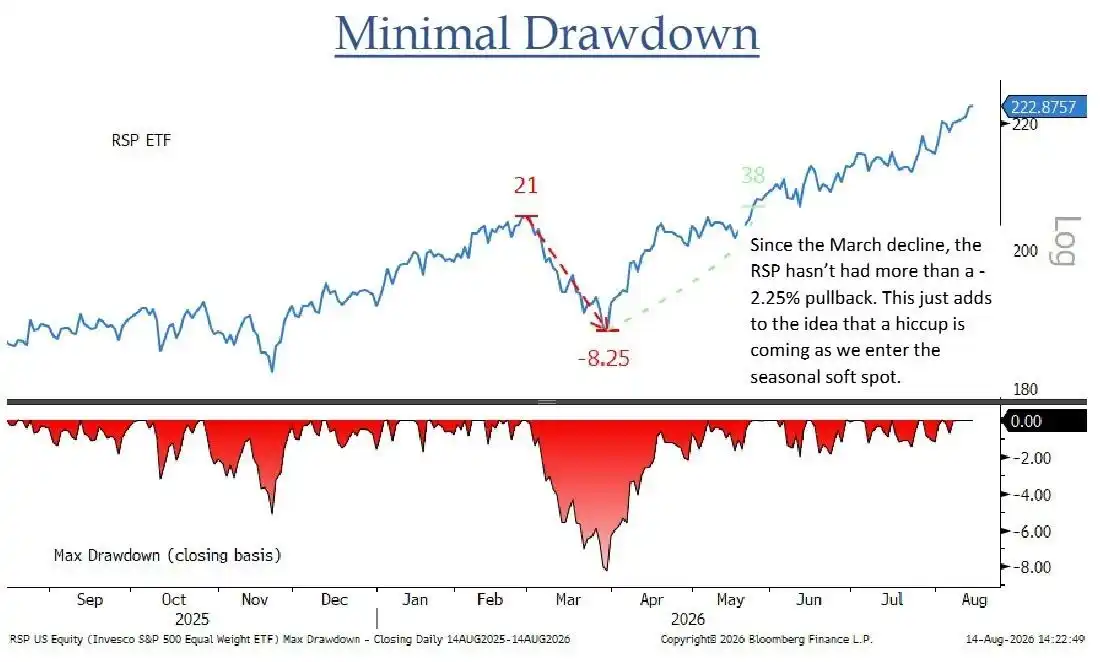
Since the March correction, the maximum drawdown of the Invesco S&P 500 Equal Weight ETF (RSP) has not exceeded 2.25%. This unusual calm itself is a signal of risk accumulation. Meanwhile, the RSP is currently trading about 11% above its 200-day moving average. BTIG notes that, excluding the post-COVID special market conditions, the deviation of RSP from its 200-day moving average typically does not exceed the current level. While the trend is strong, the extent of the stretch is already within the high end of the historical range.
The absence of downside volume signals is also noteworthy. So far this year, the NYSE has not recorded a single "80% Downside Volume Day"—a trading day where downside volume accounts for over 80% of total volume. The historical average is 21 such days per year, and since records began in 1996, no year has had fewer than 5. BTIG states that the current period represents the longest consecutive record without an 80% Downside Volume Day, and the gap is significant.

Sentiment: Market Demand for Protection Falls to Extremely Low Levels

Investor disregard for downside risk is also reflected in the options market. The 10-day moving average of the CBOE equity put/call ratio has fallen to 0.82, sitting at the low end of the range over the past several years, showing that market participants have hardly purchased any protection against potential corrections.

BTIG lists this phenomenon alongside the market being at historical highs and the VIX at yearly lows, suggesting these three factors together paint a complete picture of high market complacency.

Long-End Rate Movement: Bond Market Sends Divergent Signal

On the macro front, a concerning divergence has also emerged. Despite last week's Non-Farm Payrolls, CPI, PPI, and retail sales data all displaying dovish characteristics, US long-term Treasury yields closed near the highest levels of this cycle.

This movement, where "rates ignore favorable data," presents a clear contradiction to the current optimistic pricing in the equity market, adding further uncertainty.

Regarding sector allocation, BTIG points out that historical data shows the healthcare sector has performed relatively resiliently during the August to October period of midterm election years, potentially offering some defensive value.

In semiconductors, the Philadelphia Semiconductor ETF (SOXX) encountered precise resistance at its 50-day moving average. BTIG believes this aligns with the initial rebound pattern following a "blow-off top," expecting the ETF to still seek its 200-day moving average bottom within the year. While the energy sector shows a multi-month breakout, BTIG is cautious about chasing the rally, believing a single headline could reverse the uptrend and does not recommend actively buying high.

BTIG strategist Krinsky concludes that the current moment is an excellent time to reduce risk or hedge broad equity exposure, as "the clock is ticking."


Perguntas relacionadas

QWhat seasonal warning does BTIG issue for the U.S. stock market from August to October in midterm election years?

ABTIG warns that the period from August to October in midterm election years is historically the most dangerous seasonal window for U.S. stocks, with a high risk of a systemic pullback.

QWhat is the historical performance track record of the S&P 500 from mid-August to mid-October in midterm election years since 1990, according to BTIG's data?

AAccording to BTIG's data, since 1990, the S&P 500 has experienced a pullback of at least 7% in almost every midterm election year during the period from around August 18th to October 11th. The only exception was 2006, which had already seen a 9% decline from May to July.

QWhat technical indicators mentioned in the article suggest elevated market vulnerability?

AKey technical indicators include: the RSP ETF's maximum drawdown of no more than 2.25% since March, indicating an unusually calm and potentially risky period; the RSP trading about 11% above its 200-day moving average, a historically high deviation; and the absence of any '80% down volume day' on the NYSE in 2024, the longest such streak on record.

QHow does the article describe current market sentiment and the level of investor protection?

AThe article describes current market sentiment as complacent or overly confident. Investors' demand for protection is extremely low, as evidenced by the CBOE Put/Call Ratio's 10-day moving average falling to 0.82 (a multi-year low), the VIX being at a yearly low, and the market trading at all-time highs.

QAccording to BTIG, which sector tends to be relatively defensive during the August-October period of midterm election years?

AAccording to BTIG's historical data, the healthcare sector has shown relative resilience and tends to perform more defensively during the risky August to October period in midterm election years.

Leituras Relacionadas

CertiK Announces Brand Upgrade, Committed to Building Trust Infrastructure for the Digital Economy

On October 7th, at the TOKEN2049 Singapore conference, CertiK announced a major brand upgrade, positioning itself as "The Trust Layer for Digital Value." This new direction underscores the company's mission to build trust infrastructure for the digital economy. Originating as a smart contract auditor, CertiK has grown into the world's largest Web3 security company. The rebranding reflects its expansion towards serving financial institutions, regulators, and enterprises within the digital asset ecosystem, focusing on integrated security and risk management solutions. Jason Jiang, Chief Business Officer, stated that as digital assets transform value flow, institutions and regulators require combined security, compliance, and clear risk visibility. CertiK's upgraded vision aims to address these needs as a foundational trust layer. To support this broader mission, CertiK offers a suite of products including Skynet (continuous monitoring), CertiK Compliance, CertiK Supervision, and the AI Auditor. Its services encompass smart contract audits, formal verification, penetration testing, proof of reserves, and node validation. This combination helps clients evaluate system security and monitor digital asset risks continuously. Furthermore, CertiK provides technical support for digital asset policy in key jurisdictions like the U.S., Hong Kong, Singapore, and the UAE. It bridges technical security assessments with the practical requirements of regulated digital asset markets through collaboration with regulators and enterprises. Founded in 2017 by professors from Yale and Columbia University, CertiK leverages formal verification expertise. To date, it has served over 5,500 clients across 150+ regions, identifying more than 119,000 code vulnerabilities and helping to safeguard over $600 billion in digital assets. This brand upgrade clearly charts CertiK's next phase: extending its Web3 security expertise into the broader digital economy. By supporting both builders and regulators of digital asset systems, CertiK continues its mission of establishing foundational trust for the digital economy.

marsbitHá 1h

CertiK Announces Brand Upgrade, Committed to Building Trust Infrastructure for the Digital Economy

marsbitHá 1h

Trading

Spot
活动图片