Is Chainlink Ready to Reverse Its Downtrend?

TheNewsCryptoPublicado em 2026-02-26Última atualização em 2026-02-26

Resumo

Chainlink (LINK) is trading around $9.24, showing modest gains amid a broader cryptocurrency market rise. It remains above a key monthly support level between $7 and $7.3, which has historically attracted accumulation. However, LINK continues to trade below its 50-day ($10.63) and 200-day ($16.21) moving averages, both of which are declining, indicating sustained downward pressure. Technical indicators like the RSI (near 49) and MACD show neutral to weak momentum, with no strong bullish signals yet. The price is consolidating within a range, with near-term support at $8.20–$8.80 and resistance at $10.00. Overall, LINK appears to be in a phase of short-term consolidation without a decisive trend.

As the cryptocurrency market rose today, supported by a strong short squeeze and resumed institutional inflows, Chainlink (LINK) has shown modest upside, trading around $9.24, with a daily low of $9.08 and a high of $9.54.

While short-term volatility continues to draw attention, LINK remains positioned above a key monthly low between $7 and $7.3. Strong accumulation and buying interest have historically been seen in this area on longer timeframes. It now represents an important structural level, separating broader downside risk from the potential for a sustained recovery if maintained.

Major altcoins followed Bitcoin’s move, posting notable gains as overall market sentiment shifted away from extreme fear levels. At the time of writing, LINK is priced at $9.25 with a market cap of $6.5 billion. Still, the token’s price action continues to reflect consolidation below key moving averages.

On the daily timeframe, Chainlink remains below its 50-day MA near $10.63 and the 200-day MA around $16.21, with the bearish crossover structure still intact. Both moving averages are sloping downwards, a pattern typically associated with sustained downward pressure. The 50-day MA is currently acting as near-term resistance.

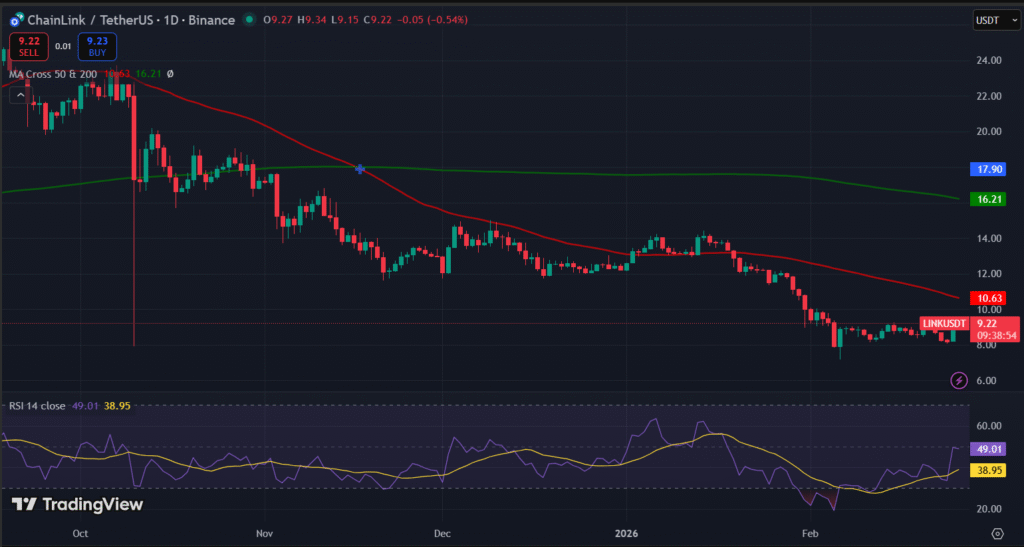
The RSI on the daily chart is near neutral at roughly 49, having rebounded from oversold territory earlier. This indicates that recent selling pressure has eased, but that bullish momentum has not yet strengthened meaningfully.

Zooming in, the MACD indicator remains close to the zero line, with no confirmed bullish crossover. This suggests limited directional momentum in either direction at present.

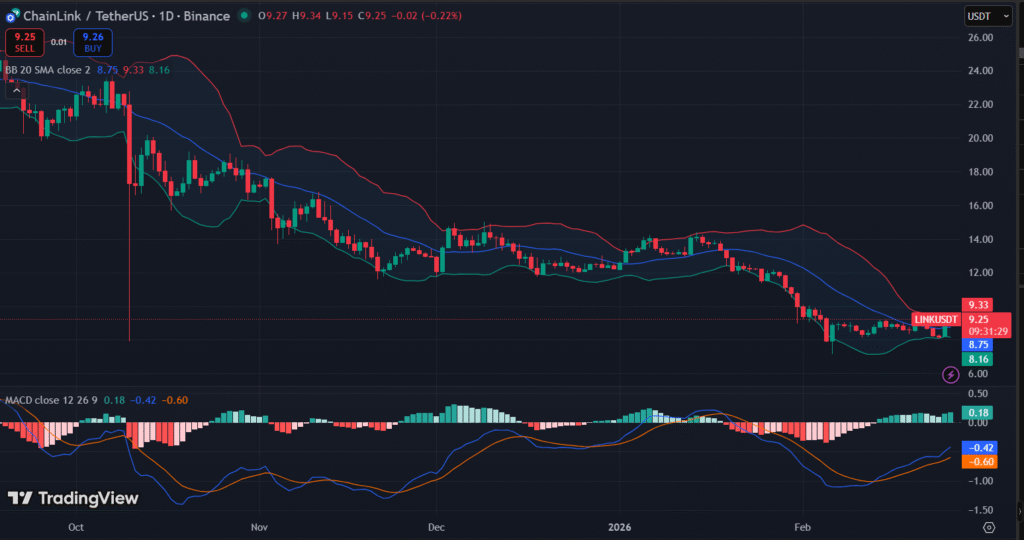
Meanwhile, Bollinger Bands are moderately wide, and the price is trading nearer to the lower band, reflecting recent consolidation and volatility contraction. Price hugging the lower band typically suggests the market is range-bound, rather than signaling a breakout.

If LINK continues the seesaw movement, the immediate support levels are found near the $8.80–$8.20 range, with additional support below these levels if selling pressure intensifies. If momentum picks up further, near-term resistance lies at $10.00, with the 50-day MA serving as a key technical barrier. Overall, Chainlink’s price action suggests continued consolidation in the short term.

TagsAltcoinChainlinkCrypto MarketLINK

Perguntas relacionadas

QWhat is the current price of Chainlink (LINK) and its key daily trading range as mentioned in the article?

AChainlink is trading around $9.24, with a daily low of $9.08 and a high of $9.54.

QAccording to the technical analysis, what are the moving averages acting as resistance for LINK?

AThe 50-day moving average near $10.63 and the 200-day moving average around $16.21 are acting as resistance, with the 50-day MA serving as near-term resistance.

QWhat does the RSI level of approximately 49 indicate about LINK's momentum?

AAn RSI near 49 indicates that recent selling pressure has eased, but bullish momentum has not yet strengthened meaningfully, placing it in a neutral territory.

QWhat key support level does the article identify for LINK if selling pressure increases?

AThe immediate support levels are found near the $8.80–$8.20 range, with additional support below these levels if selling pressure intensifies.

QWhat overall market condition contributed to the rise in major altcoins including Chainlink?

AMajor altcoins rose due to a strong short squeeze and resumed institutional inflows, which shifted overall market sentiment away from extreme fear levels.

Leituras Relacionadas

Lowering Expectations for BTC's Next Bull Market

The author, Alex Xu, explains his decision to significantly reduce his Bitcoin holdings (from full to ~30% of his portfolio) during the current bull cycle, citing a lowered long-term outlook for BTC's price appreciation in the next cycle. He outlines six key reasons for this reduced expectation: 1. **Diminished Growth Drivers:** The narrative of exponential user adoption has largely played out with institutional ETF adoption. The next major growth phase—adoption by sovereign national reserves or central banks—seems unlikely in the near future. 2. **Personal Opportunity Cost:** More attractive investment opportunities have emerged in other assets, such as undervalued companies. 3. **Industry-Wide Contraction:** The broader crypto industry is struggling, with most Web3 business models (SocialFi, GameFi, DePIN) failing. This overall萧条 (depression) reduces the fundamental demand and consensus for Bitcoin. 4. **Strain on Major Buyer:** MicroStrategy, a major corporate buyer of BTC, faces rising financing expenses for its debt, which could slow its purchasing rate and create significant marginal pressure on the market. 5. **Increased Competition from Gold:** The emergence of "tokenized gold" has closed the functional gap (portability, divisibility) between physical gold and Bitcoin, offering a strong competitor in the non-sovereign store-of-value space. 6. **Security Budget Concerns:** The block reward halving continues to exacerbate the long-standing issue of funding Bitcoin's network security, with new fee source explorations like Ordinals and L2s largely failing. The author's decision to hold a significant (though reduced) position reflects a cautious, not bearish, outlook. He remains open to increasing his exposure if the fundamental reasons for his skepticism change or if new positive catalysts emerge.

marsbitHá 27m

Lowering Expectations for BTC's Next Bull Market

marsbitHá 27m

Can Iran 'Control' the Strait of Hormuz?

Iran has announced a comprehensive plan to assert control over the strategic Strait of Hormuz, a critical global oil shipping chokepoint. The proposed measures include requiring all vessels to obtain Iranian permission for passage, imposing fees for security, environmental protection, and navigation management—preferably paid in Iranian rials—and absolutely banning Israeli ships. Vessels from countries deemed hostile by Iran’s top security bodies may also be barred. Analysts suggest Iran’s motives are multifaceted: increasing pressure on the U.S. and Israel by leveraging control over oil transit to influence global prices and inflation; creating a new revenue stream, potentially exceeding $7.7 billion annually, to counter Western sanctions and support postwar reconstruction; and using transit permissions as bargaining chips in future negotiations, notably with the U.S. However, the plan faces significant practical and diplomatic challenges. Enforcing comprehensive interception and fee collection in the busy waterway, patrolled by international military forces, would be difficult. The U.S. has already countering with a blockade of Iranian ports and threats to intercept any ship paying fees, potentially strangling Iran’s oil exports and fee revenue. Broad international opposition, led by European and Gulf states, and legal controversies further complicate implementation. The proposal may ultimately serve more as a negotiating tactic than a feasible policy, with its execution remaining highly uncertain.

marsbitHá 1h

Can Iran 'Control' the Strait of Hormuz?

marsbitHá 1h

Trading

Spot
Futuros
活动图片